e-ISSN: 2278-7461, p-ISSN: 2319-6491
Volume 6, Issue 2 [Feb. 2017] PP: 01-12
Removal of Heavy Metals from Aqueous Solution using Bamboo
Based Activated Carbon
Udeh, N. U
1and Agunwamba, J. C
21Department of Environmental Engineering, University of Port Harcourt, Rivers, Nigeria. 2Department of Civil and Environmental Engineering, University of Nigeria Nuskka, Enugu, Nigeria.
ABSTRACT:-
This study investigated the removal of cadmium and lead from aqueous solution using bamboo activated carbon. Bamboo activated carbon was prepared by physicochemical activation using ZnCl2 at different impregnation ratios (1:2; 1:3; and 1:4) ZnCl2/Bamboo. Batch adsorption studies were conducted to evaluate the optimum conditions for adsorption of cadmium and lead. Their adsorption isotherms were also determined by correlating with Langmuir, Freundlich, Temkin and Hills isotherms models using regression analyses. The kinetic studies were correlated with pseudo first order and pseudo second order equations. The results showed that the amount of cadmium and lead adsorbed increased as the adsorbent dosage decrease while the percentage removal rate increased with increase in cadmium and lead concentrations. High removal efficiency of 83.44% and 96.09% was achieved at pH 9 and pH 11 within 1.5hrs and 1hr using 50µm particle size for cadmium and lead, respectively. The equilibrium data fitted into Freundlich, Temkin and Hills isotherm but fitted precisely into Freundlich isotherm with Kf values of 7.01 and 2.128mg/g for cadmium and lead, respectively. The rate of adsorption could be described by Pseudo second order equation, indicating a chemisorptions process onto heterogeneous surfaces forming multilayer on the surface of activated carbon.Keywords: Adsorbent, Adsorption, Bamboo activated carbon, Isotherm, Kinetic studies.
I.
INTRODUCTION
The release of heavy metals via water pollution has caused enamours threat to the environment and public health due to their toxicity, accumulation in the food chain and persistence in nature [1]. Lead and cadmium are one of the major toxic pollutants, which entered the water streams through various industrial operations such as battery manufacturing, metal planting and finishing, paint manufacturing, petroleum refining, glass manufacturing and many others. Environmental and occupational exposure of these heavy metals can cause severe toxic damage to neuronal system, kidneys, reproductive system, liver and brain [2], [3].Since lead and cadmium do not degrade in the environment, their safe and effective disposal is important. Various treatment options used to remove heavy metals from aqueous solution include chemical precipitation, electrochemical reduction, ion exchange, reverse osmosis, membrane separation and adsorption. Compared with other treatment method, adsorption appears to be an attractive process due to its simplicity, effectiveness and economical in the removal of heavy metals from aqueous solution [4].Commercial activated carbon is the most widely used adsorbent for removal of pollutants from aqueous medium; however its use is restricted due to high cost. Thus, efforts have been geared toward the use of low cost adsorbents for adsorption processes. Natural renewable materials, like bamboo, can be converted into low cost adsorbents [5], [6], [7], [8], [9].The focus of this research is to evaluate the adsorption potential of bamboo-based activated carbon for the removal of lead and cadmium. The use of bamboo sticks as raw materials for manufacturing activated carbon is advantageous as these raw materials are renewable and potentially less expensive. The equilibrium and kinetic studies were investigated to understand the mechanism and nature of the adsorption process.
II.
MATERIALS AND METHODS
2.1 Preparation of Bamboo Activated Carbon
with Zinc Chloride (ZnCl2) (activating agent) at weight ratio of 1:3 (ZnCl2/Bamboo). The resultant mixture was heated to a paste and then washed with distilled water to a pH 6 and then dried in an oven between temperature ranges of 100oC to 110oC for 6 hrs. The sample was named Physically Activated Bamboo Carbon. The PABC was characterized in terms of surface area, porosity, carbon yield and bulk density. The surface area was determined using Sear’s method as reported by [10]. Carbon yield was measured using the method reported by [11]. The dried weight of PABC was determined before and after carbonization and the carbon yield, Ych calculated from Equation 1:
Ych = Wo
Wch × 100%
(1) Where: Wo = mass of bamboo carbon retrieved from the furnace. Wch = mass of air-dried bamboo
samples before carbonization.
The Porosity was calculated from equation (2):
𝑛 = 1 − 𝜌
𝜌𝑤 𝐺𝑠 1+𝑤
(2)
Where: n = Porosity, ρ = Bulk density of AC particles, ρw = Density of water, Gs = Specific gravity of AC
particles and w = Moisture content.
The Bulk density was measured using the method reported by [12] while the moisture content was calculated from equation (3):
𝑤 =𝑊𝑜−𝑊𝑑
𝑊𝑜 × 100% (3)
Where: Wo = original weight (g), Wd = weight after drying (g), w = moisture content (%) The Specific gravity Gs was calculated from equation (4):
2 4
1 3
1 2
M M M
M
M M Gs
(4)
Where M1 = mass of the empty pycnometer, M2 = mass of oven dried AC inside the pycnometer, M3 = mass of
oven dried AC inside the pycnometer filled with water, M4 = mass of pycnometer filled with water.
2.2. Batch Adsorption Studies
The adsorption of Cadmium (Cd) and Lead (Pb) ions from aqueous solution was investigated
by batch method. Wastewater samples were simulated in the laboratory by mixing CdCl
2.2
1
2
H
2O salt
and (Pb(NO
3)
2) salt in distilled water to obtain the desired initial concentrations. All the chemicals
used were of analytical grade. The optimum conditions for the adsorption of Cd and Pb was
investigated.
The effect of adsorbent dose was investigated using 50ml of simulated wastewater samples of pH 7 and 20mg/l initial adsorbate concentration with different adsorbent doses (1, 2, 3, 4 and 5g). The mixtures were attached to a mechanical shaker and then agitated for 1 hr and then filtered through Whatman filter paper (#542) and the filtrates were then separately analyzed for residual concentrations of Cd and Pb using Atomic Adsorption Spectrometer (AAS). The optimum adsorbent dosage for the adsorption of Cd and Pb was noted and adopted for the next experiment. The effect of initial concentrations of Cd and Pb was conducted by adjusting the initial concentration of the adsorbates (10, 20, 30, 40 and 50mg/l) via dilution of the simulated wastewater samples while the optimum condition of adsorbent dosages were adopted. The experimental procedure remained the same and the optimum initial concentrations of Cd and Pb were noted. The effect of agitation time on the adsorption of Cd and Pb was conducted by varying the agitation time (0.5, 1.0, 1.5, 2.0, 2.5 and 3.0hr) but adopting the optimum adsorbent doses and optimum initial concentration of adsorbates. The residual concentration of Cd and Pb was analyzed and their optimum agitation time for adsorption was noted. The effect of adsorbate pH was studied by adjusting the pH to 3, 5, 7, 9 and 11 by adding 0.1M (NaOH) or HCl solutions as the case may be. The optimum adsorbent dosage, initial concentration and agitation time for Cd and Pb were adopted while other test conditions and experimental procedure remained same. Their optimum adsorbate pH was noted. The effect of different particle size was investigated on four particle sizes (425µm, 250µm, 150µm and 50µm) using the optimum values of agitation time, adsorbent dose, initial concentration of adsorbates and pH, while other test procedure remained the same.The adsorption efficiency of the test carbons was used as criterion for determining optimum conditions. The adsorption efficiency was thus calculated from equation (5):% Removal = Co−Ct
Co × 100%
(5)
Where: Co = initial conc. of adsorbate and Ct = finial concentration of the adsorbate after time (t)
Equilibrium studies were performed at room temperature (25oC). The equilibrium adsorption studies were conducted using optimum condition for Cd and Pb to investigate the sorption capacity of PABC. For Cd adsorption, 50ml of simulated wastewater samples of 50mg/l initial Cd conc. and pH-9 were measured into 5 different plastic containers and different adsorbent doses of 0.2, 0.4, 0.6, 0.8 and 1.0g (50 µm size) were added to each of the plastic containers. The mixtures were agitated on a mechanical shaker for 1.5hrs. In the case of Pb, adsorbate pH of 11 and agitation time of 1hr was used. At the end of the adsorption period, the mixtures were filtered and then separately analyzed for residual conc. of Cd and Pb using AAS. The equilibrium adsorption capacity (qe) of the adsorbent was obtained using the mass equilibrium equation given in equation (6):
qe = Co−Ce
M V
(6)
Where: Co is the initial concentrations of the adsorbate (mg/l); Ce is the equilibrium concentration of adsorbate
(mg/l); V is the experimental volume of wastewater (L), M is mass of adsorbent (g).
2.3.1 Adsorption isotherms
Adsorption isotherms are used to describe the relationship between the amount adsorbed and its concentration in the equilibrium solution at constant temperature. The adsorption of Cd and Pb was modelled using Langmuir, Freundlich, Temkin and Hills isotherms. Linear form of Langmuir equation is given in equation (7):
𝐶𝑒
𝑞𝑒 =
1 qo𝐾+
𝐶𝑒
qo
(7)
Where: Ce is equilibrium concentration of the adsorbate (mg/l), qe is mass of solute adsorbed per unit mass of adsorbent, qo is a constant related to the adsorption capacity (mg/g) and K is experimental constant.
Linear form of Freundlich equation is given in equation (8):
log qe = log k + 1
nlog Ce
(8)
Where: Ce is equilibrium concentration of the adsorbate, qe is mass of solute adsorbed per unit mass of adsorbent, k and n are Freundlich constants representing the adsorption capacity of adsorbents and the intensity of the adsorption, respectively.
Linear form of Temkin equation is given in equation (9):
𝑞𝑒 = 𝑅𝑇
𝑏𝑇log 𝐴𝑇+
𝑅𝑇 𝑏𝑇log 𝐶𝑒 (9)
Where: bT and AT are the Temkin constants, AT is the equilibrium binding constant corresponding to the
maximum binding energy, bT is related to the heat of adsorption (J/mol), R is the universal gas constant (8.314)
J/mol K) and T is the absolute temperature in kelvin (K).
Linear Form of Hills equation is given in equation (10):
𝐿𝑜𝑔 𝑞𝑒
𝑞𝑆𝐻−𝑞𝑒 = 𝑛𝐻𝑙𝑜𝑔 𝐶𝑒− 𝑙𝑜𝑔𝐾𝐷 (10)
Where qSH, nH and KD are Hill isotherm constants.
Note that nH is Hills coefficient describing cooperativity. If nH >1= positive cooperative binding (the binding of one molecule onto the adsorbent, increases the affinity for other molecules to bind) while nH < 1 = negative cooperative binding (the binding of one molecule onto the adsorbent decreases the affinity for other molecules to bind). However, nH = 1 non cooperative binding (the affinity of the adsorbate to bind onto the adsorbent is not dependent on whether or not other molecules are already bound).
2.4. Batch Kinetics Study
The adsorption kinetics was processed at varying time intervals using two initial concentrations (50 and 100mg/l) of Cd and Pb. For Cd adsorption, 0.2g of bamboo activated carbon were mixed with 50ml of Cd solution (pH 9) and (50u size) and then attached to a mechanical shaker. The samples were agitated and then taken at intervals of (5, 10, 20, 30, 40, 50, 60, 70, 80, 100 and 120 mins) and filtered. The concentrations of Cd at these time intervals were analyzed with AAS. The same procedures were replicated for Pb using pH 11. The samples were taken at intervals of (10, 20, 40, 60, 80, 100, 120,140, 160 and 180 mins) and then filtered. The adsorption capacity of the adsorbents at preset time (t), qt, was calculated from equation (11):
qt= Co−Ct
M V
(11)
Where: Co is the initial concentrations of the adsorbates (mg/l); Ct is the concentration of the adsorbate at any
2.4.1 Kinetics of Adsorption
In order to investigate the mechanism of adsorption, the Pseudo first order and Pseudo second order equations developed by [13] were used to investigate rate of Cd and Pb removal.
The Pseudo first order equation in Logarithmic form is given in equation (12):
log qe− qt = log qe − Kp 1
2.303t
(12)
Where:qeis the adsorption capacity at equilibrium (mg/g), qtis the adsorption capacity at time t(mg/g), kp1, is the rate constant of first order adsorption (mg/mins).
Linear form of Pseudo Second order equation is given in equation (13):
t
qt =
1 kp 2qe2+
1
qet
(13)
Where: kp2 is the rate constant of pseudo second order adsorption (mg/min).
III.
RESULTS AND DISCUSSION
3.1 Characterization of Bamboo Carbon
The results on the characterization of PABC are presented on Table 1. Similar observations were reported by [9] & [7].
Table 1: Characterisation of Bamboo Activated Carbon (PABC)
Parameters Value
Surface area (m2/g) Bulk density (g/cm3)
Specific gravity Moisture content (%)
Porosity Ash content (%) Carbon yield (%)
pH
359 0.56 1.28 2.95 0.89 6.70 27.69
6.6
3.2 Optimum Conditions for Adsorption of Cadmium and Lead
The results of the batch adsorption for the removal of cadmium and lead from simulated wastewater onto bamboo activated carbon are shown in Fig. 1 to 5.
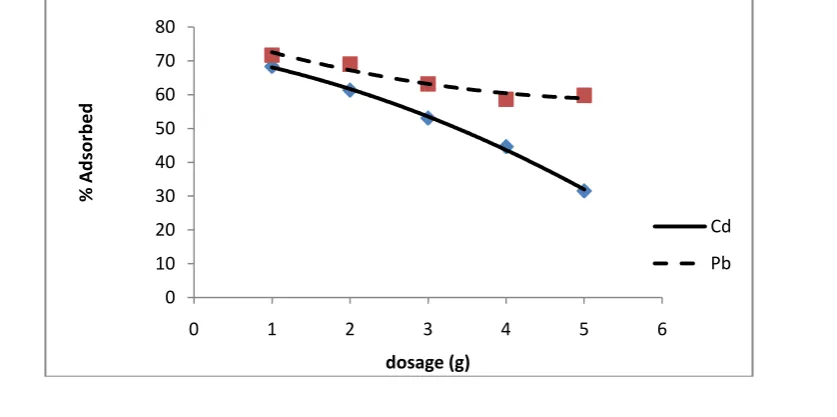
3.2.1 Effects of Adsorbent dose
The effects of different adsorbent doses on adsorption of cadmium and lead on PABC revealed that as the adsorbent dosage increased, the amount adsorbed per unit mass of the adsorbent decreased as shown in Figure 1. This decrease in unit adsorption may be due to adsorption sites remaining unsaturated during adsorption [14]. Thus, more active sites are utilized at lower adsorbent dose, producing higher adsorption efficiency, while only part of active sites were occupied by Cd and Pb ions at higher adsorbent dose, leading to lower adsorption efficiency [15]. Therefore, removal efficiency of 68.32% and 71.64% for Cd and Pb respectively were achieved. Thus, the optimum dosage of 1g was used for further studies.
0 10 20 30 40 50 60 70 80
0 1 2 3 4 5 6
%
A
d
sor
b
e
d
dosage (g)
Cd
Figure 1: Cadmium and Lead removal as a function of Adsorbent Dose 3.2.2 Effect of Initial Adsorbate Concentration
The effect of different initial concentration of Cd and Pb on adsorption onto PABC showed that the percentage removal rate increased with increase in ion concentration as shown in Fig. 2. This may be that more metal ions are available in the solution for the adsorption at higher concentration [16]. Thus, Cd and Pb removal was highly dependent on concentration and this might also be due to high driving force for mass transfer at higher concentrations [9]. Optimum removal efficiency of 74.63% and 88.34% at 50mg/l were observed for Cd and Pb respectively.
Figure 2: Cadmium and Lead removal as a function of Initial Conc.
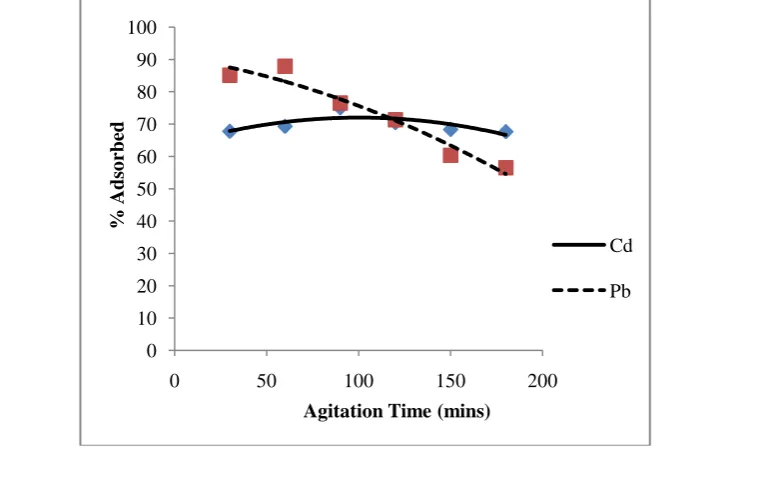
3.2.3 Effect of Agitation Time
The effects of agitation time on the adsorption of Cd and Pb onto PABC revealed an increase in adsorption of the metal ion with increase in agitation time and this may be due to increase in kinetic energy of the metal ions and decrease in boundary layer resistance due to mass transfer in the bulk solution. Similar observation was made by [17]. The removal efficiency increased with time and attained at 90 mins (72%) for Cd and 60 mins (87.84%) for Pb as shown in Fig. 3.
0
10
20
30
40
50
60
70
80
90
100
0
20
40
60
%
Ad
so
rbed
Initial Conc. (mg/l)
Cd
Pb
0 10 20 30 40 50 60 70 80 90 100
0 50 100 150 200
%
Ads
o
rbed
Agitation Time (mins)
Cd
Figure 3: Cadmium and Lead removal as a function of Agitation time
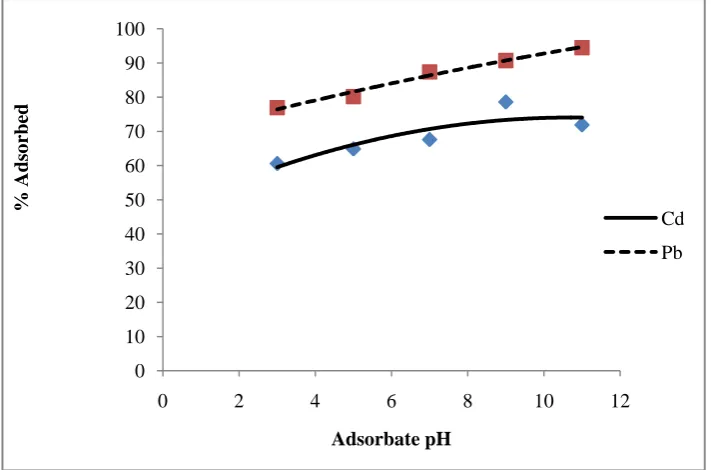
3.2.4 Effects of pH
The adsorbate pH affects the solubility of the metal ions. The effects of pH on Cd and Pb removal onto PABC tend towards alkaline as shown in Fig. 4. At lower pH value, the H+ ions compete with the metal cation for adsorption sites [18],[19] while at extreme acidic condition, the metal cations are completely released [20]. High removal efficiency of 78.57% at pH-9 was observed for Cd removal while 94.49% at pH-11 was observed for Pb. Thus, alkaline medium tend to support adsorption of Cd and Pb with PABC more than acidic medium.
Figure 4: Cadmium and Lead removal as a function of Adsorbate pH
3.2.5 Effects of Particle Size
The removal rate of Cd and Pb increased with smaller particle size as shown in Fig. 5. This may be that smaller particle produces shorter time to equilibrium. High removal efficiency of 83.44% and 96.09% was achieved with 50 µm particle size for Cd and Pb removal respectively.
Figure 5: Cadmium and Lead removal as a function of Particle size
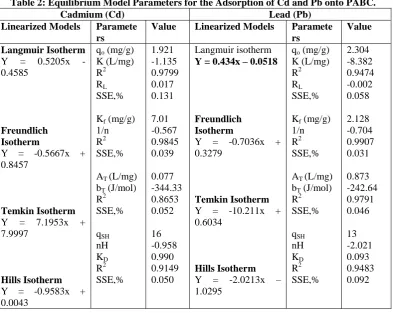
3.3 Equilibrium Adsorption
Results from the equilibrium adsorption of Cd and Pb onto PABC were modelled using Langmuir, Freundlich, Temkin and Hills isotherm models in order to obtain the best fitting isotherm. The linear correlation of equilibrium data with Langmuir, Freundlich, Temkin and Hills equations gave high correlation coefficient (R2)
0 10 20 30 40 50 60 70 80 90 100
0 2 4 6 8 10 12
%
Ad
so
rbed
Adsorbate pH
Cd
Pb
0
20
40
60
80
100
120
0
100
200
300
400
500
%
Ads
o
rbed
Particle Size (µm)
Cd
for both Cd and Pb Adsorption. The linear models and the corresponding isotherm parameters for all the isotherm models tested are presented in Table 2.
Table 2: Equilibrium Model Parameters for the Adsorption of Cd and Pb onto PABC.
Cadmium (Cd) Lead (Pb)
Linearized Models Paramete rs
Value Linearized Models Paramete rs
Value
Langmuir Isotherm
Y = 0.5205x - 0.4585
Freundlich Isotherm
Y = -0.5667x + 0.8457
Temkin Isotherm
Y = 7.1953x + 7.9997
Hills Isotherm
Y = -0.9583x + 0.0043
qo (mg/g) K (L/mg) R2 RL SSE,%
Kf (mg/g) 1/n R2 SSE,%
AT (L/mg) bT (J/mol) R2 SSE,% qSH nH KD R2 SSE,% 1.921 -1.135 0.9799 0.017 0.131 7.01 -0.567 0.9845 0.039 0.077 -344.33 0.8653 0.052 16 -0.958 0.990 0.9149 0.050 Langmuir isotherm
Y = 0.434x – 0.0518
Freundlich Isotherm
Y = -0.7036x + 0.3279
Temkin Isotherm
Y = -10.211x + 0.6034
Hills Isotherm
Y = -2.0213x – 1.0295
qo (mg/g) K (L/mg) R2 RL SSE,%
Kf (mg/g) 1/n R2 SSE,%
AT (L/mg) bT (J/mol) R2 SSE,% qSH nH KD R2 SSE,% 2.304 -8.382 0.9474 -0.002 0.058 2.128 -0.704 0.9907 0.031 0.873 -242.64 0.9791 0.046 13 -2.021 0.093 0.9483 0.092
3.3.1 Model Verification
The isotherm models were verified with another set of experimental data. The calculated isotherm parameters were fitted into the isotherm model equations to get the calculated qe values. For Cd removal, the Experimental qe (Exp qe) and Calculated qe (Cal qe) correlated with Freundlich, Temkin and Hills models but did not correlate with Langmuir models. In the case of Pb removal, the Exp. qe and Cal. qe correlated with Freundlich, Temkin and Langmuir but did not correlate with Hills models. These are shown in Figs. 6 to 11.
Figure 6: Freundlich Exp and Cal qe for Adsorption of Cd Figure 7: Freundlich Exp and Cal qe for Adsorption of Pb
R² = 0.920
R² = 0.985
0 5 10 15 20 25 30
0 0.5 1 1.5
q e (m g/ g) dosage (g) qe Exp qe Cal
R² = 0.917
R² = 0.960
0 5 10 15 20 25 30
0 0.5 1 1.5
Figure 8: Temkin Exp and Cal qe for Adsorption of Cd Figure 9: Temkin Exp and Cal qe for Adsorption of Pb
Figure 10: Hills Exp and Cal qe for Adsorption of Cd Figure 11: Langmuir Exp and Cal qe for Adsorption of Pb
3.3.2 Test for Isotherm Models
The applicability of these isotherm models was further verified using the sum of error squares (SSE, %) calculated from equation (14) using Excel software:
SSE,(%) = (𝑞𝑒,𝑒𝑥𝑝−𝑞𝑒,𝑐𝑎𝑙)2
𝑁
(14) Where: N is the number of data points.
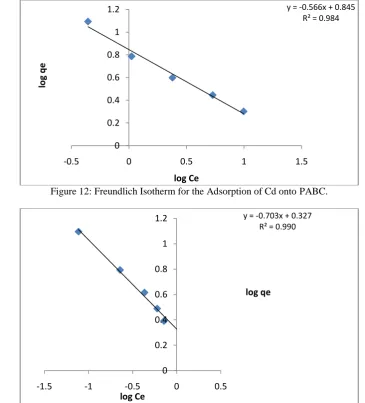
Results of the SSE,% for each isotherm model presented in Table 2, showed that Freundlich isotherm model had the smallest SSE,% value for both Cd (0.039%) and Pb (0.031%) adsorption. Note that the higher the value of R2 and the lower the value of SSE,% the better will be the goodness of fit. From these results, the adsorption of Cd onto PABC fitted into Freundlich, Hills and Temkin model but could be best described by Freundlich isotherm while the adsorption of Pb onto PABC fitted into Freundlich, Temkin and Langmuir but could be best described by Freundlich. This indicates a chemisorption process onto heterogeneous surfaces forming multilayer on the surface of PABC. Similar observations were made by [9] & [21]. The Freundlich isotherm for the adsorption of Cd and Pb are shown in Figs. 12 and 13.
R² = 0.920 R² = 0.997
0 5 10 15 20 25 30
0 0.5 1 1.5
q
e
(m
g/
g)
doage (g)
qe Exp
qe Cal
R² = 0.917 R² = 0.996
0 5 10 15 20 25 30
0 0.5 1 1.5
q
e
(m
g/
g)
dosage (g)
qe Exp
qe Cal
R² = 0.920 R² = 0.998
0 5 10 15 20 25 30
0 0.5 1 1.5
q
e
(m
g/
g)
dosage (g)
qe Exp qe Cal
R² = 0.917
R² = 0.996
0 5 10 15 20 25 30
0 0.5 1 1.5
q
e
(m
g/
g)
dosage (g)
Figure 12: Freundlich Isotherm for the Adsorption of Cd onto PABC.
Figure 13: Freundlich Isotherm for the Adsorption of Pb onto PABC.
3.4 Adsorption Kinetics
The rate of adsorption of Cd and Pb onto PABC was modelled using Pseudo-first order and Pseudo second order equations. The integrated form of Pseudo first order equation is given in equation (15).
Log qe− qt = Log qe − kp1 t
(15)
The linearized form of the integrated Pseudo second order equation is given in equation (16)
t
qt = 1 kp 2qe2+
1 qet
(16)
Where: qe is the adsorption capacity at equilibrium (mg/g), qt is the adsorption capacity at time t (mg/g), kp1, is the rate constant of first order adsorption (mg/mins) and kp2,is the rate constant for second order adsorption (mg/mins).
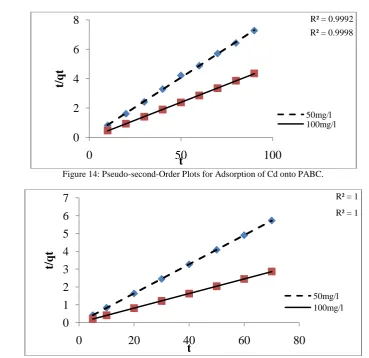
The experimental data were linearly correlated with Pseudo First order and Pseudo second order models. Correlation with Pseudo First Order equation gave very low correlation efficient (R2) ranging between 0.0453 and 0.4135 for the two adsorbate concentrations tested. Also, the Exp qe and the Cal qe values did not correlate thus, adsorption of Cd and Pb onto PABC do not follow First Order kinetics.However, the Pseudo Second Order equation gave high correlation coefficient (R2) ranging between 0.9992 and 1.000 for both Cd and Pb adsorption. A correlation was observed between the Exp qe and the Cal qe values as shown in Figs. 14 and 15.
y = -0.566x + 0.845 R² = 0.984
0 0.2 0.4 0.6 0.8 1 1.2
-0.5 0 0.5 1 1.5
lo
g q
e
log Ce
y = -0.703x + 0.327 R² = 0.990
0 0.2 0.4 0.6 0.8 1 1.2
-1.5 -1 -0.5 0 0.5
log qe
Figure 14: Pseudo-second-Order Plots for Adsorption of Cd onto PABC.
Figure 15: Pseudo-Second-Order Plots for Adsorption of Pb onto PABC
3.4.1 Test for Kinetic Model
The test for kinetic models was calculated from equation (14) using Excel software. From the results as presented in Table 3, Pseudo second order kinetic model had the least error (0.006 and 0.002) for both Cd and Pb removal respectively. Thus, the adsorption of Cd and Pb fitted well into Pseudo Second Order Kinetics. This suggests that Chemisorption may be the limiting step in the adsorption process. Similar observation was reported by [22]. The linear models and the corresponding kinetic constants for all the kinetic models tested are presented in Table 3.
Table 3: Kinetic Parameters and Exp. and Cal qe for Cd and Pb Adsorption onto PABC Metals Cd Pb Co 50 100 50 100
Pseudo First Order Pseudo Second Order
Exp qe 12.45 21.49 12.24 24.69 Cal qe 0.06 6 0.09 8 0.10 4 0.39 3 Kp1 0.008 0.011 -0.018 -0.004 R2 0.160 1 0.413 5 0.135 9 0.045 3 SSE (%) 0.175 0.192 Exp qe 12.45 21.49 12.24 24.69 Cal qe 12.38 20.58 12.25 24.45 Kp2 0.21 -0.053 0.600 1.673 R2 0.999 2 0.999 8 1.000 1.000 SSE (%) 0.006 0.002 R² = 0.9992
R² = 0.9998
0
2
4
6
8
0
50
100
t/qt
t
50mg/l 100mg/l
R² = 1 R² = 1
0
1
2
3
4
5
6
7
0
20
40
60
80
t/qt
t
IV.
CONCLUSION
This study showed the adsorptive capacity of Physiochemical Activation Bamboo Carbon (PABC) for the removal Cd and Pb ions from wastewater. The batch adsorption studies revealed a high removal efficiency of 83.44% at pH-9 within 90mins for 50mg/l initial Cd conc. In the case of lead, high removal efficiency of 96.09% at pH-11 was achieved within 60mins. The adsorption behaviour of Cd and Pb was described by Freundlich, Temkin and Hills Isotherms but the equilibrium data fitted best into the Freundlich equation indicating multilayer adsorption on heterogeneous surface. The kinetic data follows Pseudo second order kinetic model suggesting that chemisorptions may be the rate limiting step in the adsorption process. This study showed that the PABC can remove Cd2+ and Pb+ ions from aqueous solution to avert expensive commercial adsorbents. Models from these results can be used in treatment of wastewater containing cadmium or lead.