OncoTargets and Therapy 2016:9 7555–7561
OncoTargets and Therapy
Dove
press
submit your manuscript | www.dovepress.com 7555
O r i g i n a l r e s e a r c h
open access to scientific and medical research
Open access Full Text article
Evaluation of the efficacy of chemoradiotherapy
in cervical cancer using diffusion-weighted imaging
and apparent diffusion coefficient
Fa-Jun Ju
Department of radiology, Yishui central hospital, linyi, People’s republic of china
Objective: This study aims to evaluate the efficacy of chemoradiotherapy (CRT) in cervical cancer using diffusion-weighted imaging (DWI) with apparent diffusion coefficient (ADC) values. Methods: A total of 71 patients with cervical cancer were enrolled in this study. All patients underwent conventional magnetic resonance imaging and DWI scanning before CRT and at 7, 14, 21 days, and 6 months after CRT. These patients were divided into the complete response (CR) and non-CR groups according to the response evaluation criteria in solid tumors criteria. Receiver operating characteristic (ROC) curve was used to evaluate the accuracy of ADC values in predicting the efficacy of CRT in cervical cancer.
Results: Compared with before-CRT treatment, tumor volumes were reduced and ADC values were elevated in both CR and non-CR groups after CRT treatment. At 21 days after CRT, tumor volumes in the CR group were smaller than those in the non-CR group. During the period of 21 days to 6 months after CRT, tumor regression rate and the increased rate of ADC values in the CR group were higher than those in the non-CR group. ROC curves revealed that the increased rate of ADC values at 21 days after CRT was the optimal time point for the prediction of CRT efficacy in cervical cancer, with the area under the curve, sensitivity, and specificity of 0.775, 92.7%, and 62.5%, respectively.
Conclusion: Our study provides evidence that the increased rate of ADC at 21 days after CRT might be a promising tool for predicting the efficacy of CRT in cervical cancer.
Keywords: diffusion-weighted imaging, cervical cancer, apparent diffusion coefficient, chemoradiotherapy, efficacy
Introduction
Cervical cancer is the second most common cause of cancer-related death, responsible
for ~250,000 annual death.1 Globally speaking, the risk of developing cervical cancer
ranges from 0.69% in developed countries to 1.38% in developing countries,
indicat-ing a higher incidence of cervical cancer in developindicat-ing countries.2 Persistent infection
with high-risk human papillomavirus is the main risk factor for the development of
cervical cancer.3 The most important treatments of cervical cancer are surgery and
radiotherapy and as a part of chemoradiation or neoadjuvant therapy, chemotherapy
is also used in the primary treatment of cervical cancer.4 Nevertheless, the evaluation
on the efficacy of treatment still remains an important problem, which has become a hot spot in cancer research.
Diffusion-weighted imaging (DWI) provides qualitative and quantitative func-tional information concerning the microscopic movements of water at the cellular
level.5 It can be used to measure apparent diffusion coefficients (ADCs), which is a
correspondence: Fa-Jun Ju
Department of radiology, Yishui central hospital, no 17, Jiankang road, linyi 276400, shangdong Province, People’s republic of china
Tel +86 539 226 0337 email [email protected]
Journal name: OncoTargets and Therapy Article Designation: Original Research Year: 2016
Volume: 9
Running head verso: Ju
Running head recto: ADC predicting CRT efficacy in cervical cancer DOI: http://dx.doi.org/10.2147/OTT.S111829
OncoTargets and Therapy downloaded from https://www.dovepress.com/ by 118.70.13.36 on 25-Aug-2020
For personal use only.
Number of times this article has been viewed
This article was published in the following Dove Press journal: OncoTargets and Therapy
Dovepress
Ju
quantitative measure of the diffusivity of water and provides information related to tumor cellularity and the integrity
of cell membranes.6 As a quantitative measurement index
of DWI, ADC represents the mobility of water molecules within tissues and is, thus, believed to reflect the change in tumor cellularity and the development of microscopic tumor necrosis before these changes are visible on conventional
anatomic images.7 ADC measurement has been reported to
be helpful in differentiating benign from malignant hepatic lesions and to be valuable as a biomarker that may allow the prediction and early detection of the treatment response
of malignant tumors.8 At the very beginning, the utility of
DWI was applied in the central nervous system. With the development of equipment and rapid imaging technology, DWI is widely used in the diagnosis and treatment efficacy
evaluation of various organ tumors.9 Onal et al have reported
that DWI is a common tool applied in cervical cancer.10
However, there were no detailed explanations for its working mechanism. Therefore, this study aims to further investigate the efficacy of chemoradiotherapy (CRT) for cervical can-cer using DWI with ADC values, in order to provide some additional information for monitoring the efficacy of CRT in cervical cancer.
Materials and methods
ethical statement
The study was performed with the approval of Ethics Committee in Yishui Central Hospital in accordance with medical ethics standards. Written informed consents for each patient were collected.
subjects
A total of 71 patients with cervical cancer admitted in Yishui Central Hospital from June 2012 to June 2015 were collected for the current study. The mean age of these patients was
45.57±10.1 years (ranging from 21 to 67 years). The
inclu-sion criteria for each eligible patient were 1) patients with definite pathological diagnosis of cervical squamous cancer, 2) patients received no treatment before the first magnetic resonance imaging (MRI) scan, 3) patients received norma-tive CRT, and 4) patients with complete clinical and MRI data. The exclusion criteria were 1) patients with contrain-dications or failing to complete corresponding inspections, 2) patients received other tumor-related treatment before examination, 3) patients failed to finish five times of MRI monitoring, and 4) patients older than 70 years or with serious cardiovascular disease. There were 65 cases of squamous car-cinoma and 6 cases of adenocarcar-cinoma. Among 65 patients with cervical squamous carcinoma, 12 cases were with high
differentiation, 40 cases with moderate differentiation, and 13 cases with low differentiation. On the basis of the FIGO stage classification, 4 patients were Ib stage, 21 patients were IIa stage, 14 patients were IIb stage, 6 patients were IIIa stage, and 26 patients were IIIb stage.
Treatment regimen
Irradiation of 45 Gy median external beam (ranging from 36 to 50.4 Gy) was performed on patients in 25 fractions (ranging from 20 to 28) with a midline block of median 36 Gy (ranging from 21 to 45 Gy). Subsequently, a high-dose ICR rate of median 30 Gy was applied (ranging from 21 to 50 Gy) in 6–13 fractions at point A with 192Ir or 60Co as
sources. Meanwhile, platinum chemotherapy of 40 mg/m2
with a median 6 cycles (ranging from 1 to 9) was conducted on patients once a week for 6–8 weeks.
Mri scanning
Each patient received normative MRI and DWI scanning before CRT (1 week prior to MRI detection) and at 7, 14, 21 days, and 6 months after CRT. ADC values were obtained from DWI scanning, which used GE 1.5T superconduct-ing MRI instrument. The scannsuperconduct-ing sequence consisted of conventional MRI and DWI. Three-dimensional MIP was applied to draw lesion range layer by layer of each time point
on T2-weighted imaging and calculated the tumor volume
according to the slice thickness and slice gap. The conven-tional MRI-related variables were TR 3,324 ms, TE 90 ms, slice thickness 4 mm, spacing 1 mm, excitation frequency 2,
FOV 26 cm ×28 mm, and matrix 256×256. Single-shot
spin-echo echo-planar imaging was used in DWI, and the relevant parameters were TR 4,000 ms, TE 77.8 ms, 5 mm
depth, 1 mm space, 4-time excitation, FOV 36 cm ×36 mm,
matrix 128×128, and b value: 0, 800 s/mm2. ADC values of
cervical lesion were determined by the average of three mea-sured variables. Tumor regression rate: %ΔV = (Vpre− Vpost)/ Vpretreatment×100 (Vpre and Vpost refers to tumor volumes before
and after each time point and Vpretreatment to tumor volumes
before CRT treatment). The increased rate of ADC values: %ΔADC = (ADCpost− ADCpre)/ADCpretreatment×100 (ADCpre and
ADCpost refers to ADC values before and after each time point
and ADCpretreatment to ADC values before CRT treatment).
Efficacy evaluation
At 6 months after CRT treatment, follow-up was conducted to evaluate CRT efficacy in accordance with response evaluation criteria in solid tumors (RECIST) by measuring the lesion size
and signal intensity.11 The RECIST criteria mainly included
complete response (CR) with complete disappearance of the
OncoTargets and Therapy downloaded from https://www.dovepress.com/ by 118.70.13.36 on 25-Aug-2020
Dovepress ADC predicting CRT efficacy in cervical cancer
tumor, partial response (PR) with the decrease in maximum
tumor diameter .30%, stable disease (SD) with the change
in maximum tumor diameter between PR and progressive disease (PD), and PD with the increase in maximum tumor
diameter .20% or carcinoma cells transferring to other parts.
The patients were divided into the CR group and the non-CR
group (PR+SD+PD) according to the detection results.
statistical analysis
The data were analyzed by SPSS 21.0 (SPSS Inc, Chicago, IL, USA) statistical software, and measurement data were
expressed in mean ± standard deviation (x¯ ± SD) and tested
using paired t-test. As enumeration data were expressed in
percentage, χ2 test was used. Bivariate correlation analysis
was used to calculate Pearson’s coefficient to analyze the relationship of ADC values and tumor volumes before and 6 months after CRT. Receiver operating characteristic (ROC) curve was used to evaluate the accuracy of ADC values in
predicting the efficacy of CRT in cervical cancer. P,0.05
was considered statistically significant.
Results
changes in tumor volumes before and
after crT treatment
At 6 months after CRT, there were 55 patients in the CR group
and 16 (patients of PR: n=16, no patient with PD and SD) in
the non-CR group. As shown in Table 1, tumor volumes at each time point after CRT treatment in the CR and non-CR groups were significantly smaller than those before CRT
treatment (all P,0.05, Figure 1). Tumor regression rates at
21 days after CRT treatment in both CR and non-CR groups were higher than those at 7, 14 days, and 6 months after CRT
treatment (all P,0.05). Compared with the non-CR group,
tumor volumes in the CR group revealed no significant dif-ference among before CRT treatment and at 7, 14 days after
CRT treatment (all P.0.05). However, tumor volumes in the
CR group were lower than that in the non-CR group at 21 days
after CRT treatment (P,0.05). During the period of 21 days to
6 months after CRT treatment, tumor regression rate in the CR
group was higher than that in the non-CR group (P,0.05).
changes in aDc values before and after
crT treatment
As shown in Table 2, the ADC values at each time point after CRT treatment in the CR and non-CR groups were
signifi-cantly higher than those before CRT treatment (all P,0.05,
Figure 2). The increased rate of ADC values at 21 days after CRT treatment in the CR and non-CR groups were also higher than those at 7, 14 days, and 6 months after CRT treatment
(all P,0.05). The ADC values in the CR group showed
no difference with those in the non-CR group both before
and after CRT treatment (all P.0.05). During the period of
21 days to 6 months after CRT treatment, the increased rate of ADC values in the CR group was also higher than that in
the non-CR group (P,0.05).
correlation between aDc values and
tumor volumes before and after crT
treatment
The ADC values before CRT treatment were negatively cor-related with tumor volumes before CRT and tumor regression
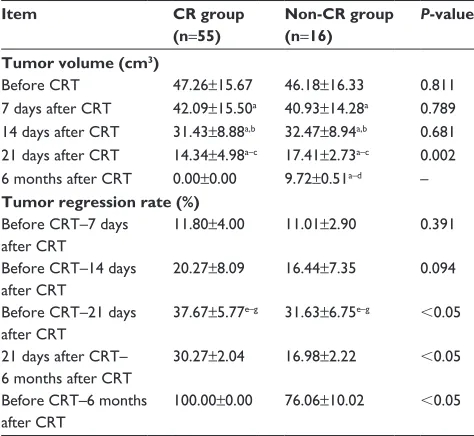
Table 1 changes in tumor volumes at different time points before and after crT treatment in the cr and non-cr groups
Item CR group
(n=55)
Non-CR group (n=16)
P-value
Tumor volume (cm3)
Before crT 47.26±15.67 46.18±16.33 0.811
7 days after crT 42.09±15.50a 40.93±14.28a 0.789 14 days after crT 31.43±8.88a,b 32.47±8.94a,b 0.681 21 days after crT 14.34±4.98a–c 17.41±2.73a–c 0.002 6 months after crT 0.00±0.00 9.72±0.51a–d –
Tumor regression rate (%)
Before crT–7 days after crT
11.80±4.00 11.01±2.90 0.391
Before crT–14 days after crT
20.27±8.09 16.44±7.35 0.094
Before crT–21 days after crT
37.67±5.77e–g 31.63±6.75e–g ,0.05
21 days after crT– 6 months after crT
30.27±2.04 16.98±2.22 ,0.05
Before crT–6 months after crT
100.00±0.00 76.06±10.02 ,0.05
Notes:aP,0.05 when compared with that before crT treatment; bP,0.05 when
compared with 7 days after crT treatment; cP,0.05 when compared with 14 days
after crT treatment; dP,0.05 when compared with 21 days after crT treatment; eP,0.05 when compared with before crT-7 days after crT treatment; fP,0.05
when compared with before crT-14 days after crT treatment; gP,0.05 when
compared with 21 days after crT-6 months after crT.
Abbreviations: cr, complete response; crT, chemoradiotherapy.
%HIRUH G G
7LPHSRLQW
7XPRUYROXPHFP
G P
&5JURXS 1RQ&5JURXS
Figure 1 Tumor volume changes at different time points before and after treatment.
Abbreviations: cr, complete response; d, days; m, months.
OncoTargets and Therapy downloaded from https://www.dovepress.com/ by 118.70.13.36 on 25-Aug-2020
Dovepress
Ju
rate at 6 months after CRT treatment (all P,0.05). The ADC
values at 6 months after CRT treatment were negatively
related to tumor volumes before CRT treatment (P,0.05).
The increased rate of ADC values at 6 months after CRT treatment were negatively associated with tumor volumes before and 6 months after CRT treatment, while positively correlated with tumor regression rate at 6 months after CRT
treatment (all P,0.05, Table 3).
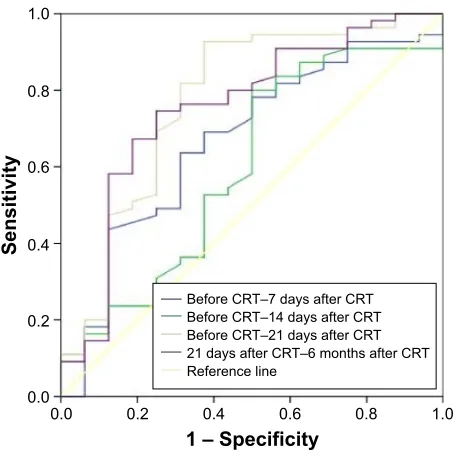
rOc curves of aDc values in predicting
the efficacy of CRT in cervical cancer
ROC curves showed that the areas under the curve (AUC) of the increased rate of ADC values at 7, 14, 21 days, and 6 months after CRT were 0.666, 0.598, 0.775, and 0.754, respectively; the sensitivity were 63.6%, 80%, 92.7%, and 74.5%, respectively; and the specificity were 68.7%, 50%, 62.5%, and 75%, respectively. The AUC of the increased rate of ADC values at 21 days after CRT treatment was the largest, which displayed the highest sensitivity of 92.7% (Figure 3; Table 4). Thus, 21 days after CRT presented the best predictive power for the prediction of CRT efficacy in cervical cancer.Discussion
As DWI can provide relatively secure information at a molecular level, it has been gradually used for early efficacy
evaluation and prognosis of malignant hepatic tumors.7 As
the roles of DWI with ADC values in predicting the efficacy of CRT in cervical cancer has not been reported, this study aims to further investigate the predictive values of DWI with ADC values by performing a study of 71 cervical cancer patients. Our study provides evidence that the increased rate of ADC values could be a promising tool for evaluating the efficacy of CRT in the treatment of cervical cancer. In this study, it was found that tumor volumes were decreased and ADC values were elevated in the CR and non-CR groups after CRT treatment compared with those before CRT treatment. The correlations between tumor volumes and ADC values indicated that ADC values were negatively associated with tumor volumes before CRT treatment, and also negatively associated with tumor regression rate at 6 months after CRT treatment. Furthermore, ADC values at 6 months after CRT treatment were negatively associated with tumor volumes before CRT treatment. The increased rate of ADC values at 6 months after CRT treatment was negatively correlated with tumor volumes before and 6 months after CRT treatment, while positively correlated with tumor regression rate at 6 months after CRT treatment. It is well known that CRT is
commonly applied to treat human cancers, 12–14 which leads
to tumor cell death and apoptosis, and is correlated with
ADC value increase.15 The increases of ADC values were
observed in non-small-cell lung cancer during CRT.16 Yan
et al have demonstrated that tumor volume is significantly smaller in cervical cancer patients after concurrent CRT
treatment.17 DWI is based on the diffusion motion of water
molecules and can provide quantitative measurement of ADC, which is thought to be influenced by cellular density
%HIRUH G G
7LPHSRLQW
$'&YDOXHî
±PP V
G P
&5JURXS 1RQ&5JURXS
Figure 2 aDc changes at different time points before and after treatment.
Abbreviations: ADC, apparent diffusion coefficient; CR, complete response; d, days; m, months.
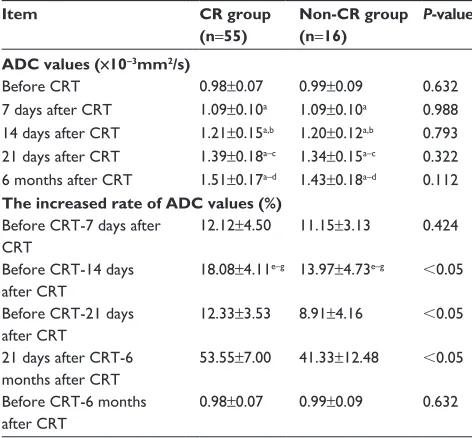
Table 2 changes in aDc values at different time points before and after crT treatment in the cr and non-cr groups
Item CR group
(n=55)
Non-CR group (n=16)
P-value
ADC values (×10−3mm2/s)
Before crT 0.98±0.07 0.99±0.09 0.632
7 days after crT 1.09±0.10a 1.09±0.10a 0.988
14 days after crT 1.21±0.15a,b 1.20±0.12a,b 0.793 21 days after crT 1.39±0.18a–c 1.34±0.15a–c 0.322 6 months after crT 1.51±0.17a–d 1.43±0.18a–d 0.112
The increased rate of ADC values (%)
Before crT-7 days after crT
12.12±4.50 11.15±3.13 0.424
Before crT-14 days after crT
18.08±4.11e–g 13.97±4.73e–g ,0.05
Before crT-21 days after crT
12.33±3.53 8.91±4.16 ,0.05
21 days after crT-6 months after crT
53.55±7.00 41.33±12.48 ,0.05
Before crT-6 months after crT
0.98±0.07 0.99±0.09 0.632
Notes:aP,0.05 when compared with that before crT treatment; bP,0.05 when
compared with 7 days after crT treatment; cP,0.05 when compared with 14 days
after crT treatment; dP,0.05 when compared with 21 days after crT treatment; eP,0.05 when compared with before crT-7 days after crT treatment; fP,0.05
when compared with before crT-14 days after crT treatment; gP,0.05 when
compared with 21 days after crT-6 months after crT.
Abbreviations: ADC, apparent diffusion coefficient; CR, complete response; CRT, chemoradiotherapy.
OncoTargets and Therapy downloaded from https://www.dovepress.com/ by 118.70.13.36 on 25-Aug-2020
Dovepress ADC predicting CRT efficacy in cervical cancer
in solid tissues. The diffusion movement is restricted by the cell membrane and macromolecular substance and its restriction extent was determined by cell density, membrane
integrity, viability, and structure and matrix composition.18
The possible mechanism is that as Vpretreatment grows, cervical cancer cells show high growth and metabolism, intracellular protein increases, the nucleus grows, extracellular space decreases, and water molecule diffusion in the tumor tissues
decreases, which thus leads to relatively low ADCpretreatment
value.19 Relatively higher ADC
pretreatment value indicates for
the presence of necrotic tissues or damaged cell membrane tissues, which lead to poor blood flow perfusion. In this case, the tissues are not sensitive to radiotherapy and less chemotherapy drugs reach the target. Meanwhile, necrotic tissues force tumor cells to be exposed to low oxygen content and acidic environment, which weakens the efficacy of CRT drugs and enables the tumor volume not to decrease, thus leading to relatively low ΔV(pretreatment−1 month after treatment) value.20
In breast cancer, a lower ADCpretreatment value can be used as
a predictor for smaller tumor size,6 which is consistent with
the result of this study.
In this study, ADC values at different time points before and after CRT treatment were different. The increased rate of ADC values at 21 days after CRT displayed the optimal effects in predicting CRT efficacy in cervical cancer. At 21 days after CRT treatment, tumor regression rate and the increasese rate of ADC values in the CR and non-CR groups were higher than those at 7, 14 days, and 6 months after CRT treatment. Tumor volumes in the CR group were reduced at 21 days after CRT treatment in comparison to the non-CR group. Thus, our data determined that the increased rate of ADC values was closely correlated with CRT response, and significant changes in ADC values at 21 days after CRT treatment might indicate a more satisfactory response to the therapy. However, a slight change in ADC values indicates
a less satisfactory result or even a unresponsive tumor.21,22
A previous study has reported that ADC values gradually increase after CRT treatment in cervical cancer and the increased rate of ADC values was positively related with the reduction rate of maximum tumor diameter, which means within the first month after CRT treatment, the higher the change rate is, the higher the reduction rate is, suggesting for good efficacy.23 Comparable results reported for
che-motherapy where ADC increase was associated with longer survival time and larger tumor regression in comparison with
patients with stable and decreased ADC values.24 Also,
fol-lowing radiofrequency ablation, a smaller ADC increase is
correlated with disease progression.25 He and Wei suggested
that DWI appears to enhance diagnostic performance and can serve as a useful adjunct imaging for identifying lymph node metastasis in cervical cancer patients.26 Kuang et al also
indi-cated that ADC value of DWI is able to monitor and predict the therapy response for cervical cancer patients receiving concurrent CRT therapy and confirmed ADC of 2 weeks fol-lowing CRT as the optimal time to indicate a better response with the time window set at the time before CRT, 2 and 4 weeks after CRT, and 2 weeks and 6 months after therapy
completion.27 Liu et al have further demonstrated that 14 days
Table 3 correlation between aDc values and tumor volumes
Item Tumor volumes
(before CRT)
Tumor volumes (6 months after CRT)
Tumor regression rate (6 months after CRT)
aDc values before crT r=−0.945, P,0.001 r=0.028, P=0.814 r=−0.244, P=0.040
aDc values at 6 months after crT r=−0.917, P,0.001 r=−0.213, P=0.075 r=0.005, P=0.986 The increased rate of aDc values
at 6 months after crT
r=−0.545, P,0.001 r=−0.550, P,0.001 r=0.408, P,0.001
Abbreviations: ADC, apparent diffusion coefficient; CRT, chemoradiotherapy.
±6SHFLILFLW\
6HQVLWLYLW\
GD\VDIWHU&57±PRQWKVDIWHU&57 5HIHUHQFHOLQH
%HIRUH&57±GD\VDIWHU&57 %HIRUH&57±GD\VDIWHU&57 %HIRUH&57±GD\VDIWHU&57
Figure 3 Receiver operator characteristic curve for apparent diffusion coefficient value to predict efficacy.
Abbreviation: crT, chemoradiotherapy.
OncoTargets and Therapy downloaded from https://www.dovepress.com/ by 118.70.13.36 on 25-Aug-2020
Dovepress
Ju
after CRT initiated can be regarded as the optimal time for monitoring early response of cervical cancer to concurrent
chemoradiation.28 However, no consensus has been reached
on the optimal time for the early detection of CRT for cervical cancer patients. Our study subdivide the time window to the time before CRT and at 7, 14, 21 days, and 6 months after CRT treatment. Our data revealed that ADC increased rate at 21 days after CRT treatment could provide a useful tool for assessing treatment response, which offers an opportunity to improve the clinical outcome and minimize the morbidity related with prolonged and ineffective treatment.
To sum up, our study provides evidence that the increased rate of ADC at 21 days after CRT might be a promising tool for predicting the efficacy of CRT in cervical cancer. However, this study only found that 21 days after CRT treatment could be used as the best time for early prediction of CRT efficacy in cervical cancer without exploring its possible mechanism. In addition, this study only followed the short-term efficacy of CRT on patients. Therefore, follow-up studies should be carried out to further verify the best time points and prognosis of CRT.
Acknowledgments
We would like to show our gratitude for helpful comments on this paper received from our reviewers.
Disclosure
The author reports no conflicts of interest in this work.
References
1. Jia Y, Li S, Yang R, et al. Knowledge about cervical cancer and barriers of screening program among women in Wufeng County, a high-incidence region of cervical cancer in China. PLoS One. 2013;8(7):e67005. 2. Tian Y, Ding W, Wang Y, et al. Ubiquitin B in cervical cancer:
criti-cal for the maintenance of cancer stem-like cell characters. PLoS One. 2013;8(12):e84457.
3. Mahata S, Bharti AC, Shukla S, Tyagi A, Husain SA, Das BC. Berberine modulates AP-1 activity to suppress HPV transcription and downstream signaling to induce growth arrest and apoptosis in cervical cancer cells.
Mol Cancer. 2011;10:39.
4. Maenpaa Sujana Movva MD, Lorna Rodriguez MD, Arias-Pulido H, et al. Novel chemotherapy approaches for cervical cancer. Cancer. 2009; 115(14):3166–3180.
5. Khoo MM, Tyler PA, Saifuddin A, Padhani AR. Diffusion-weighted imaging (DWI) in musculoskeletal MRI: a critical review. Skeletal
Radiol. 2011;40(6):665–681.
6. Park SH, Moon WK, Cho N, et al. Diffusion-weighted MR imaging: pretreatment prediction of response to neoadjuvant chemotherapy in patients with breast cancer. Radiology. 2010;257(1):56–63.
7. Kim SY, Lee SS, Byun JH, et al. Malignant hepatic tumors: short-term reproducibility of apparent diffusion coefficients with breath-hold and respiratory-triggered diffusion-weighted MR imaging. Radiology. 2010; 255(3):815–823.
8. Xu XQ, Hu H, Su GY, et al. Utility of histogram analysis of ADC maps for differentiating orbital tumors. Diagn Interv Radiol. 2016;22(2):161–167.
9. Zhang Y, Chen JY, Xie CM, et al. Diffusion-weighted magnetic reso-nance imaging for prediction of response of advanced cervical cancer to chemoradiation. J Comput Assist Tomogr. 2011;35(1):102–107. 10. Onal C, Erbay G, Guler OC. Treatment response evaluation using the
mean apparent diffusion coefficient in cervical cancer patients treated with definitive chemoradiotherapy. J Magn Reson Imaging. 2016; 44(4):1010–1019.
11. Yoshida S, Miyata Y, Ohtsu A, Boku N, Shirao K, Shimada Y. Signifi-cance of and problems in adopting response evaluation criteria in solid tumor RECIST for assessing anticancer effects of advanced gastric cancer. Gastric Cancer. 2000;3(3):128–133.
12. West MA, Loughney L, Ambler G, et al. The effect of neoadjuvant chemotherapy and chemoradiotherapy on exercise capacity and outcome following upper gastrointestinal cancer surgery: an observational cohort study. BMC Cancer. 2016;16(1):710.
13. Beschel LM, Leu M, Reichardt SD, et al. T cell abundance in blood predicts acute organ toxicity in chemoradiotherapy for head and neck cancer. Oncotarget. Epub 2016 Aug 29.
14. Zhou ML, Wang L, Wang JZ, et al. Validation of the memorial sloan kettering cancer center nomogram to predict disease-specific survival in a chinese gastric cancer population receiving postoperative chemo-radiotherapy after an r0 resection. Oncotarget. Epub 2016 Aug 29. 15. Galban S, Brisset JC, Rehemtulla A, Chenevert TL, Ross BD,
Galbán CJ. Diffusion-weighted MRI for assessment of early cancer treatment response. Curr Pharm Biotechnol. 2010;11(6):701–708. 16. Weiss E, Ford JC, Olsen KM, et al. Apparent diffusion coefficient (ADC)
change on repeated diffusion-weighted magnetic resonance imaging during radiochemotherapy for non-small cell lung cancer: a pilot study.
Lung Cancer. 2016;96:113–119.
17. Yan WM, Li XZ, Yu ZL, Zhang J, Sun XG. Clinical value of concurrent radiochemotherapy in cervical cancer and comparison of ultrasonography findings before and after radiochemotherapy. Genet Mol Res. 2015;14(2): 3633–3639.
18. Tasaki A, Asatani MO, Umezu H, et al. Differential diagnosis of uterine smooth muscle tumors using diffusion-weighted imaging: correlations with the apparent diffusion coefficient and cell density. Abdom Imaging. 2015;40(6):1742–1752.
19. Jung DC, Lee HJ, Seo JW, et al. Diffusion-weighted imaging of a prostate cancer xenograft model seen on a 7 Tesla animal MR scanner: comparison of ADC values and pathologic findings. Korean J Radiol. 2012;13(1):82–89.
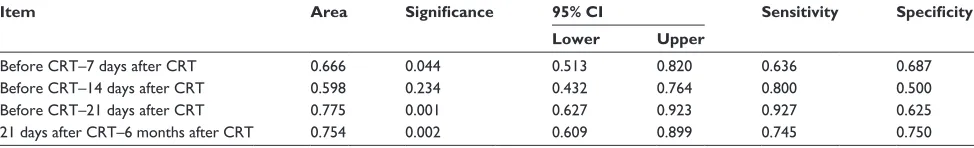
Table 4 Receiver operator characteristic curves of the increased rate of ADC values in predicting the efficacy of CRT in cervical cancer
Item Area Significance 95% CI Sensitivity Specificity
Lower Upper
Before crT–7 days after crT 0.666 0.044 0.513 0.820 0.636 0.687
Before crT–14 days after crT 0.598 0.234 0.432 0.764 0.800 0.500
Before crT–21 days after crT 0.775 0.001 0.627 0.923 0.927 0.625
21 days after crT–6 months after crT 0.754 0.002 0.609 0.899 0.745 0.750
Abbreviations: ADC, apparent diffusion coefficient; CI, confidence interval; CRT, chemoradiotherapy.
OncoTargets and Therapy downloaded from https://www.dovepress.com/ by 118.70.13.36 on 25-Aug-2020
OncoTargets and Therapy
Publish your work in this journal
Submit your manuscript here: http://www.dovepress.com/oncotargets-and-therapy-journal
OncoTargets and Therapy is an international, peer-reviewed, open access journal focusing on the pathological basis of all cancers, potential targets for therapy and treatment protocols employed to improve the management of cancer patients. The journal also focuses on the impact of management programs and new therapeutic agents and protocols on
patient perspectives such as quality of life, adherence and satisfaction. The manuscript management system is completely online and includes a very quick and fair peer-review system, which is all easy to use. Visit http://www.dovepress.com/testimonials.php to read real quotes from published authors.
Dovepress
Dove
press
ADC predicting CRT efficacy in cervical cancer
20. Wu B, Huang X, Peng W, et al. [Value of MR diffusion-weighted imaging in diagnosis and outcome prediction for uterine cervical cancer]. Zhonghua Zhong Liu Za Zhi. 2014;36(2):115–119. Chinese. 21. Zhang Y, Chen JY, Xie CM, et al. Diffusion-weighted magnetic
reso-nance imaging for prediction of response of advanced cervical cancer to chemoradiation. J Comput Assist Tomogr. 2011;35(1):102–107. 22. Somoye G, Harry V, Semple S, et al. Early diffusion weighted magnetic
resonance imaging can predict survival in women with locally advanced cancer of the cervix treated with combined chemo-radiation. Eur Radiol. 2012;22(11):2319–2327.
23. Rizzo S, Summers P, Raimondi S, et al. Diffusion-weighted MR imaging in assessing cervical tumour response to nonsurgical therapy. Radiol Med. 2011;116(5):766–780.
24. Yabuuchi H, Hatakenaka M, Takayama K, et al. Non-small cell lung cancer: detection of early response to chemotherapy by using contrast-enhanced dynamic and diffusion-weighted mr imaging. Radiology. 2011;261(2): 598–604.
25. Okuma T, Matsuoka T, Yamamoto A, Hamamoto S, Nakamura K, Inoue Y. Assessment of early treatment response after CT-guided radiofrequency ablation of unresectable lung tumours by diffusion-weighted MRI: a pilot study. Br J Radiol. 2009;82(984):989–994.
26. He XQ, Wei LN. Diagnostic value of lymph node metastasis by diffusion-weighted magnetic resonance imaging in cervical cancer.
J Cancer Res Ther. 2016;12(1):77–83.
27. Kuang F, Yan Z, Wang J, Rao Z. The value of diffusion-weighted MRI to evaluate the response to radiochemotherapy for cervical cancer.
Magn Reson Imaging. 2014;32(4):342–349.
28. Liu Y, Sun H, Bai R, Ye Z. Time-window of early detection of response to concurrent chemoradiation in cervical cancer by using diffusion-weighted MR imaging: a pilot study. Radiat Oncol. 2015;10:185.
OncoTargets and Therapy downloaded from https://www.dovepress.com/ by 118.70.13.36 on 25-Aug-2020
![3 {3,3 Dimethylspiro[2,3 dihydro 1H indole 2,3′ (3′H naphtho[2,1 b][1,4]oxazin)] 1 yl}propionic acid](data:image/gif;base64,R0lGODlhAQABAIAAAP///wAAACH5BAEAAAAALAAAAAABAAEAAAICRAEAOw==)