Original Article:
Demographic and Socio-economic Determinants of Birth Interval Dynamics in Manipur: A Survival
Analysis
Sanajaoba Singh N, Directorate of Census Operations, Porompat, Manipur, India, Sharat Singh N, Thoubal College, Thoubal, Manipur, India,
Narendra RK, Unit of Biostatistics, Regional Institute of Medical Sciences, Imphal, India.
Address For Correspondence: Dr. N. Sanajaoba Singh, Directorate of Census Operations, Porompat, Manipur,
India - 795005
E-mail: biostatsana@gmail.com
Citation: Singh SN, Singh N, Narendra RK. Demographic and Socio-economic Determinants of Birth Interval Dynamics in Manipur: A Survival Analysis. Online J Health Allied Scs. 2010;9(4):3
URL: http://www.ojhas.org/issue36/2010-4-3.htm
Open Access Archives: http://cogprints.org/view/subjects/OJHAS.html and http://openmed.nic.in/view/subjects/ojhas.html
Submitted: Oct 30, 2010; Accepted: Dec 28, 2010; Published: Jan 20, 2011
Abstract:
The birth interval is a major determinant of levels of fertility in high fertility populations. A house-to-house survey of 1225 wo-men in Manipur, a tiny state in North Eastern India was carried out to investigate birth interval patterns and its determinants. Using survival analysis, among the nine explanatory variables of interest, only three factors – infant mortality, Lactation and use of contraceptive devices have highly significant effect (P<0.01) on the duration of birth interval and only three factors – age at marriage of wife, parity and sex of child are found to be significant (P<0.05) on the duration variable.
Key Words: Censored observation; Relative risk; Infant mor-tality; Breastfeeding
Introduction:
Natural fertility depends on the duration of effective reproduct-ive span and length of birth interval.(1) Analysis of those factors influencing the span and those affecting the length of birth interval has proven useful, since in many cases they ap-pear to vary quite substantially across populations.(2) In recent years, policy makers and planners have focused a great deal of attention on the birth interval and its determinants. The reasons are that not only does the number of births women may have during her reproductive span depend on the spacing between the births but also there is a significant link between birth spa-cing and maternal and child health.(3) Thus, the spaspa-cing of births through a deliberately prolonged interval between births and a delay in child bearing following marriage could be logic-al logic-alternative strategies for fertility control.
Different studies have examined this issue and identified differ-ent risk factors contributing to the length of birth intervals. Age at marriage of mothers and parity are negatively associated with the length of birth interval.(4-7) The positive association between the duration of breast feeding and length of birth inter-val is well documented from the experience of many countries. (8-10) Sex of the index child can be regarded as a regarded as a determinant of birth interval.(9,11) They show that average birth interval is significantly shorter for women with a preced-ing birth of a female child. The death of previous child is asso-ciated with the short duration of birth interval.(12-14) The place of residence is also found to have an important impact on the length birth interval.(9) In terms of behaviours, empirical
evidence over many years and many settings indicates that lactational amenorrhea arising from breastfeeding lengthens birth interval.(13,15) Moreover, in many settings couples who practice postpartum abstinence have additional benefits if the duration of abstinence exceeds that of postpartum amenorrhea. The present study is initiated empirically to investigate the ef-fects of some demographic and socio-economic factors which are expected to cause variation in the length of birth interval by utilizing the survival model.
Materials and Methods:
A cross sectional study was conducted in four valley districts of Manipur namely Bishnupur, Thoubal, Imphal West and Imphal East during the period from 1 January 2009 to 30 June 2009. Manipur is a tiny state of North East India inhabited mainly by the Mongoloid race. A house-to-house survey was carried out on all households in the selected village and eligible women having at least one live birth were interviewed. The sample consists of 1225 eligible women. An eligible woman is hereby defined if both spouses are alive and normally living together during her child bearing period. The pre-tested and semi-struc-tural type of interview schedule is utilized as the tool for col-lecting the required information from the eligible women. Cluster sampling is adopted as sampling technique. The clusters of randomly selected villages in rural area and wards in urban area are completely enumerated. Altogether 45 villages in rural areas and 35 wards in urban areas are randomly selected. 5 vil-lages and 7 wards, 9 vilvil-lages and 10 wards, 11 vilvil-lages and 12 wards, and 20 villages and 6 wards are respectively selected from Bishnupur, Thoubal, Imphal West, Imphal East districts. Out of 1225 eligible women, 180, 316, 387 and 342 eligible women are picked up from Bishnupur, Thoubal, Imphal West, Imphal East districts respectively. A total of 1013 households are surveyed.
The response variable used for analysis is the birth interval. In the study, a birth interval is defined as the length of time (dura-tion) between two successive live births. While collecting the data, the following conditions are followed: (1) the survey data falls during postpartum amenorrhea (PPA) following the first birth, (2) the survey date falls after PPA of first birth but before conception, (3) the survey date falls after PPA of first birth but after conception (4) the survey date falls during the PPA of two
This work is licensed under a Creative Commons Attribution-No Derivative Works 2.5 India License
Online Journal of Health and Allied Sciences
Peer Reviewed, Open Access, Free Online Journal
or more birth, (5) the survey date falls after the PPA of two or more birth but before conception and (6) the survey date falls after the PPA of two or more birth but after conception. The first group of women is excluded from the present study. For the second and fifth groups of women, the duration variable is the time between the last birth and date of survey. Such event variables are considered as censored observation. For the four groups of women, the duration variable is time interval between the last two births and is considered as uncensored observation. For the third and sixth groups of women, the duration variable is time is estimated by adding the time interval between the date of birth of the lower birth order and the conception of the higher birth order to the gestation period of nine months. This variable is also uncensored observation. The duration variable is taken only for the last birth interval to control the data recall error. The explanatory variables or so termed as covariates are demographic and socio-economic variables. The socio-econom-ic variables include place of residence, educational level and family income. The demographic variables are age at marriage, sex of previous child, parity, lactation and use of contraceptive devices and living status of previous child.
As the study is confined in the censored data, the statistical ana-lysis is therefore carried out using survival anaana-lysis techniques. Life table analysis has been carried out to estimate the survival distribution (the proportion of women not having another birth before 12, 18, 24, 30, 36, 42 and 48 months subsequent to a live birth) with respect to socio-economic and demographic charac-teristics. Log rank test is employed to compare the survival ex-perience between different groups under study. Cox’s propor-tional hazard model (16) is used to determine the effects of various socio- economic and demographic factors on the length of birth interval.
Results:
Life table analysis
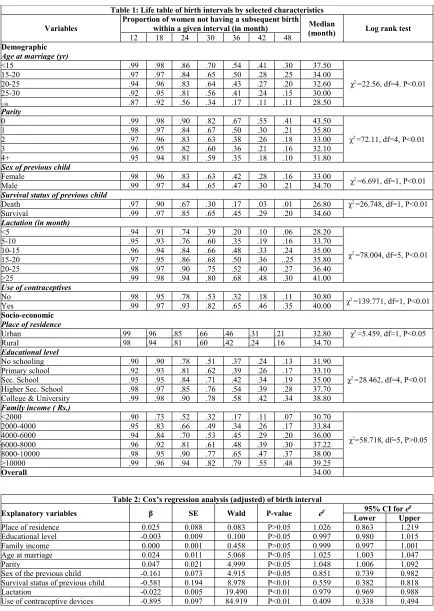
Table 1 provides information on life table estimates of median duration of birth interval and the proportion of women not hav-ing another birth before 12, 18, 24, 30, 36, 42 and 48 months subsequent to a live birth. The overall median duration of birth interval of the study population is 34 months. It also highlights that the proportion of not having a subsequent birth within 36 monthsis 54 percent for the women with age at marriage of be-low 15 years and the same is 50 percent, 43 percent, 41 percent and 17 percent for the women with age at marriage of 15-20 years, 20-25 years, 25-30 years, and 30 years and above re-spectively. The median birth interval decreases with the in-crease in the age at marriage of women. By the Log rank test, the association between age at marriage of women and birth in-terval is highly significant (χ2 =22.568, P < 0.01). About 67 per-cent of women having parity zero do not have subsequent birth within 36 months. On contrary, 50 percent of women having parity one, that of 38 percent of parity two, 36 percent of parity three and 35 percent of parity four and above do not have sub-sequent birth within 36 months. The median length of birth in-terval decreases with the increase in parity and this variation is highly significant irrespective of other covariates (P < 0.01). Sex of the previous child (P<0.01) and infant mortality (P<0.01) have a substantial influence on the birth interval. About 42 percent of women with a daughter do not have sub-sequent birth within 36 months while a slightly greater propor-tion (47 percent) of women with a son as the index child do not have their subsequent birth within 36 months. While only 17% of women who have experienced the death of previous child during infancy do not have subsequent birth within 36 months, a higher proportion of women (45%) with the survival of previ-ous child do not have subsequent birth during the same period
their subsequent birth within 36 months, compared to 35 per-cent of women who practice breastfeeding for 5-10 months, 48 percent of women who practice breast feeding for 10-15 months, 50 percent of women who practice breast feeding for 15-20 months, 52 percent of women who practice breast feed-ing for about 20-25 months, and 68 percent of women who practice breastfeeding for 25 months and above. While 32 per-cent of women who do not use any forms of contraceptive devices do not have subsequent birth within 36 months, only 65 percent of women who use contraceptives of any forms do not have subsequent birth during that interval.
Place of residence also found to an important impact on the birth interval (P<0.05). About 46 percent of urban women do not have their subsequent birth within 36 months as compared to 42 percent of rural women. About 58 percent of college and university level women have not subsequent child within 36 months whereas 37percent of women with no schooling and 39 percent of women with primary school level, 42 percent of wo-men with secondary school level and 54 percent of wowo-men with higher secondary level have not subsequent birth within the 36 months. The variation in the median duration of birth interval according to educational level of couple is an upward linear trend which is again found to be highly significant (P<0.01). Family income is expected to have a positive impact on birth interval (P<0.01). Among the women who have the family in-come of below Rs. 2000, the proportion of not having the sub-sequent birth within 36 months is 17 percent as compared to 34 percent, 45 percent, 48 percent, 65 percent and 79 percent for the women who have the family income of Rs. 2000-4000, Rs. 4000-6000, Rs 6000-8000, Rs.8000-10000, and Rs, 10000 and above respectively.
Multivariate analysis
Table 1: Life table of birth intervals by selected characteristics
Variables Proportion of women not having a subsequent birth within a given interval (in month) (month)Median Log rank test
12 18 24 30 36 42 48
Demographic
Age at marriage (yr)
<15 .99 .98 .86 .70 .54 .41 .30 37.50
χ2 =22.56, df=4. P<0.01
15-20 .97 .97 .84 .65 .50 .28 .25 34.00
20-25 .94 .96 .83 .64 .43 .27 .20 32.60
25-30 .92 .95 .81 .56 .41 .24 .15 30.00
≥30 .87 .92 .56 .34 .17 .11 .11 28.50
Parity
0 .99 .98 .90 .82 .67 .55 .41 43.50
χ2 =72.11, df=4, P<0.01
1 .98 .97 .84 .67 .50 .30 .21 35.80
2 .97 .96 .83 .63 .38 .26 .18 33.00
3 .96 .95 .82 .60 .36 .21 .16 32.10
4+ .95 .94 .81 .59 .35 .18 .10 31.80
Sex of previous child
Female .98 .96 .83 .63 .42 .28 .16 33.00 χ2 =6.691, df=1, P<0.01
Male .99 .97 .84 .65 .47 .30 .21 34.70
Survival status of previouschild
Death .97 .90 .67 .30 .17 .03 .01 26.80 χ2 =26.748, df=1, P<0.01
Survival .99 .97 .85 .65 .45 .29 .20 34.60
Lactation (in month)
<5 .94 .91 .74 .39 .20 .10 .06 28.20
χ2 =78.004, df=5, P<0.01
5-10 .95 .93 .76 .60 .35 .19 .16 33.70
10-15 .96 .94 .84 .66 .48 .33 .24 35.00
15-20 .97 .95 .86 .68 .50 .36 ..25 35.80
20-25 .98 .97 .90 .75 .52 .40 .27 36.40
≥25 .99 .98 .94 .80 .68 .48 .30 41.00
Use of contraceptives
No .98 .95 .78 .53 .32 .18 .11 30.80 χ2 =139.771, df=1, P<0.01
Yes .99 .97 .93 .82 .65 .46 .35 40.00
Socio-economic
Place of residence
Urban .99 .96 .85 .66 .46 .31 .21 32.80 χ2 =5.459, df=1, P<0.05
Rural .98 .94 .81 .60 .42 .24 .16 34.70
Educational level
No schooling .90 .90 .78 .51 .37 .24 .13 31.90
χ2 =28.462, df=4, P<0.01
Primary school .92 .93 .81 .62 .39 .26 .17 33.10
Sec. School .95 .95 .84 .71 .42 .34 .19 35.00
Higher Sec. School .98 .97 .85 .76 .54 .39 .28 37.70
College & University .99 .98 .90 .78 .58 .42 .34 38.80
Family income ( Rs.)
<2000 .90 .73 .52 .32 .17 .11 .07 30.70
χ2=58.718, df=5, P>0.05
2000-4000 .95 .83 .66 .49 .34 .26 .17 33.84
4000-6000 .94 .84 .70 .53 .45 .29 .20 36.00
6000-8000 .96 .92 .81 .61 .48 .39 .30 37.22
8000-10000 .98 .95 .90 .77 .65 .47 .37 38.00
≥10000 .99 .96 .94 .82 .79 .55 .48 39.25
Overall 34.00
Table 2: Cox’s regression analysis (adjusted) of birth interval
Explanatory variables β SE Wald P-value eβ 95% CI for eβ
Lower Upper
Place of residence 0.025 0.088 0.083 P>0.05 1.026 0.863 1.219
Educational level -0.003 0.009 0.100 P>0.05 0.997 0.980 1.015
Family income 0.000 0.001 0.458 P>0.05 0.999 0.997 1.001
Age at marriage 0.024 0.011 5.068 P<0.05 1.025 1.003 1.047
Parity 0.047 0.021 4.999 P<0.05 1.048 1.006 1.092
Sex of the previous child -0.161 0.073 4.915 P<0.05 0.851 0.739 0.982
Survival status of previous child -0.581 0.194 8.978 P<0.01 0.559 0.382 0.818
Lactation -0.022 0.005 19.490 P<0.01 0.979 0.969 0.988
To identify the best set of covariates which influence the dura-tion of birth interval, a stepwise method of Cox’s regression is again employed (Table 3). The four determinants – use of con-traceptive devices, survival status of previous child during in-fancy, duration of breast feeding, and parity have so far been identified to be the significantly influencing factors on the regu-lation of duration of birth interval. In the first step, the use of contraceptive devices is found to be significant as well as neg-atively associated with the risk of having subsequent birth (P<0.01) in such a way that the risk associated with women who use contraceptive devices is 45 percent lower than the risk associated with women who never use any devices (RR=0.454 with 95% CI: 0.397-0.520). In the second step, living status of previous becomes high risk factor for shortening birth interval.
The survival of previous child has 0.516 times lower hazard of having subsequent birth than the dead of previous child (RR=0.516). Proceeding in this way, duration of breastfeeding (P<0.01) and parity (P<0.01) are subsequently selected in the step 3 and step 4 respectively. The duration of breast feeding is negatively associated with the risk of having subsequent birth in such a way that a one - month increase in the duration of breast feeding leads to decrease in the risk of having sub-sequent birth by 2 percent (RR=0.982 with 95% CI: 0.974-0.991). Parity has again significant positive impact on the risk of having subsequent birth. Its value of RR=1.051 with 95% CI: 1.013-1.091 shows that when the parity is increased by one, the risk of having subsequent birth is increased by at least 5 per cent.
Table 3: Stepwise Cox’s Regression analysis of birth interval
Explanatory variables β SE Wald P-Value eβ 95% CI for eβ
Lower Upper
Step 1
Use of contraceptive devices -0.789 0.069 131.206 P<0.01 0.454 0.397 0.520
Step 2
Survival status of previous child -0.662 0.188 12.424 P<0.01 0.516 0.357 0.745
Use of contraceptive devices -0.850 0.070 147.078 P<0.01 0.427 0.372 0.490
Step 3
Survival status of previous child -0.705 0.188 14.012 P<0.01 0.494 0.342 0.715
Lactation -0.018 0.005 15.432 P<0.01 0.982 0.974 0.991
Use of contraceptive devices -0.952 0.082 134.933 P<0.01 0.386 0.329 0.453
Step 4
Parity 0.050 0.019 7.173 P<0.01 1.051 1.013 1.090
Survival status of previous child -0.693 0.188 13.546 P<0.01 0.500 0.346 0.723
Lactation -0.019 0.005 17.057 P<0.01 0.981 0.973 0.990
Use of contraceptive devices -0.903 0.084 114.386 P<0.01 0.405 0.343 0.478
Discussion:
From the above result, it is found that different factors have dif-ferent effects on the duration of birth interval. Couples who marry late have got short effective reproductive period. So they try to compensate their lost reproductive period by producing the desire number of children quickly. This leads to short birth interval among couples who marry late. The results of this study are consistent with those reported in the literature.(4-8) Increased parity also causes increase in risk of having sub-sequent birth that is to say that when the parity is increased, the length of birth interval decreases. This finding is consistent with the findings of Chakraborty et al.(9) The length of birth in-terval of the women whose previous child is male is signific-antly longer than that of those whose previous child is female. It may be due to the fact that in India, parents have put typically highly value on son since it is treated as an economic asset and old age assurance as well as the bearer of the family name, it is therefore less likely that they will accept contraception or other methods of fertility control until they have had the desire num-ber of son. This view is incorporated with the some previous findings.(9-11) The survival status of the previous child has been found to be important in determining child-spacing pat-terns for both social and biological reasons.(12-14) The social reason is that, couples who have experienced the loss of a child at infancy avoid contraception with the motivation to have an-other child as a replacement. Biologically, the death of an in-fant interrupts breastfeeding, leading to an early return of ovu-lation and, in the absence of contraception, increases likelihood of early subsequent conception. The present study also provides strong evidence of the negative impact of child lost on child
lengthens birth intervals. This finding is found to be in the same direction with the findings of different authors.(13-15) The finding of above study may be interesting and revealing to the health planner and executors to design proper future policies and plans for improving maternal and child health, and thereby for controlling the fertility through natural ways. It may also provide a baseline as well as scientific endeavour to the fu-ture researchers working on this crucial area of human research. References:
1. Bongaarts J, Potter RG. Fertility, biology and beha-viour. 1st ed. New York: Academic Press; 1983. 2. Rodriguez G, Hobcraft J, McDonald J et al. A
com-parative analysis of determinants of birth intervals. WFS Comparative Studies 30. 1984. ISI, Voorburg, Netherlands.
3. Miller JE, Trussell J, Pebley AR et al. Birth spacing and child mortality in Bangladesh and the Philip-pines. Demography 1992;29(2):305-318.
4. Al-Nehedh NNA. The effect of socio-demographic variables on child spacing in rural Saudi Arabia. Eastern Mediterranean Health Journal 1999;5(1):136-140.
5. Clegg EL. Starting, spacing and stopping in the re-productive histories of outer Hebridian families. Journal of Biosocial Sciences 2001;33:405-526. 6. Nahar L, Rahman M. Changes in socio-economic
cil.org/pdfs/frontiers/FR_FinalReports/Mozam_OB SI. Accessed Dec15th, 2009.
8. Narendra RK. A statistical study of components of birth interval in relation to Manipur women. Ph.D. thesis (unpublished): Patna University; 1984. 9. Chakraborty N, Sharmin S, Islam MA. Differential
pattern of birth interval in Bangladesh. Asia Pacific Population Journal 1996;11(4):73-86.
10. Awang H. Determinant of waiting time to third pregnancy using censored linear regression. Journal of Biosocial science 2003;35:59-70.
11. Gray E, Evans A. Parity progression in Australia: What role does sex of existing children play. Pro-ceeding of the 12th Biennial Conference of the Aus-tralian Population Association; Canberra; 2004.
12. Koenig MA, Phillips J, Champbell OM, et al. Birth intervals and childhood mortality in rural Bangladesh. Demography 1990;27(2):251-265. 13. Mturi, Akim J. The determinants of birth interval
among non-contracepting Tanzania women. African Population Studies 1997;12(2).
14. Dissanyake L. The influence of child mortality and breastfeeding on interlive birth interval in Sri Lankan. Journal of Family Welfare 2000;46(1):229-239.
15. Jain AK, Bongaarts J. Breastfeedng pattern, correl-ates and fertility effects. Studies in Family Planning 1981;12(3):79-99.