MASS SPECTROMETRIC STUDIES O F IONIZATION IN SHOCK HEATED GAS MIXTURES
T h e s i s by C h a r l e s C. P.. Wang
In
P a r t i a l Fulfillment of the Requirements FOP the D e g r e e ofDoctor of P h i l o ssphy
California Institute of Technology Pasadena, California
1967
ii
ACKNOWLEDGMENT
The author wishes to e x p r e s s h i s appreciation to P r o f e s s o r
B. Sturtevant, who introduced him to this field of study and under whose direction the r e s e a r c h was c a r r i e d out. Thanks a r e due also
to P r o f e s s o r H. W. Liepmann whose i n t e r e s t and encouragement helped to make t h i s t h e s i s possible. The generous help of
A. Hoffman, who painstakingly c o r r e c t e d the English, the other
m e m b e r s of the staff of the Graduate Aeronautical L a b o r a t o r i e s , who
helped with the experiment, and M i s s e s H. B u r r u s and M. F o s s u m , who typed the manuscript, i s also gratefully acknowledged.
The author i s indebted to the California Institute of Technology
for various f o r m s of financial assistance. The r e s e a r c h was
partially supported by the National Aeronautics and Space
Admini stration.
Finally, the deepest appreciation of a l l i s felt for h i s wife,
Lily, for h e r patience and encouragement during t h e s e y e a r s of
ABSTRACT
The initial stage of t h e r m a l ionization in gas m i x t u r e s behind strong n o r m a l shock waves h a s been studied using a m a s s spectro- m e t e r . The sampling p r o c e s s , the unique r o l e of m a s s spectrometric
analysis, t h e ionization mechanism and the effect of impurities on the ionization relaxation t i m e of the i n e r t gases a r e discussed. A detailed analysis of ion diffusion through the end wall t h e r m a l boundary layer to investigate the effect of the sampling p r o c e s s on the reaction and reaction produces a r e described. The experiments w e r e conducted in argon and xenon a t t e m p e r a t u r e s of f r o m 10,000 OK to 30,000 OK and p r e s s u r e s f r o m 1 5 mmHg to 80 mmHg. A l a r g e number of different ions w e r e detected i n stpure" (the estimated level of naturally occur-
+
*
ring i m p u r i t i e s was 50 ppm) argon. H and 0 w e r e found i n much g r e a t e r amounts than any of the other products. The r o l e s of H and
0 w e r e studied further by mixing a s m a l l amount of PI2 o r O2 i n argon. The activation energy and the effective c r o s s section for ionization w e r e obtained f r o m the m e a s u r e d ionization rate. F o r argon, the activation energy a g r e e s within experimental a c c u r a c y with the r e s u l t of Kelly (1 966). F o r hydrogen the activation energy i s about 10 ev, and this value coincides with i t s f i r s t excited state. The effective c r o s s section is a thousand t i m e s l a r g e r than the corresponding
iv
TABLEOFCONTENTS
PART TITLE
Acknowledgment Abstract
Table of Contents L i s t of Tables L i s t of F i g u r e s I. Introduction
PP.
Kinetics of the Initial Ionization P r o c e s s2.
B
Inelastic Collision P r o c e s s e s2. 2 Ionization R a t e s in P u r e G a s e s
2. 3 Ionization Rates in G a s Mixtures
W. Appavatus and P r o c e d u r e
3.
B
Mass Spectrometer 3. 2B
7-inch Shock Tube 3. 3 Heat Gauge3.4 Experimental P r o c e d u r e
IV.
Sampling P r o c e s s4.
P
Diffusion in the T h e r m a l Layer4.2 F r e e J e t Expansion
4. 3 Reactions in the T h e r m a l Layer
4.3.
P
Charge T r a n s f e r4.
3.2 Recombinationv
TABLE OF CONTENTS (Cont. )
PART
TITLEV. Results and Discussion
5.1 Calibration of Mass Spectrometer
5.2 Shock Heated Argon
#.
2.1 Ionic Products in "Pure" Argon5 . 2 . 2 Character of the Ion T r a c e s
5.2. 3 Rate Constants and Arrhenius Plots
5.2, 4 Effects of Addition of Hydrogen to "Fur e' AT gon
5,2. 5 Effects of Addition s f Oxygen to
"Pure" Argon
5.2.
6
Effects of Addition of Xenon to "Pureei Argon5. 3 Shock Heated Xenon
VI.
ConclusionAppendices
A. Calculation s f Frozen and Equilibrium Conditions Behind Reflected Shock Waves
B.
Lifetimes of Metastable StatesLIST O F TABLES
Page 1 . Test Conditions and Transport Parameters for Typical
6
8Experiments in Argon and Xenon
2. Partition Function Constants for A, K r , Xe, H , 0
and e -
vii
LIST O F FIGURES
P l o t of ion density against t i m e for one-step, two-step and multi
-
step reactions.P l o t of ion density against t i m e for a gas mixture M a s s spectrometer installation.
Arrangement of accelerating slits. Heat gauge circuit,
Heat gauge t r a c e s using non-shorting and ordinary circuit. ,
Ion density distribution in t h e r m a l layer for E e
=
0.25.Pon density distribution in t h e r m a l layer for L e
=
1. P l o t of ion flux through orifice against time.x-t diagram near end wall.
Collector c u r r e n t against t i m e for m a s s 1, 16, and
P a g e
72
12, Collector c u r r e n t against t i m e for m a s s i amu at four 8 3 different temperatures.
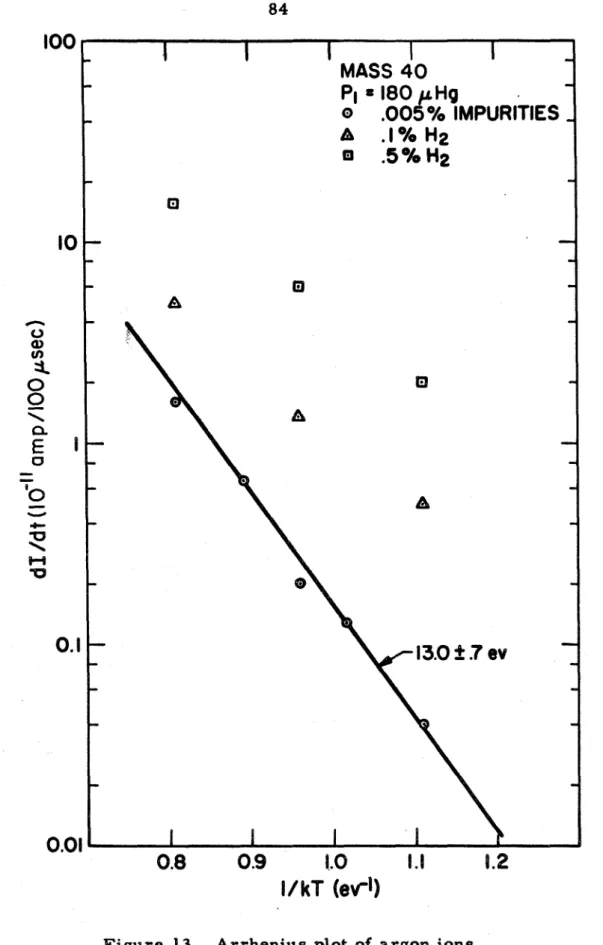
13. Arrhenius plot of argon ions. 84
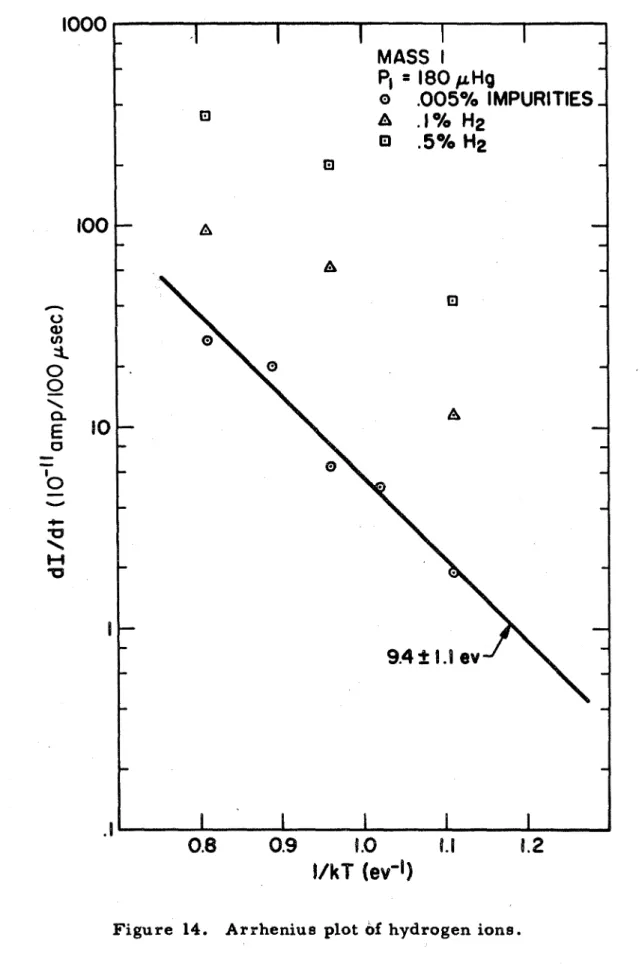
14. Arrhenius plot of hydrogen ions. 85
15. Argon ion t r a c e s ; 0. 1°/oEIZ and 0. ~ O / O H ~ added to argon. 86 16. Hydrogen ion t r a c e s ; 0. 1°/oE12 and 0. ~ O / O H added to
2 87
argon.
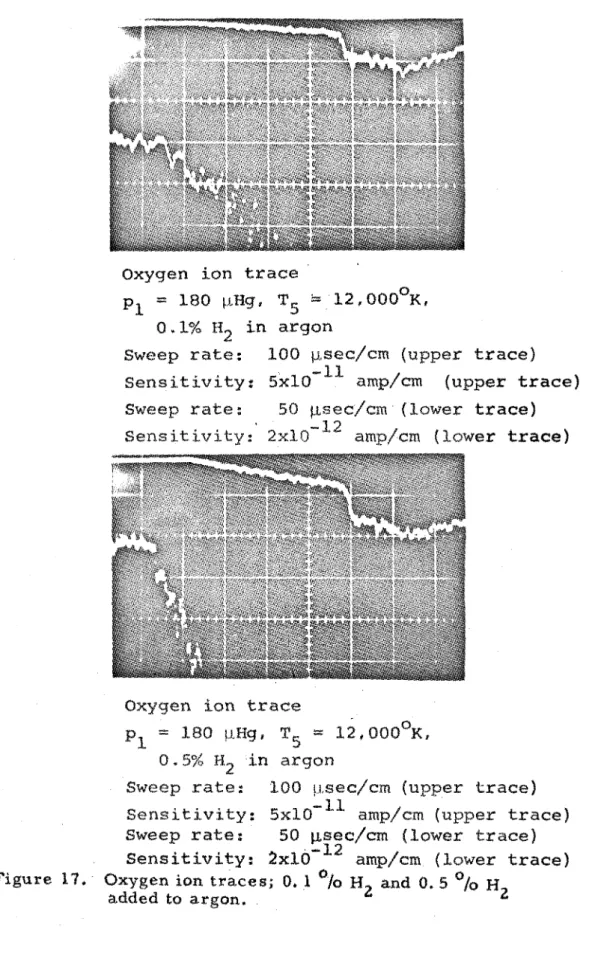
17. Oxygen ion t r a c e s ; 0 . ' l 0 / o ~ and 0. ~ O I O H ~ added to argon. 88
2
B
8. Xenon ion t r a c e s . 8 91
I. INTRODUCTION
In t h e study of gas dynamics, when a gas i s suddenly heated by a shock wave and begins to ionize, the ionization relaxation p r o c e s s becomes important i n determining the t h e r m a l and t r a n s p o r t p r o p e r - t i e s of the gas and the extent of the relaxation region behind the shock wave. During the p a s t t e n y e a r s , the ionization relaxation p r o c e s s i n a shock heated i n e r t gas h a s been studied i n detail by many investiga-
t o r s ( ~ e t s c h e k and Byron (1 957), Weymann (1 958), Sturtevant ( 1 961), Harwell and Jahp (1 964), Kelly ( 1 966) etc. ).
P e t s c h e k and Byron found that the ionization of argon can be approximately divided into two stages: the initial ionization by inher
-
ently slow inelastic atom-atom collisional p r o c e s s e s , and final rapid approach to equilibrium by r elatively efficeint electron-atom colli-sional p r o c e s s e s . Therefor e , the relaxation t i m e (or ionization time) is determined by the ionization kinetics of the initial stage of t h e
relaxation p r o c e s s . A r e m a r k a b l e r e s u l t was a l s o noted i n that the
*
relaxation t i m e depends strongly on the presence of impurities even after considerable c a r e i s taken to i n s u r e high purity (impurity level f r o m 7 ppm t o 80 ppm).
Weymann postulated a two-step p r o c e s s for the initial stage of ionization in i n e r t gases; the excitation of a n atom t o the resonance
state followed by ionization of the excited atom. He a l s o assumed ,that the collision c r o s s sections (defined i n section 2. 1) of excitation
*
The m a j o r s o u r c e of i m p u r i t i e s i n m o s t experiments is leakage and2
( f r o m ground state to a n excited electronic state) and ionization (from a n excited electronic state to ionization) a r e about the same. These lead to t h e results: a ) the activation energy (defined i n section 2. 1) for the ionization p r o c e s s i s the ionization energy, b) t h i s two- step p r o c e s s i s m o r e efficient than the one-step ionization p r o c e s s , and c ) influence of t h e i m p u r i t i e s on the argon ionization r a t e is negligible a s
3 long a s the impurity concentration i s below about 10 ppm.
Sturtevant h a s studied the ionization of argon by measuring the effusive e l e c t r i c a l c u r r e n t through a s m a l l orifice in the end wall of a shock tube. He h a s shown that the initial stage of ionization r e s u l t s f r o m a complicated s e r i e s of consecutive reactions.
Harwell and Sahn, and Kelly have studied the ionization of shock heated i n e r t gases by using a t r a n s v e r s e microwave probe. They found that the effective activation energy for ionizing argon coincides within experimental e r r o r with the excitation energy of the f i r s t electronic excited s t a t e r a t h e r than with the ionization energy, indicating that t h e initial stage of ionization does proceed via two-step p r o c e s s a s proposed by Weymann but that the excitation step is r a t e controlling. They a l s o found, as did P e t s c h e k and Byron, that unknown impurities i n t h e t e s t gases have profound effects on the ionization r a t e s a t concentrations a s low as a few p a r t s p e r million.
a t low energies, and the experimental data is s p a r s e and discrepant. The main i n t e r e s t of the p r e s e n t study i s a ) to study the initial atom-atom ionization p r o c e s s , b) to discover what i m p u r i t i e s , i n such
s m a l l concentrations, can have so important a n effect on the r a t e of ionization, and c ) to determine the m e a n s by which they e x e r t t h i s influence. The m a s s s p e c t r o m e t e r , with i t s unique ability to identify ions of different m a s s e s , seenis to be an ideal instrument for t h i s
study. The predominant impurity ions can be found and their behavior can be studied individually. One of the inherent problems encountered i n using a m a s s spectrometer i s the analysis of the sampling process. T h i s involves the extraction of a sample of ions f r o m t h e relaxation region behind the shock wave and the m e a s u r e m e n t of its composition and magnitude subsequent to i t s removal f r o m the shock tube. Because of the v a r i e t y and difficulty of the problems associated with the t h e r m a l l a y e r (section 4. 1) formed n e a r the sampling orifice, and reactions within it, i t is difficult t o make any general analysis about sampling. However, a simple analysis with a few basic assumptions i s made to
demonstrate the essential f e a t u r e s of the sampling p r o c e s s .
8
In t h i s study the GALCIT 17-inch shock tube is used to produce the shock wave and a modified Nier type magnetic m a s s spectrometer is used to study the ionization. A theoretical model of the initial ionization p r s c e s s i s a l s o proposed t o i n t e r p r e t t h e experimental r e s u l t s .
I
The initial stage of ionization in a shock heated inert gas i s
*
governed by atom-atom inelastic collisions. A description of the inelastic collision process, the r a t e equations, and various models of the ionization process a r e given in the following section.
2.1 Inelastic Collision P r o c e s s e s
An inelastic collision process i s an interaction between two atoms (or molecules) that involves the exchange of kinetic energy and internal energy. The internal energy includes rotational and vibra- tional energy, plus the energies of dissociation and ionization etc. F o r monatomic gases, the internal energies a r e only the energies of
electronic excitation and ionization.
F o r the temperatures and p r e s s u r e s of interest in these experiments, the atom can be considered a s a classical particle (the requirement i s that the average de Broglie wave length of an atom is much smaller than the average interparticle separation) and the collisions a r e binary collisions.
Considering the binary collision, let the velocities of the two incoming particles be
va,
E~~
their m a s e s be ml, m2 and theirI
velocity distribution functions be f
(x
t), and f2(x 2 , t ) (assuming homogeneity in space). Regard particles denoted by (l2
a s a beam with velocity incident on the particles of velocity v-
1' The flux of this incident beam i s*
Define the collision c r o s s section S of the reaction a s
N.umber of reactions per unit time /particle Incident flux
(2
1
The collision frequency o r the number of reactions per second is then
dn'
=/j
I S f l ( q , t ) d x 2 d x lai-
If i t i s assumed that the reaction r a t e i s slow enough that the distribu- tion function f i s not disturbed from Maxwellian during the reaction, i. e.
and that the temperatures of the two species a r e equal,
then
-v ) v -v d v d v
IS'
2 2 -1 (-2 -11 -2 -1These a r e well justified assumptions for atom-atom ~ o l l i s i o n a l processes.
To uncouple the above i n t e g r a l s a transformation is made f r o m laboratory coordinates to center of m a s s coordinates. Let t h e total m a s s M , the reduced m a s s
)I,
the m a s s center velocity V,-
and the relative velocityg
be, respectivelyThen the total energy E of the system i s equal to the center of m a s s energy Ec plus the relative energy
E
That i sr *
2
F u r t h e r m o r e , t h e Jacobian,
M V
andEr
=
~ p.
gwhere
Ec
=
z
that is, d v l
-
dx2=
dV-
dg.7
*
If the reaction r e q u i r e s a minimum energy t r a n s f e r E
,
then S(g)*
*
can be written a s S (g) H(E
-
E ), where H i s the Heaviside unit rfunction, and
112
where g o =
(y*)
.
Experimental o r theoretical data regarding the c r o s s section
*
S (g) for ionization o r excitation p r o c e s s e s a r e scarce. In the initial
*
ionization of argon, Weymann (1958) assumed that S (g) i s a constant to simplify the calculations. L a t e r Harwell and Jahn (1 964) assumed
*
*
that S (g) i n c r e a s e s linearly with the e x c e s s relative energy ( E - E r ). Fortunately, our main i n t e r e s t , the reaction r a t e , depends on the integral of the c r o s s section weighted by the Boltzman factor
(equation 1 O), and i s not strongly dependent on the functional f o r m of
*
S (g) a t t e m p e r a t u r e s of i n t e r e s t here. However, for generality, i t
*
i s assumed that S (g) i s proportional to the nth power of the e x c e s s relative energy, that i s ,
I
*
In this expression, there a r e three constant p a r a m e t e r s E
,
Sn and. I
dn n to be determined by experiment. F r o m the measured r a t e s ,
-
dt
'
a t different temperatures, these p a r a m e t e r s can be determined by anI
dn
Arrhenius plot of against 1 /kT.
Now, in chemical kinetics the bimolecular reaction of second order can be written a s (Benson, 1960)
*
The r a t e constant, k
,
i s most conveniently expressed empirically a s (Arrhenius form), where A i s called the pre-exponential*
factor and E i s called the activation energy. The validity and the physical meaning of this empirical form i s demonstrated by the above
consideration of binary inelastic collisions.
2. 2 Ionization Rates in P u r e Gases
Atom-atom ionization i s a very complicated process. It depends on the electpon energy states of each atom, the interaction potentials between atoms, the relative energy of the particles, the
collision parameters, etc. To demonstrate the essential features a few simple models a r e analyzed for the reaction.
a ) The simplest model for ionization i s the one-step process, which assumes that ionization may be achieved by one energetic
9
The rate equation can be written a s
t
where k (T) i s the ionization r a t e constant. In this case the activa-
9
tion energy,
E
,
i s just the ionization energyE*,
and the collision9
c r o s s section, Sn, i s just the ionization collision c r o s s section Sn. t F r o m equation ( 1 2 ) the r a t e constant can be written a s
The main feature of this reaction i s that nt increases linearly with A
time (figure 1) until electron-atom ionization becomes important. b) The two
-
step ionization assumed that ionizatian may be achieved by two successive collisions, involving a n inter-
9
mediate excited state A
.
That i s ,where k * ( ~ ) = excitation r a t e constant
E: = excitation energy
S* = excitation c r o s s section
kt = ionization r a t e constant
k g = de- excitation r a t e constant
kLJ = effective radiative decay r a t e ,
After integrating:
t s
where r = [(k + k ) n A t k v ] - I .
The efficiency of t h i s p r o c e s s , a s compared with a one-step p r o c e s s , depends on t h e relative r a t e s of collisional de -excitation ( k t )
t
and radiative decay (k ,) to the ionization step (k ). The natural life-
time of a normal excited state with r e s p e c t to radiative decay
(
-
s e c ) i s probably inadequate to support t h i s process. However,Harwell and Jahn (1964) have demonstrated that, due to either the
resonance trapping mechanism (Weymam 1958,PhePps 1958) o r the
*
11
(Appendix B), the effective lifetimes of the excited states with respect to radiative decay and collisional de-excitation a r e sufficiently long to
t
permit a second ionization collision. Thus, assuming k V < < (k t kl)nA,
where r
=
[(kt t kt)nA]-!
F o r small time, t
<<
T,
and for large time, t
>,
T,
Therefore, during the transients in which the population of the excited state increases to i t s v t steady- statet1 value, + increases with the
"A
square of the time, after which it increases linearly (figure 1). Hence, for large time, this two-step ionization process i s more efficient than the one-step ionization process. That i s , the two-step ionization process can be considered a s equivalent to a one-step ionization
* + +
process with an effective r a t e constant k k
/
(k 9 kt). Physically, this means that once the atom i s excited it will eventually become ionized.c) Extending the idea of a two-step process, the multi- step ionization process assumes that ionization may be achieved by one o r
m o r e successive collisions after the atom h a s been excited to the
f i r s t excited state. F o r m o s t i n e r t a t o m s , the energy difference
between the ground state and the f i r s t excited s t a t e (about t h r e e
q u a r t e r s of the ionization potential; s e e Table 2) i s much l a r g e r than
the energy difference between higher excited states. T h e r e f o r e , i t i s
a good approximation to a s s u m e that k l
,
the r a t e constant of atomsbeing excited f r o m the ground state to the f i r s t excited state, i s much
smaller than ki (i = 2, 3 , .
.
.
m ) , the r a t e constants for further excitation f r o m level i to level i t l . F u r t h e r m o r e , assuming theeffective lifetimes of the intermediate excited s t a t e s with r e s p e c t to radiative decay and collisional de
-
excitation a r e sufficiently long ( a swas assumed i n the two-step p r o c e s s ) , the rate equations a r e :
dn2
-
dt
=
k n n 2 0 1-
k n n 3 0 2...
e . . . .where no, n l , .
.
.
n a r e the number densities of a t o m s in the mground s t a t e , f i r s t excited state,
.
. .
.
.
,
and ionized s t a t e respectively. m-
4-Assuming n
,>
C
ni and initially n l = n2-
. .
. .
=
n=
0 ,0 rn
To see the general behavior for small time, consider t
<<
I /ki. Then,klkz*
-
* m - I m-1n (t)
=
n nm-
B
I s tt klk2. 0 . k
m m m
n (t)
=
n n trn nn! B 0
*
rni . e , n ( t ) - t
.
mA s t becomes larger than i l k i , the intermediate levels become saturated. Hence
-
klna
-
nSince we a r e not interested in the details of the reactions, i t i s easily seen that the general behavior of the process i s governed by two
t
c h a r a c t e r i s t i c time scales, rl
=
I l k l , andr
=
Max of i l k 2 ,*
*
m*
. . I
.
F o r t < < *,
n m - t.
F o r r l > > t > > r.
nt " t , i . e .m m
which for l a r g e time i s equivalent to a one-step ionization process with
t
an effective r a t e constant k and an effective "excitation time"
*
.
P
*
Physically, T i s the time required for the populations of a l l inter-
mediate excited states to become sa.turated. Ht w i l l be seen
(section 5. 2. 2) that the experimental results exhibit qualitatively both the excitation time" delay and subsequent linear increase with time that these considerations predict. A characteristic plot of n* versus
m time i s shown in figure 1, This simplified ionization model will be
*
used l a t e r in gas mixtures. and k l and r will be determined experimentally.
2 . 3 Ionization Rates
in
Gas Mixtures15
p r o c e s s , and the r a t e constant i s simply the r a t e constant of the r a t e determining step. Using this result, a simplified model f o r ionization i n gas mixtures i s studied in the following manner.
F o r a gas mixture of m components with number densities
n l ' n23
" " '
m the r a t e equations can be written a s+ m
dni
c
k.. n. nT
1~ 1 jThe k. a r e the effective r a t e constants, which can be e x p r e s s e d a s
1 j
where A
=
pre-exponential factor and E=
activation energy.i j i j
More specifically, consider a mixture of argon and s m a l l amounts of atomic hydrogen. FOP the initial stage of ionization, the electron density i s low enough so that both electron-atom ionization and electron-ion recombination a r e neglected f o r argon. However, the electron-ion recombination r a t e constant f o r the hydrogen ion
3
(Massey and Burhop 1952) i s ]LO t i m e s l a r g e r than that f o r the argon ion, and the recombination of hydrogen ions may not be negligible.
A t H k~~ A t + H + e
A
+
H+ k ~ + ~ A+ t+
H++
e kt x '
A + H A + + H
where A
=
kH(T)nAnHoB
=
kT(T)nA kH(T)nAc
-
kRH(T)and n n
=
initial number density of argon and hydrogen Ao' Hon ~ n~ 9
=
number density of argon and hydrogen'
'
=
ion number density of argon and hydrogen. n ~ ' n~9 4- t
Assuming n A % n (because n >7n ) andinitially n A = n H = O ,
A 0 Ao A then
e
9 n 00 t a n h -
n
=
T mMI
TOO
e
B
-
PS-
( 1-
tan h-)2 9 0 0
A characteristic plot of n' and n' versus time i s shown in figure 2.
H A
nt becomes saturated at r m and nt increases linearly either after
H
At
=
T o r e a r l i e r depending on whether the coupling parameter E i s00
t
l a r g e r o r smaller than D/nH.
19
111. APPARATUS AND PROCEDURE
In this experiment, ionizing gas in the 17-inch shock tube i s
the source of ions f o r the s p e c t r o m e t e r and an electron bea.m i s not
needed to ionize the sample. The s p e c t r o m e t e r i s mounted on the end
wall of the shock tube (figure 3 ) . Ions produced by t h e r m a l ionization behind a reflected shock wa.ve a r e sampled through s m a l l orifices i n
the end wa.11 after they have diffused through the dense t h e r m a l l a y e r
adjacent to the wall.
In this section a general description of the m a s s s p e c t r o m e t e r ,
the shock tube and the apparatus i s given. F u r t h e r m o r e , the ion
diffusion i s analyzed i n detail to a s s e s s the possibility that the Sam-
pling p r o c e s s a l t e r s the reaction products.
3 . 1 Ma.ss Spectrometer
The requirements f o r a m a s s s p e c t r o m e t e r to be u s e d in the
study of ionization in a shock tube a.re a ) f a s t time response,
b) high sensitivity, and c ) simplicity of s t r u c t u r e , r a t h e r than a high
resolving power. Modern m a s s s p e c t r o m e t r y makes u s e of a l t e r -
nating-gradient-focusing, double-focusing and cyclotron-resonance
etc. A resolving power of one p a r t i n 25, 000 can e a s i l y be achieved, but f o r our modest purpose, t h i s i s unnecessary. The simple Nier
type m a s s s p e c t r o m e t e r (Nier 1947) i s well suited to o u r purposes.
Recently, time -of -flight m a s s s p e c t r o m e t e r s have frequently
been used i n shock tube studies of chemical kinetics a t high temp-
e r a t u r e s (Bradley and Kistiakowsky 1961, Dove and Moulton 1965).
20
a t one o r m o r e different t i m e s during a run. In comparison, the
presently u s e d magnetic m a s s s p e c t r o m e t e r suffers f r o m the disad-
vantage of requiring s e v e r a l runs to obtain a complete spectrum but
h a s the advantage of measuring the continuous time history of a
definite m a s s . This can be important in understanding the sampling
p r o c e s s and the reactions taking place in the hot gas.
The m a s s s p e c t r o m e t e r we have built i s a modification of the
Nier (1947) type m a s s s p e c t r o m e t e r (Sturtevant 1966). The unique f e a t u r e of this m a s s s p e c t r o m e t e r i s i t s f a s t time response (one
microsecond r i s e time), which i s n e c e s s a r y f o r studies of shock-tube
flows. This i s achieved by using a ten-stage electron multiplier
(DuMont SPM 18- 01 -401) followed by an ope rational amplifier
(Philbrick Type P25AH) to amplify the ion c u r r e n t f r o m the collector.
Because of space requirements f o r the removable electron-
beam ion source, and to eliminate the t r a n s m i s s i o n of shock tube
vibration (due to diaphragm bursting) to the m a s s s p e c t r o m e t e r , a
bellows and a "cookie cutter" a r e used a s shown i n figure 3. The
cookie c u t t e r i s a 3-inch d i a m e t e r tube which extends u p s t r e a m into the shock tube and cuts a piece f r o m the c e n t e r of the shock wave. A
thin metal diaphragm containing the sampling orifices c l o s e s the other
end of the cookie cutter and f o r m s the r e d end wall (about 150 rnm
downstream of the 17-inch shock tube end wall) in these experiments.
A " s p e c t r o m e t e r valve1', a rectangular block which contains the electron-beam ion source a.nd the false end wall, slides between
two fixed plates and can e i t h e r a l i g n the m a s s spectrometer with the
2 1
s p e c t r o m e t e r valve i s pneumatically actuated. A few milliseconds a f t e r each run the gate signal f r o m an oscilloscope s t a r t s the valve closing and t u r n s off the high voltage.
The ion source, which i s used to s e t the m a s s peak, consists of a filament to emit electrons, an accelerating electrode, and a field magnet (about 150 gauss) to focus the electron beam. The filament i s a tungsten ribbon hairpin (0. 025 m m x 0. 75 m m x 10 m m ) mounted between two tungsten leads (0.75 m m diameter wire), which a r e mounted on glass. The filament c u r r e n t (0 to
4
a m p e r e s ) i s supplied by a 4-volt storage battery. The electrons, which a r e accelerated to a voltage of f r o m 0 to 90 volts by two 90 volt d r y batteries, ionize the neutral atoms in the ion source (figure 3 ) .Ions which a r e either prbduced in the ion source o r sampled Prom the shock tube through an orifice, a r e drawn out (figure 41,
collimated, accelerated to a potential of f r o m
-
1, 000 to-
2, 000 volts, analyzed and focused by a 6-inch-radius, 60° s e c t o r magnetic field (which can be varied f r o m 100 to 4, 000 gauss) and, finally, collected by the f i r s t dynode of the electron-multiplier. When the electron- multiplier output is coupled by an operational amplifier to a Tektronix type 555 oscilloscope with a type E plug in preamplifier, the time respdnse i s one microsecond and the total c u r r e n t gain i s 2,000, 000 (1, 000 due to the electron-multipliep, 2, 000 due to the operational amplifier).Hf
a sampling diaphragm containing s i x 8.B
5 mm diameter10 - 3
The envelope of the m a s s spectrometer i s constructed
entirely of metal (stainless s t e e l ) and the flanged joints a r e sealed by
-6
neoprene O-rings. The p r e s s u r e inside i s pumped to 10 mmHg and
- 5
i s maintained a t l e s s than 7 x 10 mmHg during each run by a 4-inch o i l diffusion pump ( C E C type MCF-300). This pump i s isolated f r o m the s p e c t r o m e t e r by a "straight-through" liquid nitrogen cold trap. The p r e s s u r e i s m e a s u r e d continuously by a cold cathode ionization vacuum gauge which i s calibrated against a McLeod gauge.
The m a s s r e solving power i s adjustable (by changing slit dimensions) f r o m 1 i n 10 to 1 in 200, so we can e i t k r m e a s u r e
s e v e r a l neighboring m a s s peaks a t a time o r m e a s u r e each m a s s peak individually. If a 0. 75 m m x 1 5 m m slit i s used on the collector, a
resolution of 1 in 200 i s obtained. The stability of the power supplies f o r the acceleration voltage and the magnetic coil c u r r e n t i s such that when the m a s s s p e c t r o m e t e r i s s e t on a c e r t a i n m a s s peak t h e r e is no perceptible drift for periods s f 'over half an hour.
3 . 2 17-inch Shock Tube
In this study the ions which enter the m a s s s p e c t r o m e t e r a r e produced by t h e r m a l ionization behind a reflected shock wave. The
shock tube used i s the GALCIT 17-inch d i a m e t e r shock tube
(Eiepmann, Roshko, Coles and Sturtevant, 1962) which was designed f o r basic experimental r e s e a r c h in gas dynamics. The advantages of this shock tube a r e i t s Pow leak rate which gives relatively high purity t e s t gases, i t s unique diaphragm-opening mechanism which can
23
times which a r e longer than those in s m a l l e r diameter tubes (Roshko 1960). These a r e the essential requirements for this experiment.
As a vacuum system, the 17-inch shock tube i s well designed and vacuum tight. There a r e two pumping systems, the p r i m a r y one and the high vacuum one. The p r i m a r y pumping system consists of two German Heraeus pumps in s e r i e s . The fore pump, a type E225 (pumping speed 1 32 cfm, ultimate p r e s s u r e 20 pHg) and the vacuum
pump, a Roots-type blower V P R - 1600 (pumping speed 400 l i t e r l s e c , ultimate p r e s s u r e 0 . 5 pHg) pump the whole driven section f r o m
atmospheric p r e s s u r e to about pHg in 10 minutes. To attain a
2-
highe r vacuum, the other independent high vacuum s y s tem, which consists of a Kinhey KC 46 in s e r i e s with a s m a l l e r but 2-stage Heraeus Roots blower, the VPR- 152A (pumping speed 40 l i t e r l s e c ,
-6
ultimate p r e s s u r e 2 x 10 mimHg) and a liquid nitrogen trap, pump
P
-6
P
the tube from rHg to 2 x 10 mmHg in hour. After three hours continuous pumping, the degassing rate i s about 0.
B
d h r ,3.3 Heat Gauge
non-shorting heat gauge c i r c u i t was built which m a k e s it possible to m e a s u r e shock speeds and a l s o to t r i g g e r the instruments for Mach numbers up to 12 in xenon. F u r t h e r m o r e , electronic noise due to ground loops i n the shock tube and c i r c u i t s , which h a s been trouble- some in the p a s t , i s reduced.
The gauge (Liepmann, Roshko, Coles and Sturtevant 1962) is made of platinum film plated on a 1 -inch diameter p y r e x plug, and mounted i n the instrumentation a c c e s s hole of the shock tube side wall o r end wall. The operation and the c i r c u i t of ordinary heat gauges a r e given elsewhere (Klein 1967).
Based on the observation that when the heat gauge i s biased at negative voltage it collects ions and vice v e r s a , the non-shorting c i r c u i t simply floats both t e r m i n a l s of the thin film and b i a s e s them to a c e r t a i n negative voltage. The electrons a r e then repelled by the negative potenti31 and the ions a r e collected. The voltage difference due to the ions collected by the thin f i l m i s approximately the s a m e at
*
both t e r m i n a l s
,
so that when the voltage difference (measured by a differential amplifier, figure 5) between these t e r m i n a l s i s m e a s u r e d , the ion c u r r e n t cancels out and only the t r u e heat t r a n s f e r signal is amplified.Using this non- shorting circuit, the heat t r a n s f e r signal i n a partially ionized gas i s distinguishable f r o m the electronic noise, and
shock a r r i v a l t i m e s and velocities a r e measured up to a shock Mach
8
number of 1 1 . 6 i n xenon (p
=
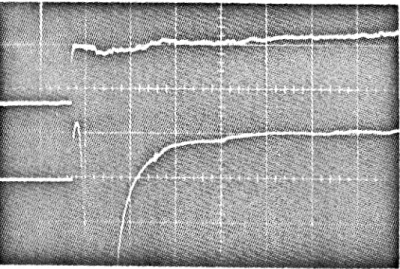
100 pHg). Typical non- shorting heat 1gauge t r a c e s and ordinary heat gauge t r a c e s under the same conditions a r e shown i n figure 6, where the bias voltage i s -9 v. The ordinary heat gauge signal i s shorted by electrons o r ions right after the
incident shock o r the reflected shock a r r i v e s , while the non- shorting heat gauge output still r e a d s c o r r e c t l y a s though t h e r e were no
electron o r ion influences. The range of validity of the heat gauge can thus be extended to e i t h e r higher Mach number o r lower p r e s s u r e
shock waves, It; i s hoped that this non-shorting heat gauge can be f u r t h e r developed to m e a s u r e heat t r a n s f e r on the end wall a t v e r y high shock Mach numbers without being disturbed by electrons o r ions.
3 . 4 Experimental P r o c e d u r e
To m e a s u r e the m a s s spectrum of the ionizing gas behind the reflected shock wave, only one m a s s peak i s observed during each run. This gives a continuous time h i s t o r y of the ionization p r o c e s s with m i c r o second r e solution, which i s unattainable when making a full
scan to all m a s s peaks. Of course, s e v e r a l runs a r e required to obtain a complete spectrum. This i s time consuming because a long pumping time i s required to reduce the degassing r a t e and to maintain a high degree of purity in the shock tube.
Pre-setting the m a s s peak
F o r each run, just before bursting the diaphragm, the d e s i r e d m a s s peak i s s e t by using the removable electron-beam ion source. Then the source i s moved aside, a m e t a l diaphragm end w a l l
Impurity level
To minimize the impurity level, the time elapsed between
closing the vacuum pump valves and bursting the shock tube diaphragm i s kept a s short a s possible, usually about one minute. Before each
-
6run the degassing rate (at 4 x 10 rnmHg, the p r e s s u r e i s doubled after one minute) in the tube i s measured. Also, the tube p r e s s u r e
-6
(about 4 x 10 mmHg) i s measured just before introducing the t e s t gas, with the spectrometer valve opened. This is done to ensure that no foreign gas i s dumped into the tube by closing of the valves. F o r a typical run, say pl
=
180 pHg, the impurity level i s about 50 ppm (calculated f r o m tube pre s s u r e and degas sing rate).Ins trumentation
The shock velocity i s measured n e a r the end of the driven section by two thin film heat t r a n s f e r gauges (section 3. 3 ) . Another thin film heat gauge i s mounted on the shock tube end wall (figure 3) to trigger the instruments and to determine the shock a r r i v a l time a t the end wall. Two tektronix type 555 dual-beam oscilloscopes were used, with one beam recording the end wall t r a c e to give the shock
Ope rating sequence
The operating sequence was a s follows: install the suitable
- 6
diaphragm and knife edges; pump the driven section to 10 mmHg and the d r i v e r section to about 1 pHg; m e a s u r e the leak r a t e and determine the impurity level; use the electron-beam ion source and the electron- multiplier output to set the appropriate m a s s peak; remove the ion
source; connect the electron-multiplie r output to the operational amplifier (output of this amplifier i s connected to oscilloscopes); m e a s u r e the tube p r e s s u r e again; close the pump valve; introduce the t e s t gas; introduce the d r i v e r gas; r e s e t the counter and oscilloscopes; open the c a m e r a shutter; f i r e .
Data reduction
Since a l l t r a c e s were recorded on polaroid film, the data reduction was relatively easy and direct. The Mach number was m e a s u r e d for each run, and was found to be reproducible to within
i- 0 . 6 p e r cent which corresponded to a temperature variation of
-
4- 7 p e r cent. The impurity level i n the shock tube was controlled by
-
28
IV. SAMPLING PROCESS
As i n all sampling experiments, the question of whether the reaction products a r e a l t e r e d during the sampling operation i s of p r i m a r y importance. Consequently, the sampling p r o c e s s i s studied in some detail.
Ideal sampling o c c u r s when all the reactions in the sampled gas a r e frozen f r o m the time i t leaves the active region (between the reflected shock wave and the end-wall t h e r m a l l a y e r ) until i t e n t e r s the m a s s spectrometer and i s finally collected by the electron-
multiplier collector. This can only be achieved by rapidly expanding the sampled gas to a low temperature and density without any e n e r - getic co8lisions taking place, e. g. by free-molecular effusion f r o m an orifice.
In the actual c a s e there i s always a layer of cool and dense gas (thermal l a y e r ) adjacent to the end wall. As was discussed by
Sturtevant (l966), two somewhat different c a s e s a r i s e depending on whether the orifice diameter d i s g r e a t e r o r l e s s than the t h e r m a l l a y e r thickness 6 . In experiments a t relatively high p r e s s u r e
d
>>
6 , and the flow into the orifice i s inviscid, while a t lower p r e s - s u r e s 6, the sampled gas f i r s t diffuses through the thermal layer before entering the field of influence of the orifice (section 4. 2). In either case, t h e r e are c e r t a i n difficulties i n generating a f r e e -29
ae
the free-molecular limit
Kn
>
1,
can probably never be realized in shock-tube sampling experiments. A typical t e s t condition (Table 1) shows that the mean f r e e path Xwall=
8 x 10 cm and the orifice -5 diameter d=
0. 015 cm. This gives that Kn=
0 ( 1 0 - ~ ) . In thisexperiment, before the sampled gas can reach the sampling orifice i t has to diffuse through the dense thermal layer. A simplified analysis of this process i s given in the following sections.
4. 1 Diffusion in the Thermal Layer
As a strong normal shock wave reflects and propagates away f r o m the shock tube end wall, i t leaves behind a hot, stagnant body of
gas. The gas adjacent to the heat-conducting end wall i s cooled by heat t r a n s f e r and f o r m s an e n d w a l l thermal layer. The gas density and temperature in this growing thermal l a y e r a r e given by the well- known results of Goldsworthy (1958) f o r a perfect gas with thermal
conductivity -proportional to temperature
where T1 i s the wall and initial gas temperature,
T
is the frozen5
gas temperature behind the reflected shock wave and rp i s a boundary layer coordinate, defined by
30
K
i s the thermal diffusivity, t i s the time after the shock wave has5
reached the wall, and x i s the distance from the end wall. The induced velocity (velocity induced by accumulation of m a s s in the end wall thermal l a y e r ) i s then
The problem encountered h e r e i s to find the charged particle density distribution in the thermal layer, where the gas density i s so high that the local mean f r e e path i s much s m a l l e r than the orifice diameter. A continuum description including the effects of viscosity, heat conductivity, diffusion of the many specie s, and electrical
conduction i s necessary. Clearly, a general analytic solution to such a complex problem i s not obtainable. Fortunately, under the a s sump- tion of quasi-neutrality, and a transformation of both dependent
variables and independent variables, i t i s pos sible to decouple the diffusion of the charged particles from the m a s s motion of the neutral gas. Then the problem i s reduced to a simple diffusion problem.
t t t n + t
r t
= n u I - pD grad-
+ p ~nt
-
-
P-
-
-
- -
n-
-
= n u
= -
grad- -
p ~n-
-
P-
t
where n- a r e ion and electron densities t
u- a r e ion and electron diffusion velocities
t
D- a r e ion and electron diffusion coefficients
4-
p - a r e ion and electron mobilities
E i s the electric field induced by the charged particles.
-
As pointed out by Su
(11965),
quasi-neutrality i s a good approx- imation for ion and electron diffusion in the thermal layer down to the edge of the sheath layer, which i s about a few Debye lengths from the end wall. This ambipolar diffusion assumption greatly simplifies the problem. The ion flux then becomes:where n i s the ion density
u i s the ion diffusion velocity
-
32
Assuming the diffusion coefficient to be proportional to
,
thenwhere the Lewis number Le i s taken to be constant. F o r slightly ionized gas a t a constant p r e s s u r e , the charged-particle continuity equation i s (Hirschfelder, C u r t i s s and Bird 1954) .
where v and u a r e defined i n equations (3) and (5) respectively. The continuity equation for a neutral gas i s
Introducing a new dependent variable, the m a s s fraction,
and a transformation of the independent variables, the Stewartson Transformation,
' k = t
one a r r i v e s a t the simple equation
3 3 a ) Condition at infinity
As shown in section 2 . 2 the rate of ion production i s a strong function of temperature, i . e. it i s proportiona.1 to exp(-E / k ~ ) . In
a
the present case, a 5 p e r cent decrease in temperature cuts the ion production rate i n half. Hence i t i s a good approximation to assume a certain c r i t i c a l temperature, below which the ion production i s cut off and above which the reaction remains the same.
The isothermal line X
=
X(t;T) i n the thermal layer i s easily found to beAssuming that the reaction i s cut off at T
=
= ~ p the cut-off line is
1
/
2 2(K5t) 'I*-
1 T c / T 1-
1 where .q=
erf6 T 5 / T 1
-
1Outside the cut-off line the ion production i s assumed to s t a r t after a
*
certain excitation time T and increase linearly with time.
b) Initial condition
+
-
Initially n
=
n=
8 over all space.c ) Condition a t wall
34
.
The diffusion equation can then be written a st t
with
a) C(X2
2(K57
) 1 1 2 ~,
7) = C
( 7-
7 )6 5
9
, 7
=
r ) = O
b)
C(X
2(Kg
7 )The solution i s :
Then,
-
erf( L e t / ? \ ' I L
Numerical r e s u l t s were obtained on the IBM 7094 Computer a t the
9
*
Caltech Computing Center. A typical plot of n(q
,
T-
f ) v e r s u s*
q with q
=
1 and f o r different t i m e s and L e i s shown i n6
figures 7 and 8.
Two important p a r a m e t e r s , Le and q
a
,
a r e involved inthe solution, the f o r m e r associated with the time scale and the l a t t e r with the length scale. The qualitative behavior of the ion density for
*
*
*
i s that
"1(g5(
r-
r )) s t a r t s out l i n e a r l y with q.
As q i n c r e a s e s*
*
and r e a c h e s ( ( T T * / T n/(B5(' ~ ~
-
I )) flattens out,
*
seemingly reaching a plateau. As q further i n c r e a s e s ,
*
*
n/(E5( T
-
) ) i n c r e a s e s exponentially with 1 a s the edge of thet h e r m a l boundary i s approached and i t reaches a peak just outside the t h e r m a l l a y e r .
*
This boundary-layer- within-a-boundary-layer-behavior i s due to4 . 2 F r e e J e t Expansion
The ions, a f t e r diffusing through the t h e r m a l l a y e r , a r e
sampled through s m a l l orifices connecting the shock tube to the m a s s s p e c t r o m e t e r . As mentioned before, due to the end wall thermal l a y e r i t i s impossible for the f r e e molecular flow requirement, K n > 1, to be satisfied. Therefore, a supersonic f r e e jet i s formed. The u p s t r e a m influences of the jet on ion diffusion i n the t h e r m a l layer and the down s t r e a m interaction of the jet with the accelerating
s l i t s (figure 4 ) w i l l be discussed.
Upstream
By continuity, the u p s t r e a m velocity induced by the jet i s proportional to the i n v e r s e s f the number density and the i n v e r s e of the distance squared. Hence, f a r f r o m the orifice, the flow field and the ion density a r e not disturbed. At a distance of s e v e r a l d i a m e t e r s f r o m the orifice, however, the jet induced velocity v becomes
J
l a r g e r than the ion flux velocity u. In the charged particle continuity equation, u and v a r e then negligible compared to v Thus, f o r
J'
this c a s e equation (7) becomes2
Along the center line of the orifice v i s approximately c / x where
J
37
Solving this pa.rtia1 differential equation:
where f i s an a r b i t r a r y function to be determined by the boundary condition. Matching this solution to the solution of ion density far f r o m the orifice a t the position where u / v
=
P I
the function f canJ
be uniquely determined.Downstream
The down s t r e a m interaction of the jet with the electrodes i s extremely complicated and almost impos sible to analyze. Fortunately, in a strong e l e c t r i c field (about 1000 v / c m ) the ion velocity i s much l a r g e r than the jet velocity. Hence, the motion of the ions i s approxi-
*
mately decoupled f r o m the jet. Due to the strong attractive field and the geometry, most of the ions a r e collected by the drawout-electrode (figure 4); only 0. 01 p e r cent (section 5. 1) of the ions p a s s through the s l i t s and a r e collected by the electron-multiplier. The present
9 3
arrangement i s good f o r ion densities of f r o m 10 i ~ n s / ~ n n to
l 2 3 9 3
10 i o n s / c m
.
Below 10 i o n s / c m,
the signal to noise ratio of the electron-multiplier output will be l e s s than one. This can be improved by rearranging the accelerating s l i t s o r by using a higher gain electron- multiplier. The upper l i m i t i s due to the f a c t that both the effect of the electrostatic sheath in f r o n t of the drawout-electrode and the effect of the mutual repulsion of the ions inn the jet become important. A11these change the efficiency of the electrodes, with the result that makes the sa.mpling a non-linear function of ion density.
Re sult
In summary, the above results demonstrate that for moderate ion densities, the m a s s spectrometer output i s approximately propor- tional to n which i s computed numerically and plotted against time,
J'
together with a measured argon ion t r a c e superimposed for comparison in figure 9. The agreement with the actual m a s s spectrometer output of argon ions f u r t h e r demonstrates that the sampling technique can be used for accurate measurements of the ionization processes.
4 . 3 Reactions in the Thermal Layer
It was assumed in the previous section that reactions in the thermal layer a r e frozen o r a r e negligibly small. To justify this a s sumption, charge transfer and recombination p r o s e s s e s in the thermal layer a r e studied below.
4 . 3 .
B
Charge transferIn general, the charge t r a n s f e r process can be written a s
9
where k i s t h e r a t e c o n s t a n t f o r t h e c h a r g e t r a n s f e r r e a c t i o n , n t
CT A
i s the number density of the "A" ions, and n i s the number density
B
of the t t B t t a t o m s . Because the t h e r m a l l a y e r i s non-steady and non- uniform, the r a t e constant and the atom number density a r e functions
of time and position. As before if i t i s assumed that the reaction r a t e i s s m a l l compared to the diffusion rate, the reaction can be decoupled f r o m the charge diffusion. Then the r a t i o of n,: the number of ions left after undergoing charge t r a n s f e r during the passage and through
the t h e r m a l l a y e r , and n9 the number of ions entering the t h e r m a l A'
l a y e r , i s
I
T n
=
exp(-
J
kCT ng c iAm path
where the integration i s performed along the average particle path
u and v a r e defined i n equa.tions 8 and 3. The averaged charge t r a n s f e r r a t e constant,
k~~ i s defined by
G =
path n Boowhere n i s the number density of "B" atoms outside the thermal
B w
wall. Using n and the average particle path calculated f r o m the B
previous section, i, e.
n~
=
Boo1
+
(T51-
1) e r f(
7 1
r * ) l I 2*
*
where C q and t
/
r a r e the m a s s fraction, dimensionless length variable, and dimensionless time variable a s were defined inequations 10 and 18, then k
CT
can be obtained f r o m a numerical integration along the average particle path. The result, a s might have been expected, shows thatF
i s of the o r d e r of kCT (outsideCT
the t h e r m a l l a y e r ) . A typical value f o r
k,
a t TS1=
40, CTEe
=
.25, 7=
100 Casec and k=
constant is 3 lkCT G'r ' Therefore,
To find this ratio, an estimate of k for various charge t r a n s f e r
CT
p r o c e s s e s a r e given in the following paragraphs.
Symmetrical resonant charge t r a n s f e r
4 1
l a r g e . F o r instance, the cha.rge t r a n s f e r c r o s s section between argon -15 2
ions and argon atoms i s
6 . 5 x
10 c m and between xenon ions and -15 2xenon atoms i s 9. 7 x 10 c m
,
i. e. l a r g e r than the gas kine ticcollision c r o s s sections. It i s noted that although this charge t r a n s f e r p r o c e s s does not result in a l o s s of ions if they a r e diffusing through a neutral gas of the same species (i. e. t h e r e i s no chemical change) i t nevertheless does r e s u l t i n a v e r y sma.11 diffusion coefficient.
Asymmetric reaonant charge t r a n s f e r
Asymmetric resonant charge t r a n s f e r (Bates 1962) i s defined a s charge t r a n s f e r for which the s y s t e m that Poses the electron i s not the s a m e species a s the system which gains the electron, but never- theless the energy balance i s v e r y close. The charge t r a n s f e r c r o s s
section between hydrogen ions and oxygen atoms o r oxygen ions and hydrogen atoms, that i s
i s maximum (comparable with gas kinetic collision c r o s s section) when the adiabatic p a r a m e t e r vhl (aAE) equals unity, a i s a length s f the
-
8o r d e r of 7 x 10 cm, A E i s the energy defect, v i s the relative velocity, and h i s Planckf s constant. In the range of this experiment, the adiabatic p a r a m e t e r i s close to one. This r a i s e s the possibility of
9
l a r g e charge t r a n s f e r r a t e s between '0 and H o r H and 0 i n the hot gas (experimental r e s u l t s concerning this coupling will be
a t u r e and the relative velocities a r e low (section 2. 1, equation 7) the adia.batic p a r a m e t e r i s considerably l e s s than unity. Reactions i n this region and those f o r which AE i s l a r g e will be discussed below.
Adiabatic region
Except f o r the s y m m e t r i c and a.symmetric resonant c a s e s , charge t r a n s f e r c r o s s sections .are relatively unknown. They depend on the interaction potential, t r a n s m i s s i o n coefficient, polarizability, etc. However, a qualitative estimation of the c r o s s section i s given by Hasted (1962) and Massey and Burhop (1952). In the adiabatic
region, i. e. v h / ( a AE )
<<
1, the charge t r a n s f e r c r o s s section will be s m a l l compared with the gas kinetic c r o s s section and i n general can be e x p r e s s e d a swhere
C
i s a constant depending on the particular reaction. This exponential f o r m i s due to the c h a r a c t e r of the collision, the ions approaching the atoms with a velocity v e r y s m a l l compared with that of the atomic electrons. The l a t t e r have therefore plenty of time toreadjust themselves to the slowly changing conditions without a transition taking place.
43
H (or other impurities) i s the elastic collision c r o s s section due to the polarizability of the atom (Massey and Burhop 1952). This gives a
r a t e constant
3 where u i s the polarizability of the atom (assumed to be 2 A ), e
P
i s the electronic charge, e i s the vacuum permittivity, and br i s the 0
reduced m a s s . F o r a typical test condition; i. e. argon number density
16 -3 12 - 3
n = 6 x 1 0 cm , i m p u r i t y l e v e l 5 Q p p m i . e . n ~ 3 x 1 0 c m
,
A Im
f
=
100 sec, then k~ ~ ~ 1 0 3 r
=
( 1 It i s believed, therefore, that charge t r a n s f e r reactions a r e negligible, except in some experiments where l a r g e amounts (0. 1 p e r cent to 2 p e r cent) of H o r O2 a r e2
added.
4. 3.2 Recombination
The important recombination reaction in the thermal layer i s three body recombination, that i s
(The reaction e
+
e+
A'-- e+
A occurs relatively infrequently in the present experiment). The r a t e equation i s9
where n i s the number density of electrons and i s usually equal to e
4-
n ~ ' More precisely, n e
=
n:+
nt I.
S i m i l a r to charge t r a n s f e r(section 4. 3. l ) , the effective r a t e constant 'I; i s defined by:
R
where n
'
i s the number density of argon ion outside the thermal A00-
Payer.k~ i s of the s a m e o r d e r of magnitude a s k
R
F o r a typical t e s t condition in argon, k R = 6 . 8 x 1 0 -11 c m / s e c 3
9 12 - 3
( M a s s e y a n d B u r h o p 1 9 5 2 ) , n A m z P O c m a n d a t 7 = 1 0 0 p s e c ,
9 - 2
kRnAm r
=
O(10 ) Hence, the recombination r a t e i s negligible compared to the diffusion r a t e in these experiments. On the b a s i s of the above r e s u l t s i t can be concluded that in these experiments the reactions i n the t h e r m a l l a y e r have negligible effect on the diffusion p r o c e s s provided that the amount of impurity i s not too high ( l e s s than45
V. RESULTS AND DISCUSSION
5. 1 Calibration of Mass Spectrometer
An important, and also difficult p a r t of the study i s the cali- bration. The ions formed in the hot gas must diffuse through t h e end wall t h e r m a l l a y e r , expand through the orifice, be accelerated and collimated by the various electrodes, and then finally focused and analyzed by the magnetic field before being collected by the electron- multiplier collector, a s i s discussed in IV. An overall calibration constant of the m a s s spectrometer i s defined a s the r a t i o of the
m e a s u r e d electron-multiplier output c u r r e n t to the ion number density i n the hot gas. Due to the non- steady nature of the end wall t h e r m a l l a y e r , the m a s s spectrometer h a s to be calibrated dynamically, which
s e e m s to be an impossible task.
Hydrogen calibration
Fortunately, in "purett argon (defined in 5. 2) with 0. % per cent o r 0 . 5 per cent H2 mixed i n argon, the measured ion t r a c e s of
hydrogen r e a c h equilibrium before the t e s t time i s ended ( a s will be shown in the next section). In these c a s e s an approximate calibration constant f o r the 1 amu pea.k a t 14, 300°JS, can be obtained, i f i t i s assumed that the hydrogen atoms a r e nearly fully ionized (Appendix A).
- 2 3 3
The result i s 6 x 10 a m p / i o n s / c m
.
This i s obtained f r o m ther e s u l t s of the highest temperature (14, 3 0 0 ~ ~ ) and lowest impurity level (50 ppm) runs in the s e experiments (an averaged value of the calibration
-
23 346
This calibration constant a g r e e s in sa.me o r d e r of magnitude with the calculated value, which takes a.ccount of the t h e r m a l l a y e r diffusion (the ra.tio of ion density in the shock hea.ted gas to that a t the orifice i s
-18 3
0. 11, the jet (the jet flux, 3 x 10 a.mp/ions/cm
,
coming out f r o m the sampling orifice i s obtained by assuming isentropic nozzle flow),- 4
and the efficiency of the accelerating slits (2. 5 x 10
,
which i s obtained by me asuring the ra.tio. of ions collected by the collector to that collected by the accelerating slits). Using this calibration constant the absolute values of the ionization collision c r o s s section of hydrogen can be obtained.Other calibration
F o r argon o r xenon, an a.pproximate calibration can be made by using Kelly's (1966) r a t e constant f o r argon ionization to calculate the ion density in the hot gas. The calibration constant thus obtained i s an o r d e r of magnitude l e s s than the hydrogen calibration constant. The reason f o r this difference i s mot c l e a r . It may be either that the calibration constant depends on the m a s s o r that the rate constant obtained by Kelly i s too high ( m o r e comparison with Kelly's r e s u l t s will be given Bate r). Nevertheless, to obtain the relative ionization r a t e s , the activation potentials, etc. the calibration constant i s not n e c e s s a r y .
5 . 2 Shock Heated Argon T e s t conditions