IMAGE STEGANOGRAPHY USING
BLOCK COMPLEXITY ANALYSIS
GOWTHAM DHANARASI1
Department of ECE, JNTU Kakinada Kakinada, Andhra Pradesh, 533003, INDIA
Dr.A. Mallikarjuna Prasad2
Department of ECE, JNTU Kakinada Kakinada, Andhra Pradesh, 533003, INDIA
Abstract:
A block complexity analysis for transform domain image stegonagraphy is introduced in this paper. The algorithm proposed here works on the wavelet transform coefficients which embedded the secret data into the original image. The technique implemented which are capable of producing a secret-embedded image that is indistinguishable from the original image to human eye. This can be achieved by retaining integrity of the wavelet coefficients at high capacity embedding. This improvement to capacity-quality trading –off interrelation is analyzed in detailed and experimentally illustrated in the paper.
Keywords: stegonagraphy ; capacity-quality trading –off interrelation;.
1. Introduction
Digital data communication is an essential part of everyone’s life. Data communications have some problems such as internet security, copyright protection etc. To avoid these problems, cryptography is one of the methods. However, encryption results in a disordered and confusing message and can attract eavesdroppers easily. Steganography methods overcome this problem by hiding the secret information behind a cover media (video, audio or image) because the presence of information cannot be noticed by any attacker.
Using steganography, embed a secret message inside a piece of unsuspicious information and send it without anyone knowing of the existence of the secret message. Steganography and cryptography are closely related. Cryptography scrambles messages so they cannot be understood. Steganography on the other hand, will hide the message so there is no knowledge of the existence of the message in the first place.
In some situations, sending an encrypted message will arouse suspicion while an “invisible” message will not do so. Both sciences can be combined to produce better protection of the message. In this case, when the steganography fails and the message can be detected, it is still of no use as it is encrypted using cryptography techniques.
Steganographic techniques have been used for centuries. The first known application dates back to the ancient Greek times, when messenger stat toed messages on their s halved heads and then let their hair grow so the message remained unseen. A deferent method from that time used wax tables as a cover source. Text was written on the underlying wood and the message was covered with a new wax layer. The tablets appeared to be blank so they passed inspection without question.
In the 20th century, invisible inks where a widely used technique. In the Second World War, people used milk, vinegar, fruit juices and urine to write secret messages. When heated, these fluids become darker and the message could be read. Even later, the Germans developed a technique called the microdot. Micro dots are photographs with the size of a printed period but have the clarity of a standard type-written page. The micro dots where then printed in a letter or on an envelope and being so small, they could be sent unnoticed.
2. Proposed Algorithm
represents a soft approximation to the image. The HL, LH and HH bands represent the vertical, horizontal, and diagonal features of the image, respectively. These three bands convey the details of the image. We can do the same decomposition on the LL quadrant up to log2 (min (height, width)). Figure 1 visualizes a two-level wavelet transform. The 2D wavelet transform used in this algorithm is the integer wavelet transform introduced in [4], the same transform used in [5].
Fig. 1.Two Dimensional wavelet transform
2.2.Bit Plane Complexity Segmentation
Generally, wavelet domain allows for hiding data in regions that the HVS is less sensitive [1]. To do this, we adapt the amount of embedded data in each region of wavelet transform domain with a measure of noisiness in that region. Here, we use the bit-plane complexity segmentation (BPCS) [2] as the measure of noisiness.
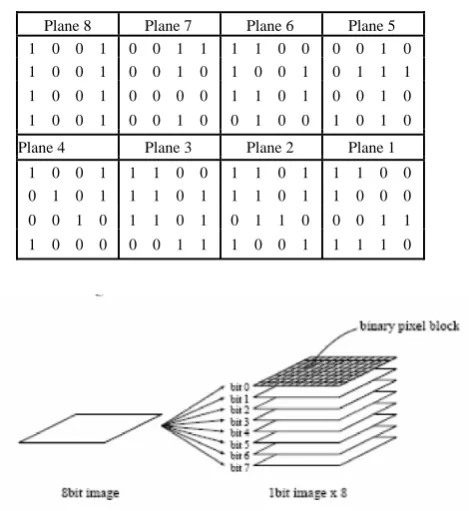
Each rgb component of a 24-bit bitmap image is an 8-bit value that changes from 0 to 255. In each color plane, the value zero represents the darkest shade of that color, where the brightest shading corresponds to the 255 value. Fig. 2 shows a 4 x 4 test image with the rgb values shown in table i. therefore, the r channel is decomposed as indicated in table ii. now, the bit plane segmentation, visualized in figure 3, results in eight binary planes for r channel, as shown in table III.
As a benchmark to measure the amount of noisiness of a bit plane, we use the black and white border image complexity defined by Kawaguchi [2]. Based on the definition, the complexity for a black and white border P (equivalent to our segmented plane) is the ratio of the number of total B-W changes in the plane to its maximum possible value, denoted as α(P), where 0<α(P)<1.
Fig. 2. Test image
TABLE I. RGB VALUES FOR TEST IMAGE
R 1 2 3 4 G 1 2 3 4 B 1 2 3 4
1 175 39 80 202 1 247 223 9 69 1 9 247 247 252
2 167 30 80 190 2 225 206 30 32 2 30 225 255 251
3 164 38 91 165 3 217 199 38 4 3 38 217 217 255
TABLE II. BINARY REPRESENTATION OF R CHANNEL
TABLE III. BINARY PLANES FORM R CHANNEL
Fig. 3. Decomposition of block to binary planes
Following measuring the complexity of each plane, we compare the complexity to a threshold to decide if it is a noisy plane. This threshold is to compromise between capacity and imperceptibility. We segment each channel of wavelet transform representation into 8 x 8 blocks with pixel values changing from 0 to 255. For each block, we construct the relevant 8-bit planes and compare the bit plane complexity with threshold from the MSB bit plane to the LSB bit plane.
Once the first plane with a complexity higher than the threshold is found, we decide on the number of bits that can be embedded in the block pixels. As an example, we can embed five bits of message in the five LSBs of each pixel of the block, if the fourth plane is the first one with a complexity higher than the threshold. For each RGB channel, the threshold is adjusted adaptively according to:
Cth = C in xCmax (1)
WhereCin is the parameter to compromise between capacity and imperceptibility ranging from zero to
one, Cmax denotes the maximum complexity in the relevant channel, and Cth is the comparative threshold used
for making decision on the planes of that channel.
2.3. Algorithm
We segment the wavelet representation of the image into 8x8 blocks and determine the capacity of each block, in terms of bit per pixel, using the BPCS. A random seed is used to determine the order of conveying blocks. For each block, the red, green, and blue channels are used for the message bit embedding. The pseudorandom generator is initialized using a session key, agreed between transmitter and receiver.
The embedding rule is the pixel value is changed into the nearest integer with the last LSB bits equal to the input bits. For example, assume that capacity of the current block is found to be 3 bits. Then, the current
10101111 00100111 01010000 11001010 10100111 00011110 01010000 10111110 10100100 00100110 01011011 10100101 10011011 00100001 01010101 10000110
Plane 8 Plane 7 Plane 6 Plane 5 1 0 0 1 0 0 1 1 1 1 0 0 0 0 1 0 1 0 0 1 0 0 1 0 1 0 0 1 0 1 1 1 1 0 0 1 0 0 0 0 1 1 0 1 0 0 1 0 1 0 0 1 0 0 1 0 0 1 0 0 1 0 1 0 Plane 4 Plane 3 Plane 2 Plane 1
value of the pixel is 14 or (00001110)b. And, in the case of input equal to (101)b, there is no preference for choosing 13 or 21, as the output value. The embedding rule is simply described as:
y = x + A X (A ≤ B ) −B x (B < A ) (2) Where
A = mod(m− x ,2c)
B = mod(x− m , 2c) (3)
and x ,m, c, and y stand for pixel value, input value, capacity, and output value, respectively.
There are two exceptions in the embedding algorithm discussed above. The first one is about the first pixel of each block that is used to convey the capacity, with a 3-bit input indicating the block’s capacity changing from 0 to 7. These three bits suffice to bear the amount of capacity, because the MSB plane would never change even for very low thresholds. The next exception applies to the planes with capacity equal to 1, where we use a specific embedding method described in section IV.
Applying the abovementioned rules to the sender end, ensures us to extract the message in the receiver end based on the equation below, where c, y, and m denote capacity, pixel value, and extracted message bit, respectively.
m = mod(y ,2c ) (4)
The embedding and the extracting algorithms are detailed in the following:
2.3.1.Embedding
(1)Compute the 2D wavelet transform of the image and segment it into 8x 8 blocks. (2)Use the secret key to determine the order of blocks selected for embedding.
(3)Find the maximum complexity of blocks of each channel and, hence, the appropriate complexity threshold for that channel.
(4)Determine the capacity of each block finding its first MSB plane possessing a complexity higher than the threshold.
(5)Embed the capacity of the block in its first pixel using (2) and (3) with c=3 and m=capacity.
If the capacity is not equal to 1, embed the input bits of the block capacity in its remaining pixels using (2) and (3). Otherwise, change the pixels such that to satisfy (7) using the method in [6]. Generate the stego image by computing g the inverse 2D wavelet transform.
2.3.2. Extracting
(1)Compute the 2D wavelet transform of the image and segment it into 8x8 blocks. (2)Use the secret key to determine the order of blocks selected for embedding.
(3)Extract the capacity of blocks using (4) with c equal to 3 from the first pixel of the block.
(4)Extract the message bits using (4) with c equal to the capacity extracted in step3, if c is not equal to one; otherwise, use (7) for extraction.
3. Different parameter associated with embedded image:
3.1. PSNR
Peak signal to noise ratio is defined as Measures the differences between two images, and measurement of image quality.
PSNR = 10 * log10(b/rms) (5)
3.2. SSIM
The structural similarity (SSIM) index is a method for measuring the similarity between two imagesM:
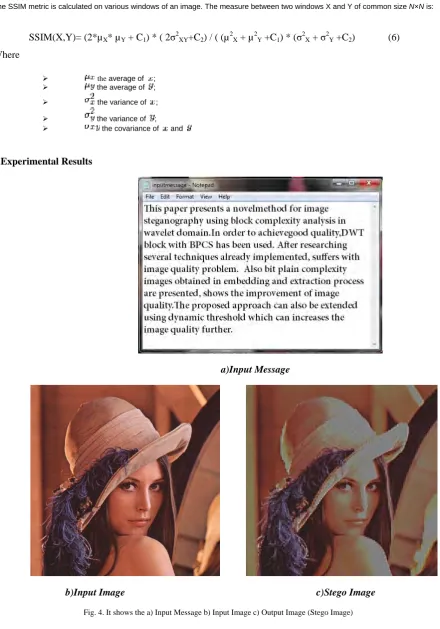
The SSIM metric is calculated on various windows of an image. The measure between two windows X and Y of common size N×N is:
SSIM(X,Y)= (2*µX* µY + C1) * ( 2σ2XY+C2) / ( (µ2X + µ2Y +C1) * (σ2X + σ2Y +C2) (6)
Where
the average of ;
the average of ;
the variance of ;
the variance of ;
the covariance of and
4.Experimental Results
a)Input Message
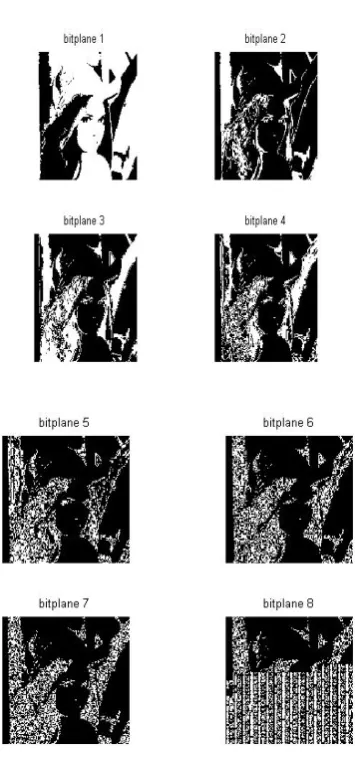
4.1 Bit planes formed while Embedding
Fig.
5.The bit planes formed while embedding
4.2 Bit planes formed while Extraction:
Conclusion:
This paper presents a novel method for image steganography using block complexity analysis in wavelet domain. Many researchers have been reported different techniques but all the methods suffers with image quality problem. So in order to achieve good quality, DWT block with BPCS has been used. Also bit plain complexity images obtained in embedding and extraction process are presented, which shows the improvement of image quality. The proposed approach can also be extended using dynamic threshold which can increases the image quality further.
References
[1] Saeed Sarreshtedari and Shahrokh Ghaemmaghami “High capacity image steganography in wavelet domain,”2010
[2] R. O. El Safy, H.H. Zayed, A. El Dessouki, “An adaptive steganographic technique based on integer wavelet transform,” 2009. [3] E. Kawaguchi and R. O. Eason, “Principle and application of BPCS steganography,”in Proc. SPIE, vol3529, pp 464-473, 1998.R.
Calderbank, 1. Daubechies, W. Sweldens and B. Yeo., "Wavelet transforms that map integers to integers". Applied and Computational Harmonic Analysis, vol.5, noJ, pp.332-369, 1998.
[4] M. K. Ramani, E. V. Prasad, S. Varadarajan, “Steganography usingBPCS to the integer wavelet transformed image” IJCSNS, July 2007.
[5] S. Sarreshtedari, M. Ghotbi, S. Ghaemmaghami, “One-third probabilityembedding: less detectable steganography,” IEEE International [6] conference on multimedia and expo, July 2009.
[7] D.Artz “Digital steganography : Hiding data with in data,” IEEE Internet computing , pp75-80, May-June 2001
[8] E.kawaguchi and R.O.Eason, “Principle and application of BPCS-steganography,” in proc. SPIE, vol 3529, pp 464-473,1998
[9] T.G.Gao, Q.L.Gu, “Reversible watermarking algothm based on wavelet lifting scheme,” Wavelet analysis and pattern recognisation conference, November 2007.