RESEARCH
A multiobjective approach
for identifying protein complexes and studying
their association in multiple disorders
Sanghamitra Bandyopadhyay
1, Sumanta Ray
2, Anirban Mukhopadhyay
3and Ujjwal Maulik
4*Abstract
Background: Detecting protein complexes within protein–protein interaction (PPI) networks is a major step toward the analysis of biological processes and pathways. Identification and characterization of protein complexes in PPI net-work is an ongoing challenge. Several high-throughput experimental techniques provide substantial number of PPIs which are widely utilized for compiling the PPI network of a species.
Results: Here we focus on detecting human protein complexes by developing a multiobjective framework. For this large human PPI network is partitioned into modules which serves as protein complex. For building the objective functions we have utilized topological properties of PPI network and biological properties based on Gene Ontology semantic similarity. The proposed method is compared with that of some state-of-the-art algorithms in the context of different performance metrics. For the purpose of biological validation of our predicted complexes we have also employed a Gene Ontology and pathway based analysis here. Additionally, we have performed an analysis to associ-ate resulting protein complexes with 22 key disease classes. Two bipartite networks are creassoci-ated to clearly visualize the association of identified protein complexes with the disorder classes.
Conclusions: Here, we present the task of identifying protein complexes as a multiobjective optimization problem. Identified protein complexes are found to be associated with several disorders classes like ‘Cancer’, ‘Endocrine’ and ‘Multiple’. This analysis uncovers some new relationships between disorders and predicted complexes that may take a potential role in the prediction of multi target drugs.
Keywords: Protein–protein interactions, Protein complex, Multiobjective optimization, Gene Ontology, Disorders
© 2015 Bandyopadhyay et al. This article is distributed under the terms of the Creative Commons Attribution 4.0 International License (http://creativecommons.org/licenses/by/4.0/), which permits unrestricted use, distribution, and reproduction in any medium, provided you give appropriate credit to the original author(s) and the source, provide a link to the Creative Commons license, and indicate if changes were made. The Creative Commons Public Domain Dedication waiver (http://creativecommons. org/publicdomain/zero/1.0/) applies to the data made available in this article, unless otherwise stated.
Background
Recent advancement in biotechnology produces lots of information about protein–protein interactions. Those information act as a potential source to construct the protein–protein interaction network (PPIN) for a sin-gle species. Protein complexes are generally described as molecular aggregation of a set of proteins connected by multiple protein–protein interactions. Protein com-plexes play different functions in the cell. It can serve as cellular machines, rigid structures, and posttranslational modification systems. In general cellular functions and
biochemical events in cell are coordinately performed by a groups of proteins interacting with each other in pro-tein complexes. Identifying such propro-tein complexes is important for understanding the structure and functions of these biochemical events. Moreover, changing of inter-action pattern of proteins is the consequence of many diseases. Identifying such interactions through protein complexes predominantly lead to applications in disease diagnosis.
In usual representation, protein complexes take the form of a dense clusters of proteins connected through multiple interactions. Different computational methods for finding dense regions in the PPI network are available in literature. Several techniques based on graph cluster-ing, finding dense regions, or clique finding have been
Open Access
*Correspondence: [email protected]
4 Department of Computer Science and Engineering, Jadavpur University, Kolkata 700032, West Bengal, India
proposed to discover protein complexes in PPI networks [1–4]. In [5] Molecular Complex Detection (MCODE) has been proposed to detect protein complexes in PPI network. MCODE generally emphasizes on the local neighborhood density of nodes and puts weight to all the nodes corresponding to the local density. Starting from the top weighted node it iteratively adds vertices which have weights above a certain threshold.
In [6] a clustering with overlapping neighborhood expansion (ClusterONE) is proposed for detecting over-lapping protein complexes from protein–protein inter-action data. ClusterONE generally follows a greedy procedure to update the partially constructed groups of vertices based on high cohesiveness among the vertices. The growth process is repeated from different seeds to form multiple, possibly overlapping groups. In the sec-ond step, overlapping groups are merged based on over-lap scores.
In [7] an algorithm called Affinity Propagation is pro-posed which is basically an unsupervised algorithm and thus the number of clusters is automatically calculated. The data points are grouped based on the similarity between each pair of data points. Initially all data points are considered as potential “exemplars”. The main algo-rithm is concentrated on finding sub-paths, which allow easy message exchanges between nodes. In subsequent steps, the exchange of message is continued to happen between the nodes until a set of exemplars and corre-sponding clusters with high quality come out.
In [8] a multiobjective framework is proposed for detecting protein complexes in yeast PPI network. Here two different types of objectives are utilized for search-ing over the whole PPI network to predict modules which serve as protein complexes. Density of the module and Gene Ontology based semantic similarity measures are taken into account for building the objectives.
All these methods primarily focus on the detection of protein complexes in PPI network of model organism yeast (S. cerevisiae). Although, there have been several studies on determining and analyzing protein complexes in a single organism, computational analysis of human protein complexes is not studied in extensive manner. Some studies have analyzed human protein complexes based on a particular disease association [9–11]. These studies are focused on finding protein complexes associ-ated with some specific disease. Here, we have proposed a multiobjective evolutionary technique for detecting protein complexes in human PPI network and studied their involvement in different disease classes.
In general, it has been observed that the proteins within a complex are functionally similar and carry out common biological activities. For measuring the functional simi-larity between two proteins we have computed semantic
similarity between Gene Ontology terms associated with those proteins. In linguistic, to measure the similar-ity between two concepts, semantic similarsimilar-ity is used. This can be extended to measure the similarity between GO-terms in the GO database [12]. Here, we have uti-lized the Relevance [13] semantic similarity measure for obtaining semantic similarity between two proteins. This serves one of the objective function of our multiobjec-tive framework. Besides the semantic similarity meas-ure topological properties of PPI network are also used here for building the objective functions. Non dominated sorting genetic algorithm II (NSGA-II) [14, 15], a popu-lar multiobjective Genetic Algorithm (GA) [16] has been utilized as the underlying optimization tool. The results are collected by applying the proposed algorithm in the protein–protein interaction (PPI) data downloaded from the Human Protein Reference Database (HPRD) [17]. The performance of our method is compared with that of some other existing methods such as MCODE [5], clus-terONE [6], Affinity propagation [7], Core attachment method [18], COACH [19], RNSC [20], MCL-Caw [21], and PEWCC [22].
strategies in Polypharmacological drug discovery which focus on multi-target drugs.
Methods
In this section we describe the proposed multiobjective method for detecting protein complexes in human PPI network. Non-dominated Sorting GA (NSGA-II) [14] is employed as an underlying multiobjective framework.
Chromosome representation
Here a protein complex (or a subgraph of human PPI graph) is encoded as a chromosome. It is represented as p1,p2. . .pn where pi is the ith protein in whole human
protein set. Thus a chromosome represents a protein complex containing the nodes p1,p2,. . .pn, and the edges
among them represent interactions.
Population initialization
For starting from a reasonable position we construct the initial population as a set of modules with high density. For this purpose we randomly chose some substructure consisting of all 1s from adjacency matrix. To find out all 1s substructures we apply a biclustering technique [24] and randomly pick up some of the biclusters consisting of all 1s. Here, union of rows and columns of each bicluster is treated as a chromosome, which comprise the initial population.
Representation of objective functions
Here two categories of objective functions are built, one is based on the topological characteristics of the net-work and the other captures gene ontological similarity of proteins. To define the two objective functions belong-ing to the first one we have incorporated some graph-based properties of the PPIN. For the other category, we employed GO based semantic similarity measure.
Objective functions related to the topological properties We have defined two objective functions in this category. One is based on the density of protein complexes, and other is based on closeness centralities. The density of a graph is defined as ratio of the number of edges pre-sent in a graph to the possible number of edges in a com-plete graph of same size. Protein complexes generally represent high dense area in the PPIN. Large number of interactions (or edges) among proteins (or nodes) in the complex is the possible reason behind that. Thus, using density as an objective function and maximizing it for individual subgraphs will yield much denser complexes.
For choosing the next objective we calculate the contri-bution of a node as follows: Contr(ni)= |Nni
|
degree(ni), where Nni represents the set of nodes directly connected with
node ni in a protein cluster C. Now the contribution of
a protein cluster can be calculated as the summation of these values which can be formulated as:
Maximizing this will produce clusters having small num-ber of outward interaction partners for a node, thus pro-ducing compact as well as separated clusters.
Closeness centrality of a vertex in a graph is defined as the reciprocal of average shortest-path distance to other vertices. It can be considered as the efficiency of a node (individual) in spreading information to others in the net-work. Higher value of it indicates that most of the nodes are closer to that node. Here we maximize the objective function:
where C represents a protein cluster and CC(ni) is the closeness centrality of the node ni. Maximizing this ensures that the resulting clusters have nodes which are more central in the whole protein interaction graph and are likely to form a protein complex.
Objective function related to Gene Ontology
Proteins within the protein complexes are functionally similar to each other. This suggests that these proteins have high semantic similarity among themselves. This is measured by computing the semantic similarity between GO-terms they are annotated with. As proteins are anno-tated with multiple GO terms, so, the similarities are calculated by averaging the similarities of the GO term cross pairs which are associated with them [25]. We have calculated the similarities among all pairs of proteins in the PPI network and given these as weights of edges in semantic similarity network. The average similarity of all pairs of proteins corresponding to the edges of a chro-mosome is treated as fitness value of it. For example, the fitness of a chromosome or a subgraph is calculated by summing up all the weights of edges and averaging these values. This can be written as:
where s is the chromosome consisting of nodes n1,n2,. . .np, (ni,nj)ǫE, where E is the set of edges and w is a weight function defined as w:E→ [0, 1].
Mutation procedure
The usual genetic operators are selection, crossover, and mutation. Here crossover operation is not performed as it produces large number of disconnected graphs. For (1)
niǫC
Contr(ni).
(2)
niǫC
CC(ni),
(3)
sim(s)=
p
i=1,j=1,i�=jw(ni,nj)
selection the conventional crowded binary tournament selection in NSGA-II is used here. As whole subgraph is encoded as a chromosome, so a perturbation in node is performed by means of mutation with a high probability (p=0.9).
If a chromosome n1,n2,. . .,n9 is selected to be mutated then the following process is performed:
• Randomly select some of the nodes.
• Insertion and deletion are performed with equal probability:
– Insertion: Add the nodes which are directly con-nected with the selected nodes.
– Deletion: Delete the selected nodes.
The whole process is shown in Fig. 1.
Results and discussions
Here we illustrate the performance of our proposed technique and compare this with three well known algo-rithms MCODE [5], clusterONE [6] and Affinity propa-gation [7]. We download human PPI dataset from Human
Protein Reference Database (HPRD) [17] which contains 39,240 interactions among 9,589 human proteins (The data is given in Additional file 1). Table 1 summarizes the topological properties of the network created from this database. We compare the results with known pro-tein complexes downloaded from a database PCDq [26]. It consists of both predicted and curated human protein complexes and is contains 1,264 complexes with 9,268 proteins and 32,198 PPIs. To investigate the functional enrichment of our predicted complexes we have also per-formed a Gene Ontology based analysis here. The source code of our proposed method is given in Additional file 2. Performance comparisons with existing methods
Here, for comparing our results with that of some state-of-the-art algorithms we have utilized some matching statistics like Sensitivity, Positive Predictive Value (PPV), and Accuracy [27].
We have built a Contingency Table (T) with n rows and m columns where rows and columns represent predicted and real protein complexes, respectively. The value of each cell Ti,j indicates the number of common proteins between real and predicted complexes.
a b
c
d
Sensitivity
Sensitivity is defined as the fraction of proteins in real complex i found in predicted complex j: Sni,j= TNi,ij, where Ni is the number of proteins belonging to com-plex i. A complex-wise sensitivity Sncoi is defined as:
Sncoi=maxmj=1Sni,j. The General Sensitivity (Sn) is the weighted average of complex-wise sensitivity Sncoi over all complexes and is defined as:
Positive predictive value
The positive predictive value is the proportion of proteins in predicted complex j which belong to the real complex i and is defined as: PPVi,j = nTi,j
i=1Ti,j =
Ti,j
T.j, where T.j is the marginal sum of a column j. Complex-wise-wise positive predictive value PPVclj represents the maximal fraction of proteins of predicted complex j found in some real com-plex: PPVclj =maxni=1PPVi,j. The General PPV(PPV) of a clustering result is the weighted average of complex-wise PPV(PPVclj) over all predicted complexes, and is defined as:
Accuracy
The Geometric Accuracy (Acc) represents a tradeoff between sensitivity and the positive predictive value and it is defined as:
The advantage of taking the geometric mean is that it yields a low score when either the Sn or the PPV metric is low. High accuracy value thus requires a high perfor-mance for both the criteria.
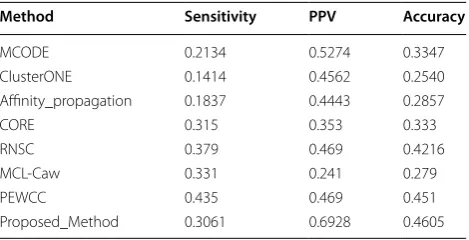
In Table 2 we show the comparative performance of different existing algorithms with our proposed method using these three metrics. It may be noted that the pro-posed method performs comparatively well than the other algorithms with respect to sensitivity, PPV and accuracy.
We have also performed an analysis to compare the performance of different existing algorithm with the pro-posed one. Let B=B1,B2,. . .Bn and C=C1,C2,. . .Cm
(4) Sn=
n
i=1NiSncoi
n
i=1Ni
.
(5) PPV =
m
j=1T.jPPVclj
m
j=1T.j
.
(6)
Acc=Sn∗PPV.
be the sets of benchmark and predicted complexes respectively. The Jaccard index J represents the overlap between a benchmark complex and predicted complex. It is defined as J(Bi,Cj)= |Bi
Cj|
|BiCj|. A benchmark com-plex is said to be covered by a predicted comcom-plex if the value of j is greater than some threshold value. In this respect Recall (coverage) and precision (sensitivity) can be defined as
where J(Bi,Cj) >t, for some CjǫC, and
where J(Bi,Cj) >t for some BiǫB
We evaluate the performance of the existing methods by plotting the precision versus recall curves for the pre-dicted complexes. These curves are plotted by tuning the threshold value t from 0 to 1. This is shown in Fig. 2. From this plot we have also computed the AUC score for each of the methods. The AUC score is shown in Table 3. It is evident from the Fig. 2 and Table 3 that proposed method shows best precision and recall compare to the other state-of-the-art. The processed data for construct-ing the ROC plot are given in Additional file 3.
Analysis of predicted complexes
In Table 4 we have shown the resulting protein com-plexes and compared them against the real one. Most of
(7) Recall= |Bi|
|B|,
(8)
precision= |Cj|
|C|, Table 1 Summary of the human PPI network data sets used here
Data set #Proteins #Interactions Avg. degree Max. degree Density Clustering
coef-ficient #Connected components Network diam-eter Avg. number of neighbors
HPRD 9,589 39,240 7.924 271 0.001 0.102 262 14 7.703
Table 2 Comparison of performance of different algo-rithms with respect to sensitivity, PPV and accuracy
Method Sensitivity PPV Accuracy
MCODE 0.2134 0.5274 0.3347
ClusterONE 0.1414 0.4562 0.2540
Affinity_propagation 0.1837 0.4443 0.2857
CORE 0.315 0.353 0.333
RNSC 0.379 0.469 0.4216
MCL-Caw 0.331 0.241 0.279
PEWCC 0.435 0.469 0.451
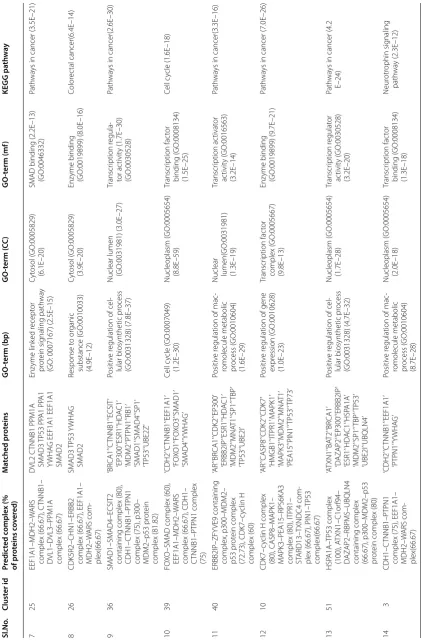
them show a good overlap with real complexes. We plot a bar diagram to show this overlap. In Fig. 3 Y-axis rep-resents proportion of proteins in predicted complexes involved in some real one. From this figure it is notice-able that most of the protein complexes share good pro-portion of proteins with some real complexes with an average proportion of 79.68%. The smallest complex con-sists of 11 proteins in which 8 proteins are involved in some real complexes whereas the largest one comprises of 272 proteins out of which 183 proteins are involved in some real complexes. We have also preformed a GO and pathway based study to biologically validate the predicted complexes.
Columns 3 and 4 of Table 4 represent predicted com-plexes and the list of proteins that are matched with some real one, respectively. Columns 5, 6, 7 and 8 of this table represent most significant GO-terms with three annotations [viz., biological process (BP), cellular component (CC), molecular function (MF)] and KEGG pathways that are associated with the predicted com-plexes. Here, we notice that more than one complex are grouped in one predicted cluster. For example in row 4 of Table 4 the predicted cluster captured two com-plexes: p300–MDM2–p53 protein complex and CDH1– CTNNB1–PTPN1 complex. It is not quite unexpected because the real complexes that have some common functionality or have some common signaling pathway
tend to group in one cluster. In row 1, predicted cluster 5 captures good proportion proteins of four real com-plexes viz., CTNNB1–DVL1–DVL3–PPM1A complex (80%), HSPB1–PPA1–PPA1–SETDB1–TP53–WIPI1 complex (66.67%), EEF1A1–MDH2–WARS complex (66.67%) and transforming growth factor–SMAD com-plex (66.67%). The comcom-plex CTNNB1–DVL1–DVL3– PPM1A is composed of genes DVL1, DVL2, CTNNB1, PPM1A and DVL3. Protein phosphatase 1A (PPM1A) is an enzyme which is encoded by the PPM1A gene. The proteins encoded by this gene is a member of PP2C family of Ser/Thr protein phosphatases and are gen-erally known to be a negative regulator of cell stress response pathways. Catenin (cadherin-associated protein), beta 1 (CTNNB1) is an integral part of the canonical Wnt signaling pathway which is a network of proteins that passes signals from receptor of the surface of cell to the nucleus that leads to the expres-sion of target genes. Signaling via Wnt signaling path-way also causes activation of histone methyltransferase (SETDB1) and subsequently represses PPARgamma transactivation [28]. Moreover SMAD1 indirectly enhances Wnt signaling by suppressing the expression of Wnt signaling inhibitors [Dickkopf 1 (Dkk1) and 2] with interleukin (IL)-11. We can notice from Table 4, row-1 that predicted cluster 5 is associated with Colo-rectal cancer pathway (p-value: 2.9E 11). In different literature [29–31] it is established that activation of the Wnt signaling pathway via mutation of the adenoma-tous polyposis coli gene (APC) is the critical reason for colon carcinogenesis.
Most of our predicted protein complexes are associated with SMAD complexes like transforming growth fac-tor–SMAD complex, FOXO–SMAD complex, SMAD1– SMAD4–ECSIT2 containing complex etc. SMADs are intracellular proteins that transduce extracellular signals from transforming growth factor beta (TGF-β) ligands to the nucleus. In the nucleus, SMAD complexes attach in some specific areas of DNA and control the activity of particular genes and regulate cell proliferation [32].
From Table 4 it is worth-mentioning that most of the predicted clusters are enriched with several cancer related pathways viz., colorectal cancer, chronic myeloid leukemia, prostate cancer etc. This suggests that the pre-dicted clusters are biologically meaningful and important for uncovering different cancer associated modules.
Table 3 AUC score of different methods
MCODE ClusterONE Affinity_Propagation COACH RNSC MCL-Caw PEWCC Proposed method
AUC 0.1096 0.0590 0.2714 0.3572 0.2277 0.0841 0.6595 0.7244
Table 4 P redic ted pr ot ein c omple xes
, their GO
-t
erms
, p
-v
alues
, and KEGG pa
th w ay s Sl .No . Clust er id Pr edic ted c omple x (% of pr ot eins c ov er ed) M at ched pr ot eins GO -t erm (bp ) GO -t erm ( CC ) GO -t erm (mf ) KEGG pa th w ay 1 5 C TNNB1–D VL1–D VL3– PP
M1A complex (80%),
HSPB1–PP A1–PP A1– SE TDB1– TP53– WIPI1
complex (66.67), EEF1A1– MDH2–
W ARS complex (66.67), transf or ming gr owth fac tor –SM AD complex (66.67) D VL2, ‘C TNNB1’ ‘PP M1A ’ ; ‘SM AD3’ ‘TP53’ ‘PP A1’ ‘PP A1’; YWHA G ’ ‘EEF1A1’; ‘EEF1A1’ ‘SM AD2’ Enz yme link ed r ecept or pr ot ein sig naling path wa y
(GO:0007167 ) (5.9E–11)
Cyt osol ( GO:0005829) (3.4E–11) Enz yme binding (GO:0019899) (1.5E–12) Color ec tal cancer (2.9E–11), P ath wa ys in cancer(1.2E–10) 2 6 CDH1– C TNNB1–PTPN1 complex(50), transf or m -ing g ro wth fac tor –SM AD
complex (66.67), HSPB1– PPA1–PP
A1–SE TDB1– TP53– WIPI1 complex (66.67) D VL2 SM AD3 TP53 Y WHA G Response t o or ganic substance ( GO:0010033) (4.2E–14) Cyt osol ( GO:0005829) (2.5E–25) Pr ot ein k inase ac tivit y (GO:0004672) (1.8E–10) Path wa
ys in cancer (6.1E–19)
3 8 M AR CKS–NM T1– TP53 com
-plex (66.67), transf
or ming gr owth fac tor –SM AD
complex (75), C
TNNB1– D VL1–D VL3–PP M1A complex (50) C TNNB1 SM AD3 TP53 YWHA G TP53 SM AD2 Pr ot
ein amino acid phos
-phor ylation ( GO:0006468) (4.1E–14) Cyt osol ( GO:0005829) (3.8E–23) Pr ot ein ser ine/thr eo -nine k inase ac tivit y (GO:0004674) (1.7E–11) Chr onic m yeloid leuk emia (5.7E–16) 4 11 p300–MDM2–p53 pr ot ein
complex (63.64), CDH1– CTNNB1–PTPN1 complex (60)
HD A C1 TP53 ESR1 TP53 C TNNB1 Positiv e r egulation of nitr ogen compound metabolic pr ocess (GO:0051173) (4.1E–20) Nucleoplasm ( GO:0005654) (2.6E–18) Transcr iption fac tor binding ( GO:0008134) (1.5E–15) Pr ostat
e cancer (2.0E–12)
5
15
p300–MDM2–p53 pr
ot
ein
complex (72.73), CASP8– MAPK1–M
APK3–PEA15– RPS6K A3 complex (60),CDH1– C TNNB1–
PTPN1 complex (75), EP300–HO
XB6–HO XB7 complex (66.67) EP300 HD A C1 TP53 ESR1
LCK HSP90AA1 M
APK1 M APK3 EP300 TP53 EP300 TP53 FO XO1 SM AD4 EP300 SM AD2 C TNNB1
PTPN1 HGS EP300 EEF1A1 SM
AD2
Positiv
e r
egulation of mac
-romolecule metabolic process (
GO:0010604) (4.5E–34) Nucleoplasm ( GO:0005654) (3.1E–34) Transcr iption r egulat or ac tivit y ( GO:0030528) (7.6E–26) Chr onic m yeloid leuk emia (9.1E–26) 6 20 Smad pr ot ein complex (53.33), FO XO –SM AD
complex (60), transf
or m -ing g ro wth fac tor –SM AD
complex (75), CDH1– CTNNB1–PTPN1 complex (75)
SM AD3 SM AD2 L CK HSP90AA1 TP53 Y WHA G C TNNB1 SM AD2 Positiv e r
egulation of cel
-lular biosynthetic pr
Table 4 c on tinued Sl .No . Clust er id Pr edic ted c omple x (% of pr ot eins c ov er ed) M at ched pr ot eins GO -t erm (bp ) GO -t erm ( CC ) GO -t erm (mf ) KEGG pa th w ay 7 25 EEF1A1–MDH2– W ARS
complex (66.67), C
TNNB1– D VL1–D VL3–PP M1A complex (66.67) D VL2 C TNNB1 PP M1A SM AD3 TP53 PP A1 PP A1 YWHA
G EEF1A1 EEF1A1
SM AD2 Enz yme link ed r ecept or pr ot ein sig naling path wa y
(GO: 0007167) (2.5E–15)
Cyt
osol (
GO:0005829)
(6.1E–20)
SM
AD binding (2.2E–13) (GO:0046332)
Path
wa
ys in cancer (3.5E–21)
8
26
CDK5R2–
CHN1–ERBB2
complex (66.67), EEF1A1– MDH2–
W ARS com -plex(66.67) SM AD3 TP53 Y WHA G SM AD2 Response t o or ganic substance ( GO:0010033) (4.9E–12) Cyt osol ( GO:0005829) (3.9E–20) Enz yme binding (GO:0019899) (8.0E–16) Color ec tal cancer(6.4E–14) 9 36 SM AD1–SM AD4–ECSIT2
containing complex (80), CDH1–
C
TNNB1–PTPN1
complex (75), p300– MDM2–p53 pr
ot ein complex (81.82) ‘BR CA1’ ‘C TNNB1’ ‘ECSIT ’ ‘EP300’ ‘ESR1’ ‘HD A C1’ ‘MDM2’ ‘PTPN1’ ‘RB1’ ‘SM AD1’ ‘SM AD4’ ‘SP1’ ‘TP53’ ‘UBE2Z’ Positiv e r
egulation of cel
-lular biosynthetic pr
ocess
(GO:0031328) (7.8E–37)
Nuclear lumen (GO:0031981) (3.0E–27)
Transcr iption r egula -tor ac tivit y (1.7E–30) (GO:0030528) Path wa
ys in cancer(2.6E–30)
10
39
FO
XO
–SM
AD complex (60),
EEF1A1–MDH2–
W
ARS
complex (66.67), CDH1– CTNNB1–PTPN1 complex (75)
‘CDH2’ ‘C TNNB1’ ‘EEF1A1’ ‘FO XO1’ ‘FO XO3’ ‘SM AD1’ ‘SM AD4’ ‘Y WHA G ’ Cell c ycle ( GO:0007049) (1.2E–30) Nucleoplasm ( GO:0005654) (8.8E–59) Transcr iption fac tor binding ( GO:0008134) (1.5E–25) Cell c ycle (1.6E–18) 11 40 ERBB2IP –ZFY VE9 containing
complex, p300–MDM2– p53 pr
ot ein complex (72.73), CDK7– cy clin H complex (60) ‘AR ’ ‘BR CA1’ ‘CDK2’ ‘EP300’ ‘ERBB2IP ’ ‘ESR1’ ‘HD A C1’ ‘MDM2’ ‘MNA T1’ ‘SP1’ ‘TBP ’ ‘TP53’ ‘UBE2I ’ Positiv e r
egulation of mac
-romolecule metabolic process (
GO:0010604)
(1.6E–29)
Nuclear lumen(
GO:0031981) (1.3E–19) Transcr iption ac tivat or ac tivit y ( GO:0016563) (3.2E–14) Path wa
ys in cancer(3.3E–16)
12
10
CDK7–
cy
clin H complex
(80), CASP8–M
APK1–
M
APK3–PEA15–RPS6K
A3
complex (80), ITPR1– STARD13–
TXNDC4 com
-plex (66.67), PIN1–
TP53 complex(66.67) ‘AR ’ ‘CASP8’ ‘CDK2’ ‘CDK7’ ‘HMGB1’ ‘ITPR1’ M APK1’ ‘M APK3’ ‘MDM2’ ‘MNA T1’ ‘PEA15’ ‘PIN1’ ‘TP53’ ‘TP73’ Positiv e r
egulation of gene
expr ession ( GO:0010628) (1.0E–23) Transcr iption fac tor complex ( GO:0005667) (9.8E–13) Enz yme binding (GO:0019899) (9.7E–21) Path wa
ys in cancer (7.0E–26)
13 51 HSP A1A– TP53 complex (100), A TXN1– C1or f94– D AZ AP2–RBP MS–UBQLN4
containing complex (66.67), p300–MDM2–p53 prot
ein complex (80)
‘A TXN1’ ‘BA T2’ ‘BR CA1’ ‘D AZ AP2’ ‘EP300’ ‘ERBB2IP ’ ‘ESR1’ ‘HD A C1’ ‘HSP A1A ’ ‘MDM2’ ‘SP1’ ‘TBP ’ ‘TP53’ ‘UBE2I ’ ‘UBQLN4’ Positiv e r
egulation of cel
-lular biosynthetic pr
ocess (GO:0031328) (4.7E–32) Nucleoplasm ( GO:0005654) (1.7E–28) Transcr iption r egulat or ac tivit y ( GO:0030528) (3.2E–20) Path wa
ys in cancer (4.2
E–24) 14 3 CDH1– C TNNB1–PTPN1
complex (75), EEF1A1– MDH2–
W ARS com -plex(66.67) ‘CDH2’ ‘C TNNB1’ ‘EEF1A1’ ‘PTPN1’ ‘Y WHA G ’ Positiv e r
egulation of mac
-romolecule metabolic process (
Table 4 c on tinued Sl .No . Clust er id Pr edic ted c omple x (% of pr ot eins c ov er ed) M at ched pr ot eins GO -t erm (bp ) GO -t erm ( CC ) GO -t erm (mf ) KEGG pa th w ay 15 38 COP9 sig nalosome ( CSN) (70), mutant p53/NF-Y pr ot ein (mutp53/NF-Y ) complex (66.67), TP53– TP73 complex (66.67), HSPB1–PP A1– PP A1–SE TDB1– TP53– WIPI1 complex (66.67) ‘C OPS3’ ‘C OPS4’ ‘C OPS5’ ‘C OPS6’ ‘C OPS7A ’ ‘C OPS8’ ‘CREBBP ’ ‘EP300’ ‘GPS1’ ‘NFY A’ ‘PP A1’ ‘SM AD3’ ‘SP1’ ‘TP53’ ‘TP73’ ‘W T1’ Positiv e r
egulation of nitr
o-gen compound metabolic process (
GO:0051173) (6.9E–22) Cyt osol ( GO:0005829) (1.4E–10) Enz yme binding (GO:0019899) (2.8E–18) Path wa
ys in cancer (7.0E–20)
16 21 MDM2–P ML –P ML –SUMO1–
SUZ12 complex (80), SUMO1 ac
tivation complex
(66.67), p300–MDM2–p53 prot
ein complex (80)
‘AR ’ ‘BR CA1’ ‘D A XX’ ‘EP300’ ‘ESR1’ ‘HD A C1’ ‘MDM2’ ‘PIAS1’ ‘P ML ’ ‘RB1’ ‘SP1’ ‘SUMO1’ ‘TP53’ ‘UBE2I ’ Positiv e r
egulation of tran
-scr
iption (5.7E–34)
Or
ganelle lumen (GO:0043233) (8.3E–34)
Transcr iption r egulat or ac tiv -ity ( GO:0030528) (4.9E–39) Path wa
ys in cancer (3.9E–21)
17
30
CDH1–
C
TNNB1–PTPN1
complex (75), PKD1–PKD2 complex (66.67), EEF1A1– MDH2–
W ARS complex (66.67) ‘CDH2’ ‘C TNNB1’ ‘EEF1A1’ ‘PKD1’ ‘PTPN1’ ‘Y WHA G ’ Positiv e r
egulation of nitr
o-gen compound metabolic process (
GO:0051173) (1.0E–17) Cell pr ojec tion ( GO:0042995) (9.0E–8) Enz yme binding (GO:0019899) (2.1E–13) A dher ens junc tion (1.5E–18) 18 13 TP53–
TP73 complex (66.67),
p300–MDM2–p -53 pr ot ein complex (72.73) ‘BR CA1’ ‘CREBBP ’ ‘EP300’ ‘ESR1’ ‘HD A C1’ ‘MDM2’ ‘SP1’ ‘TBP ’ ‘TP53’ ‘TP73’ ‘W T1’ Positiv e r
egulation of cel
-lular biosynthetic pr
ocess
(GO:0031328) (3.1E–25)
Nuclear lumen (7.3E–24)
Transcr iption r egulat or ac tiv -ity ( GO:0030528) (2.2E–24) Pr ostat
Association of predicted complexes in disorders/diseases Here, we discuss the involvement of predicted protein complexes in different disease/disorder classes. The list of disorders/diseases, disorder associated genes and association between genes and disorder/disease classes are obtained from Goh et al. [23]. In Goh et al., a clas-sification of disorders can be found depending on the physiological system affected by the disorder. They have classified all genetic disorders in 22 primary classes and associated all the genes corresponding to all the disor-ders. In each class there is a list of disorders/diseases that exhibit similar type of clinical features affected by these disorders. Here, we find an association of our predicted complexes with these 22 disorder/disease classes. To test the biological plausibility of the identified complexes we draw a bipartite network between protein complexes and 22 disorders/diseases to find disease associated com-plexes. We have also tested the involvement of proteins belonging to our predicted complexes in those disorders.
Involvement of identified complexes in 22 primary disorders/ disease classes
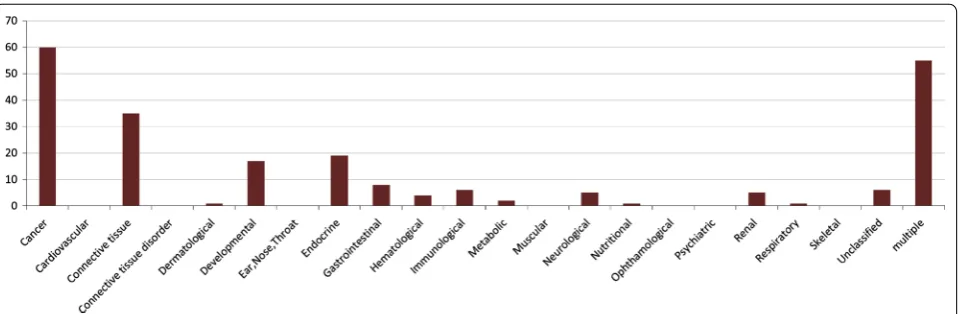
To show to what extent the proteins of our predicted complexes are involved in specific disorder/disease
classes we plot a bar diagram showing the proportion of protein complexes involved in each of the disorder classes. We assume that a protein complex is associated with specific type of disorder if all the proteins associated with this disorder are belonging to that protein complex. The bar diagram is shown in Fig. 4. From this figure we can notice that subsequent number of protein complexes are associated with ‘cancer’ and ‘multiple’ disease classes. ‘Cancer’ class consists of 113 disorders whereas ‘multiple’ class contains 155 disorders. The disorders are assigned in each class based on the similarity of clinical properties of these disorders and the observation of physiological system mostly affected by those disorders. Disorders hav-ing multiple clinical features are placed in the ‘multiple’ class.
We observe from Fig. 4 that most of the predicted com-plexes are enriched with proteins that are implicated by different disorders involved with ‘cancer’ and ‘multiple’ disorder classes. Some proteins of our predicted com-plexes are also involved in the disorders associated with ‘connective tissue’, ‘Developmental’ and ‘Endocrine’ classes. We have been able to associate the predicted complexes with 15 classes of disorders amongst 22 disor-der classes.
Fig. 3 Bar diagram showing the proportion of proteins in predicted clusters that are involved in some real protein complexes.
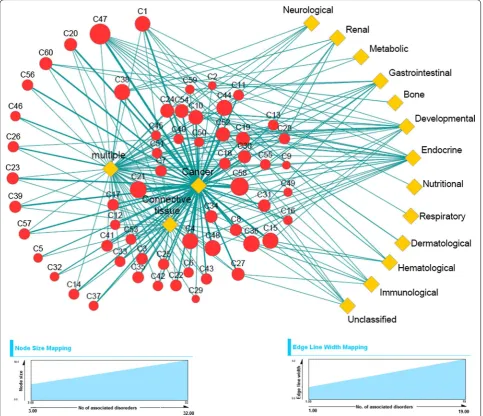
Complex–disease bipartite network
To identify the overall association between predicted complexes and disease classes we have created a bipar-tite network between predicted protein complexes and the associated disease classes. One partite set consti-tutes the complexes, whereas other partite set repre-sents the associated disease classes. Each partite set is connected with other by edges depending on the asso-ciation between predicted complexes and the disorders involved in disease classes. The network is shown in Fig. 5. The predicted complexes are represented by red nodes whereas the disease classes are denoted by yellow diamond shaped nodes. It is possible that several proteins
in one complex are involved in several disorders belong-ing to different disease classes. So, we have calculated the number of disorders associated with each predicted complex. We say a disorder is associated with a predicted complex if all the proteins associated with that disorder is involved in that complex. To show to what extent the protein complexes are associated with disorders we vary the size of red nodes based on the total number of disor-ders associated with those complexes. An edge between a complex and a disease class indicates the association of disorders belonging to the disease class with that com-plex. Edge width indicates the number of associated dis-orders with the corresponding complex and disease class
Fig. 5 Bipartite network showing the association of predicted complexes and 16 disease classes. The red nodes represent predicted complexes and
yellow diamond shaped nodes denote disease classes. Size of complex nodes are varied according to the number of associated disorders involved
linked by that edge. It appears from Fig. 5 that most of the complexes are associated with significant number of disorders belonging to different disease classes. Interest-ingly it is found that all the complexes are more or less associated with ‘cancer’ related disorders. It suggests that the predicted complexes are enriched with proteins that are involved in different cancer related disorders and may be considered as important candidates to uncover differ-ent associations for understanding disease mechanisms, diagnosis and therapy. Other disorders like ‘Connective tissue’, ‘multiple’ and ‘Endocrine’ also show reasonable amount of association with different complexes. In Addi-tional file 3 the processed data for constructing the com-plex–disease bipartite network are given.
We have also performed an analysis to describe the association among protein complexes and disease classes. For this purpose, we have collected PPI information and GO based semantic similarity information of all the genes associated with 22 disease classes. The PPI and GO semantic similarity informations are subsequently con-verted into 22 PPI and GO semantic similarity networks.
We have computed density and average semantic simi-larity scores from these networks and showed in Table 5. First and second column of the table represent disease category and number of associated genes in it, respec-tively. The third column shows number interactions
among the genes, in each category. The last two col-umns represent density and average semantic similarity score of interaction network. It is noticeable that among all disease classes cancer associated proteins have better score than others. The predicted complexes are function-ally similar, and it may be a possible reason for the over-representation of cancer associated genes in predicted complexes. For the similar reason, other disorders like ‘Connective tissue’, ‘multiple’ and ‘Endocrine’ have better amount of association with different complexes.
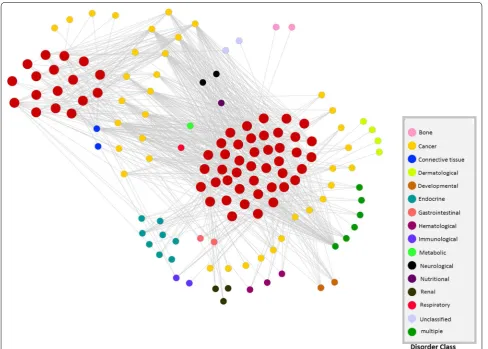
To identify the association among disorders and pro-tein complexes, we have also created another bi-partite network. As depicted in Fig. 6, the network is composed of two types of nodes. The big red nodes represent pre-dicted complexes and small nodes stand for different dis-orders. Out of 22 disease classes we have found 16 classes have different disorders associated with the predicted complexes. In Additional file 4: Table S1 we have listed all the disorder names associated with specific com-plexes. 1st column of the Table S1 (Additional file 4) rep-resents predicted protein complex, whereas the second and third columns represent the associated disorders and the corresponding disease class. From this table we can notice that the proteins in complex 1 is associated with 11 ‘cancer’ associated disorders, 3 hematological disor-ders, 1 ‘Endocrine’, ‘Connective tissue’, and ‘Immunology’
Table 5 Some useful metrics of disorder associated genes
Disease category No. of associated genes No. of interaction in human PPI Density Semantic similarity
Bone 180 94 0.0163 0.5676
Cancer 869 725 0.0019 0.8931
Cardiovascular 332 457 0.0083 0.7374
Connective_tissue 149 75 0.0068 0.7146
Dermatological 270 154 0.0042 0.6381
Developmental 143 219 0.0216 0.7589
Ear, nose, throat 177 183 0.0117 0.8277
Endocrine 305 572 0.0123 0.8432
Gastrointestinal 110 52 0.0087 0.5819
Hematological 389 755 0.0100 0.6449
Immunological 290 658 0.0157 0.8159
Metabolic 638 2,088 0.0103 0.7458
Muscular 294 1,183 0.0275 0.6421
Neurological 917 898 0.0021 0.7811
Nutritional 51 82 0.0643 0.6536
Ophthalmological 563 555 0.0037 0.7035
Psychiatric 75 49 0.0177 0.7032
Renal 170 131 0.0091 0.6545
Respiratory 79 1 0.00032 0.7023
Skeletal 278 186 0.0048 0.6679
Unclassified 64 6 0.0030 0.5080
related disorders. All the proteins implicated by those disorders are clustered in complex 1. This suggests that these associated disorders of different disease classes are loosely related with each other. For example ‘Leuke-mia, acute promyelocytic disorder’ may be developed by a long course of ‘Polycythemia vera’ which is associ-ated with ‘Hematological’ disorders [33, 34]. From the Table S1 (Additional file 4) we can notice that the disor-der ‘Pilomatricoma’ which belongs to the ‘Cancer’ dis-ease class and the disorder ‘Rubinstein–Taybi syndrome’ related to the ‘multiple’ disease class are involved in com-plex 1. In [35] an abnormal association between multiple perforating and non-perforating pilomatricomas with Rubinstein–Taybi syndrome are reported. From Table S1 (Additional file 4) it can also be observed that the dis-order ‘Thrombocythemia, essential’ involved in ‘Hema-tology’ disease class is grouped with disorder ‘Renal cell carcinoma’ belonging to ‘Cancer’ disease class in complex 1. This suggests that these two disorders are somehow related based on topological and ontological properties
of the proteins that are directly associated with those dis-orders. It is because all the proteins implicated by these two disorders are grouped in the same complex. Inter-estingly in [36] a statistical correlation is also observed between essential Thrombocythemia and the survival of surgically treated renal cell carcinoma patients.
in many cases it is reported that it causes ‘Hyperparathy-roidism’ [38, 39]. ‘Rabson–Mendenhall syndrome’ in ‘mul-tiple’ disease class is a rare genetic disorder mainly caused by mutation of insulin receptor gene ‘INSR’. It appears from the Table S1 (Additional file 4) that this disorder is associated with about eight predicted complexes. Most of these associated complexes also contain other disorders which are belonging to different disease classes and are linked with extreme insulin resistance due to mutations in the insulin receptor gene ‘INSR’. For example complex C7 is associated with disorder ‘Leprechaunism’ [commonly known as Donohue syndrome (OMIM 246200)] which is a latent inherited disorder and is caused by defect of insulin receptor genes. This suggests that although the disorders ‘Rabson–Mendenhall syndrome’ and ‘Leprechaunism’ are belonging to different disease classes but the genes respon-sible for these disorders exhibit substantial amount of similar functional information. The possible reason behind this is that these two disorders show strong inclination in being grouped in most of the complexes.
In most of the cases we observe that similar type of disorders have a tendency to get involve in same protein complexes. So we can conclude that protein complexes not only provide a better understanding in molecular evolution but it can also unveil several information of human disorders and uncover new strategies for thera-peutic intervention. This may lead to development of new potential strategies to deal with key diseases by giving more importance in protein complex formation informa-tion rather than targeting individual proteins.
Conclusions
This study introduces a multiobjective approach for detection of protein complexes in human PPI network. Integrating topological features along with GO features, we are able to group functionally similar proteins in same clusters which serve as protein complexes. The algo-rithm progresses with two primary classes of objectives. Graph based objectives preserve the topological proper-ties of complexes whereas GO based semantic similarity between protein pairs control the accumulation of func-tionally similar proteins in the same cluster. Moreover the predicted complexes show consistently better result in context of some performance metrics.
We have also built an association between predicted protein complexes and 22 primary key disease classes to study the relationship between complexes and disorders associated with these classes. For finding the associa-tion of predicted complexes in different disease classes, we have extensively searched the involvement of proteins implicated by different disorders in the predicted plexes and built two bipartite networks between com-plexes and disorders. Interestingly, we have found most
of the predicted complexes are associated with disorders belonging to the ‘Cancer’ disease class. Additionally, the disorders belonging to ‘Endocrine’ and ‘multiple’ disease classes have also shared a significant proportion of pro-teins involved in multiple predicted complexes.
Protein complexes are now considered as potential tar-gets for intervention of new therapeutics to treat against new diseases. It is possible to integrate the drug–disease association information along with the complex–disease association. The new paradigm in drug discovery analy-sis is now given emphaanaly-sis on the polypharmacological properties of drugs. Polypharmacological drugs are gen-erally targets multiple cellular function for the treatment of complex diseases. By incorporating protein complexes with drug–disease association, it may be possible to uncover some relationship between protein complexes and targeted drugs.
Moreover we can potentially merge the time series gene expression profiles affected by a specific disease with our complex–disease bipartite network structure. This can offer a new way to exploit new topological features and complex modular structure in protein complex–disease and protein complex–disease–drug network. We are now working in this direction.
Authors’ contributions
SR did the initial planning and collected the dataset. AM and SR performed the data processing, developed the code, performed the analysis, and drafted the manuscript. SB and UM provided constructive discussion, corrected the manuscript, and supervised the complete work. All authors read and approved the final manuscript.
Author details
1 Machine Intelligence Unit, Indian Statistical Institute, Kolkata 700108, West Bengal, India. 2 Department of Computer Science and Engineering, Aliah Uni-versity, Kolkata 700156, West Bengal, India. 3 Department of Computer Science and Engineering, University of Kalyani, Kalyani 741235, West Bengal, India. 4 Department of Computer Science and Engineering, Jadavpur University, Kolkata 700032, West Bengal, India.
Acknowledgements
AM gratefully acknowledges the support from DST PURSE scheme.
Compliance with ethical guidelines
Competing interests
The authors declare that they have no competing interests. Additional files
Additional file 1. The human protein–protein interaction data.
Additional file 2. The source code of the proposed methodology.
Additional file 3. The processed data for constructing complex-disease bipartite network and ROC plot.
Received: 3 December 2014 Accepted: 28 July 2015
References
1. Mirny L, Spirin V (2003) Protein complexes and functional modules in molecular networks. Proc Natl Acad Sci 100(21):12123–12128 2. Altaf-Ul-Amin M, Shinbo Y, Mihara K, Kurokawa K, Kanaya S (2006)
Devel-opment and implementation of an algorithm for detection of protein complexes in large interaction networks. BMC Bioinform 7:207 3. Brohee S, van Helden J (2006) Evaluation of clustering algorithms for
protein–protein interaction networks. BMC Bioinform 7:471–488 4. Pereira-Leal JB, Enright AJ, Ouzounis CA (2004) Detection of functional
modules from protein interaction networks. Proteins 54:49–57 5. Bader G, Hogue C (2003) An automated method for finding
molecu-lar complexes in molecu-large protein interaction networks. BMC Bioinform 4:1471–2105
6. Nepusz T, Yu H, Paccanaro A (2012) Detecting overlapping protein complexes from protein–protein interaction networks. Nat Methods 9:471–472
7. Frey BJ, Dueck D (2007) Clustering by passing messages between data points. Science 315:972–976
8. Mukhopadhyay A, Ray S, De M (2012) Detecting protein complexes in a PPI network: a gene ontology based multi-objective evolutionary approach. Mol Biosyst 8(11):3036–3048
9. Zhao J, Lee S, Huss M, Holme P (2012) The network organization of cancer-associated protein complexes in human tissues. Nature Scientific Reports. doi:10.1038/srep01583
10. Lea D, Uyb N, Dungc P, Binhc H, Kwond Y (2013) Towards the identifi-cation of disease associated protein complexes. Proced Comput Sci 23:15–23
11. Vanunu O, Magger O, Ruppin E, Shlomi T, Sharan R (2010) Associating genes and protein complexes with disease via network propagation. PLoS Comput Biol. doi: 10.1371/journal.pcbi.1000641
12. Huang D, Sherman B, Tan Q, Collins J, Alvord W, Roayaei J et al (2007) The david gene functional classification tool: a novel biological module-centric algorithm to functionally analyze large gene lists. Genome Biol 8(9):183
13. Schlicker A, Domingues F, Rahnenfuhrer J, Lengauer T (2006) A new measure for functional similarity of gene products based on gene ontol-ogy. BMC Bioinform 7:302
14. Deb K, Pratap A, Agrawal S, Meyarivan T (2002) A fast and elitist multiob-jective genetic algorithm: NSGA-II. IEEE Trans Evol Comput 6:182–197 15. Deb K (2001) Multi-objective optimization using evolutionary algorithms.
John Wiley and Sons Ltd, England
16. Bandyopadhyay S, Mukhopadhyay A, Maullik U (2011) Multiobjective genetic algorithms for clustering—applications in data mining and bioinformatics. Springer, Berlin, Heidelberg. ISBN 978-3-642-16614-3 17. Peri S, Navarro J, Kristiansen T, Amanchy R, Surendranath V, Muthusamy B
et al (2004) Human protein reference database as a discovery resource for proteomics. Nucleic Acids Res 32:497–501
18. Leung H, Xiang Q, Yiu S, Chin F (2009) Predicting protein complexes from PPI data: a core-attachment approach. J Comput Biol 16(2):133–144 19. Wu M, Xiaoli L, Chee-Keong K, See-Kiong N (2009) A core-attachment
based method to detect protein complexes in ppi networks. BMC Bioin-form 10(169):10–11861471210510169
20. King AD, Przulj N, Jurisica I (2004) Protein complex prediction via cost-based clustering. Bioinformatics 20:3013–3020
21. Srihari S, Ning K, Leong HW (2010) MCL-CAw: a refinement of mcl for detecting yeast complexes from weighted ppi networks by incorporating core-attachment structure. BMC Bioinform 11(504):10–11861471210511504
22. Zaki N, Efimov D, Berengueres J (2013) Protein complex detection using interaction reliability assessment and weighted clustering coefficient. BMC Bioinform 4(163):10–11861471210514163
23. Goh K, Cusick M, Valle D, Childs B, Vidal M, Barabasi A (2007) The human disease network. PNAS 104:8685–8690
24. Prelic A (2006) A systematic comparison and evaluation of biclustering methods for gene expression data. Bioinformatics 22:1122–1129 25. Wang H, Azuaje F, Bodenreider O, Dopazo J (2004) Gene expression
cor-relation and gene ontology-based similarity: an assessment of quantita-tive relationships. In: Proceedings of IEEE symposium on computational intelligence in bioinformatics and computational biology, pp 25–31 26. Kikugawa S, Nishikata K, Murakami K, Sato Y, Suzuki M, Altaf-Ul-Amin M
et al (2012) Pcdq: human protein complex database with quality index which summarizes different levels of evidences of protein complexes predicted from h-invitational protein-protein interactions integrative dataset. BMC Syst Biol 6:7
27. Brohee S, van Haden J (2006) Evaluation of clustering algorithms for protein--protein interaction networks. BMC Bioinform 7:488
28. Takada I, Kouzmenko A, Kato S (2009) Wnt and PPAR gamma signaling in osteoblastogenesis and adipogenesis. Nat Rev Rheumatol 5(8):442–7 29. Najdi R, Holcombe R, Waterman M (2011) Wnt signaling and colon
carcinogenesis. J Carcinog 10:5. doi:10.4103/1477-3163.78111
30. Bienz M, Clevers H (2000) Linking colorectal cancer to wnt signaling. Cell 103:311–320
31. Giles RH, van Es JH, Clevers H (2003) Caught up in a wnt storm: wnt signaling in cancer. Biochim Biophys Acta 1653(1):1–24
32. Moustakas A, Souchelnytskyi S, Heldin C (2001) Smad regulation in tgf-β signal transduction. J Cell Sci 114:4359–4369
33. Kajiguchi T, Simokawa T, Saito M, Takeyama H (2000) Transformation of polycythemia vera to acute promyelocytic leukemia. Int J Hematol 4(72):520–521
34. Kuno Y, Takeo T, Kawashima K (1997) Cd7+, cd34+, electronmicroscopi-cally peroxidase-negative acute leukemia transformed from poly-cythemia vera after 12 years follow-up. Jpn J Clin Hematol 97(38):782–787 35. Bayle P, Bazex J, Lamant L, Lauque D, Durieu C, Albes B (2004) Multiple
perforating and non perforating pilomatricomas in a patient with Churg– Strauss syndrome and Rubinstein–Taybi syndrome. J Eur Acad Dermatol Venereol 5(18):607–610
36. Seda C, Salas A, Sanchez C, Blasco J, Garcia I, Sanchez J et al (2011) Throm-bocytosis and hematocrit as prognostic factors in renal carcinoma. Arch Esp Urol 64(9):883–890
37. Kawamura Y, Kazama S, Miyahara T, Masaki T, Muto T (1999) Sigmoid colon cancer associated with primary hyperparathyroidism: report of a case. Surg Today 29(8):789–790
38. Micale S, Kane M, Busch R (2012) Spontaneous resolution of primary hyperparathyroidism in parathyroid adenoma. Case Rep Endocrinol 10:793753
39. Wei B, Shen H, Wang J, Xing X, Tong G, Chang H et al (2012) Surgical treatment of hyperparathyroidism due to parathyroid tumors. Chin J Otorhinolaringol 47(10):861–4
Submit your next manuscript to BioMed Central and take full advantage of:
• Convenient online submission
• Thorough peer review
• No space constraints or color figure charges
• Immediate publication on acceptance
• Inclusion in PubMed, CAS, Scopus and Google Scholar
• Research which is freely available for redistribution