Case 9 Chr. 17
D
Case 11 Chr. 11C
Case 18 Chr. 15q15.1B
Case 16 Chr. 17p13.1E
Case 21 Chr. 17Log2 rat
S-log
2
AP
TP53
MGA
Log2 rat
io
L
og2 rat
io
Log2 rat
io
Log2 rat
io
S
-log
2
S
-log
2
S
-log
2 S-log
2
Log2 ratio
MGA
Log2 rat
io
Log2 rat
io
Log2 rat
io
TP53
Identification of prognostic relevant chromosomal
abnormalities in chronic lymphocytic leukemia
using microarray-based genomic profiling
Stevens-Kroef
et al.
R E S E A R C H
Open Access
Identification of prognostic relevant chromosomal
abnormalities in chronic lymphocytic leukemia
using microarray-based genomic profiling
Marian JPL Stevens-Kroef
1*, Eva van den Berg
2, Daniel Olde Weghuis
1, Ad Geurts van Kessel
1, Rolph Pfundt
1,
Matty Linssen-Wiersma
1, Marloes Benjamins
2, Trijnie Dijkhuizen
2, Patricia JTA Groenen
3and Annet Simons
1Abstract
Background:Characteristic genomic abnormalities in patients with B cell chronic lymphocytic leukemia (CLL) have been shown to provide important prognostic information. Fluorescencein situhybridization (FISH) and multiplex ligation-dependent probe amplification (MLPA), currently used in clinical diagnostics of CLL, are targeted tests aimed at specific genomic loci. Microarray-based genomic profiling is a new high-resolution tool that enables genome-wide analyses. The aim of this study was to compare two recently launched genomic microarray platforms, i.e., the CytoScan HD Array (Affymetrix) and the HumanOmniExpress Array (Illumina), with FISH and MLPA to ascertain whether these latter tests can be replaced by either one of the microarray platforms in a clinical diagnostic setting.
Result:Microarray-based genomic profiling and FISH were performed in all 28 CLL patients. For an unbiased comparison of the performance of both microarray platforms 9 patients were evaluated on both platforms, resulting in the identification of exactly identical genomic aberrations. To evaluate the detection limit of the microarray platforms we included 7 patients in which the genomic abnormalities were present in a relatively low percentage of the cells (range 5-28%) as previously determined by FISH. We found that both microarray platforms allowed the detection of copy number abnormalities present in as few as 16% of the cells. In addition, we found that microarray-based genomic profiling allowed the identification of genomic abnormalities that could not be detected by FISH and/or MLPA, including a focalTP53loss and copy neutral losses of heterozygosity of chromosome 17p.
Conclusion:From our results we conclude that although the microarray platforms exhibit a somewhat lower limit of detection compared to FISH, they still allow the detection of copy number abnormalities present in as few as 16% of the cells. By applying similar interpretation criteria, the results obtained from both platforms were
comparable. In addition, we conclude that both microarray platforms allow the identification of additional potential prognostic relevant abnormalities such as focalTP53deletions and copy neutral losses of heterozygosity of
chromosome 17p, which would have remained undetected by FISH or MLPA. The prognostic relevance of these novel genomic alterations requires further evaluation in prospective clinical trials.
Keywords:Chronic lymphocytic leukemia, Microarray-based genomic profiling, FISH, MLPA
* Correspondence:[email protected]
1
Department of Human Genetics, Radboud university medical center, P.O. Box 9101, Nijmegen 6500 HB, The Netherlands
Full list of author information is available at the end of the article
Background
B-cell chronic lymphocytic leukemia (CLL) exhibits a highly heterogeneous clinical course, with overall sur-vival rates varying from several months to decades. Whereas several prognostic markers, such as expression of the CD38 and ZAP70 proteins are well-established now, these markers do not allow the identification of all patients with a high risk profile. Mutation status of the
IGHVgenes and specific genomic abnormalities, such as
deletion of 11q22, trisomy of chromosome 12 and loss of the 13q14 region, provide additional prognostic infor-mation [1,2]. In addition, deletion of 17p and/or the
presence of aTP53 mutation, which are both associated
with a poor prognosis, identify CLL patients with the highest risk profile [2]. Conventional cytogenetic ana-lyses result in the identification of genetic abnormalities in a relatively low percentage of patients, due to the low in vitro proliferative potential of CLL cells. Even after recent improvements of this technique, using CpG-oligonucleotide DSP30 and interleukin-2 (IL-2) [3], it still does not allow the detection of submicroscopic losses such as those of the 11q, 13q and 17p regions. The most common molecular-cytogenetic techniques currently used
to detect these abnormalities in CLL are fluorescencein
situ hybridization (FISH) [1] and multiplex
ligation-dependent probe amplification (MLPA) [4]. However, since FISH analysis of multiple loci is relatively labori-ous, and since both FISH and MLPA are targeted tests providing limited views on the genomic landscapes of CLL cells, we aimed to evaluate the diagnostic efficacy of microarray-based whole genome profiling. Next to its genome-wide character, microarray-based genomic pro-filing also allows the detection of small cryptic copy number alterations (CNAs) and copy neutral losses of heterozyogosity (CNLOH) that remain undetected by FISH and MLPA [5,6].
The specific aim of the present study was to compare the CytoScan HD Array platform from Affymetrix and the HumanOmniExpress 12v1 Array platform from Illu-mina on one hand with FISH and MLPA on the other hand by employing the currently used probe panels, tar-geting the chromosome regions 11q22, 13q14 and 17p13 and chromosome 12 for the detection of clinically rele-vant chromosomal abnormalities in CLL. To ascertain which approach would be most suitable in a routine cytogenetic diagnostic setting we also evaluated their limit of detection for the identification of small CLL (sub)clones and their resolution with respect to the de-tection of small focal genomic abnormalities.
Results
Microarray-based identification of genomic abnormalities Microarray-based genomic profiling (12 patients with the CytoScan HD Array platform only; 7 patients with
HumanOmniExpress Array platform; 9 patients on both platforms) was performed on peripheral blood or bone marrow samples from 28 CLL patients (Tables 1 and 2). In 24 of these patients genomic abnormalities (CNAs and CNLOH) were identified by microarray-based pro-filing: 5 cases (cases 2, 8, 14, 26 and 27) showed only one aberration (all involving loss of the 13q14 region or gain of chromosome 12), 5 cases (cases 5, 6, 16, 17 and 24) showed 2 aberrations (9 CNAs and 1 CNLOH), 5 cases (cases 7, 10, 15, 20 and 23) showed 3 aberrations (13 CNAs and 2 CNLOH), and 9 cases (cases 3, 4, 9, 11, 12, 18, 21, 25 and 28) showed more than 3 aberrations (46 CNAs and 3 CNLOH). The remaining 4 cases (1, 13, 19 and 22) showed normal microarray-based genomic profiles.
High limit of detection and resolution of both microarray platforms as compared to FISH and MLPA
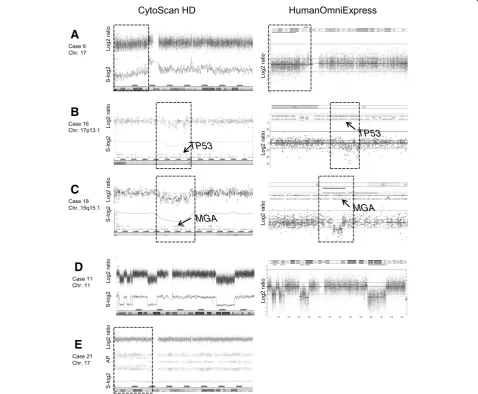
Microarray-based genomic profiling with the CytoScan HD Array and/or the HumanOmniExpress platform were applied to all 28 patients. For an unbiased comparison of the performance of both microarray platforms 9 patients (cases 7, 9, 10, 11, 16, 17, 18, 19 and 20) were evaluated on both microarray platforms in a fully blinded fashion, using identical interpretation criteria (see Methods sec-tion). By doing so, we found that both microarray plat-forms revealed exactly identical genomic aberrations (CNA and CNLOH). For representative examples see Figure 1.
For assessment of the limit of detection of the micro-array platforms, 7 cases (cases 7, 9, 10, 11, 17, 20 and 24) were selected, since in these cases the genomic ab-normalities were present in relatively low percentages of the cells (range 5-28%) as determined by FISH. All ab-normalities present in more than 16% of the cells were readily detected by both microarray platforms, including 3 cases with a trisomy (cases 17 and 24 both with a tri-somy 12 in 21% of the cells, and case 10 with a tritri-somy 8 in 28% of the cells), 3 cases (cases 7, 9 and 10) with loss of 17p in 16% to 21% of the cells (Figure 1A), and case 11 with loss of 13q14 in 28% of the cells. Case 20 was included in this study since 5% of its peripheral blood cells contained a bi-allelic loss of 13q14 as deter-mined by FISH. Using the Cytoscan HD Array platform, this latter 1.7 Mb loss on 13q14 was barely detectable, whereas it was below detection level using the Huma-nOmniExpress Array platform.
For assessment of the resolution of both microarray plat-forms, case 16 was used since this case harbors focal loss
of theTP53gene as determined by MLPA. This loss was
not detected by the FISH probe used, since approximately half of the probe covered a non-deleted segment. Using both microarray platforms we found that the ~350 kb loss
encompassing the TP53 gene could readily be detected
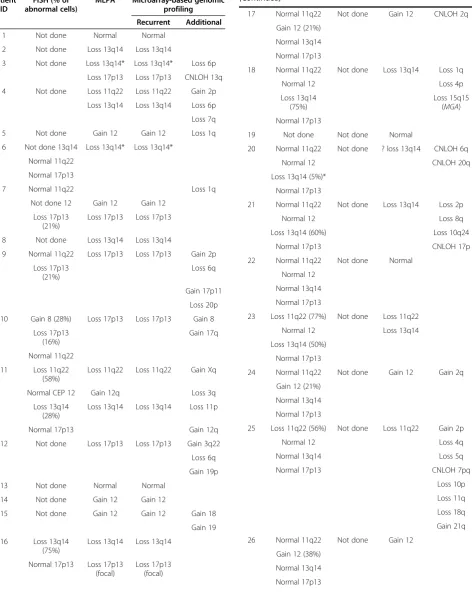
Table 1 Overview of genetic abnormalites as determined by FISH, MLPA and microarray-based genomic profiling
Patient ID
FISH (% of abnormal cells)
MLPA Microarray-based genomic profiling
Recurrent Additional
1 Not done Normal Normal
2 Not done Loss 13q14 Loss 13q14
3 Not done Loss 13q14* Loss 13q14* Loss 6p
Loss 17p13 Loss 17p13 CNLOH 13q
4 Not done Loss 11q22 Loss 11q22 Gain 2p
Loss 13q14 Loss 13q14 Loss 6p
Loss 7q
5 Not done Gain 12 Gain 12 Loss 1q
6 Not done 13q14 Loss 13q14* Loss 13q14*
Normal 11q22
Normal 17p13
7 Normal 11q22 Loss 1q
Not done 12 Gain 12 Gain 12
Loss 17p13 (21%)
Loss 17p13 Loss 17p13
8 Not done Loss 13q14 Loss 13q14
9 Normal 11q22 Loss 17p13 Loss 17p13 Gain 2p
Loss 17p13 (21%)
Loss 6q
Gain 17p11
Loss 20p
10 Gain 8 (28%) Loss 17p13 Loss 17p13 Gain 8
Loss 17p13 (16%)
Gain 17q
Normal 11q22
11 Loss 11q22 (58%)
Loss 11q22 Loss 11q22 Gain Xq
Normal CEP 12 Gain 12q Loss 3q
Loss 13q14 (28%)
Loss 13q14 Loss 13q14 Loss 11p
Normal 17p13 Gain 12q
12 Not done Loss 17p13 Loss 17p13 Gain 3q22
Loss 6q
Gain 19p
13 Not done Normal Normal
14 Not done Gain 12 Gain 12
15 Not done Gain 12 Gain 12 Gain 18
Gain 19
16 Loss 13q14 (75%)
Loss 13q14 Loss 13q14
Normal 17p13 Loss 17p13 (focal)
Loss 17p13 (focal)
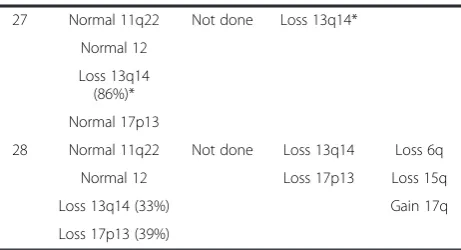
Table 1 Overview of genetic abnormalites as determined by FISH, MLPA and microarray-based genomic profiling (Continued)
17 Normal 11q22 Not done Gain 12 CNLOH 2q
Gain 12 (21%)
Normal 13q14
Normal 17p13
18 Normal 11q22 Not done Loss 13q14 Loss 1q
Normal 12 Loss 4p
Loss 13q14 (75%)
Loss 15q15 (MGA)
Normal 17p13
19 Not done Not done Normal
20 Normal 11q22 Not done ? loss 13q14 CNLOH 6q
Normal 12 CNLOH 20q
Loss 13q14 (5%)*
Normal 17p13
21 Normal 11q22 Not done Loss 13q14 Loss 2p
Normal 12 Loss 8q
Loss 13q14 (60%) Loss 10q24
Normal 17p13 CNLOH 17p
22 Normal 11q22 Not done Normal
Normal 12
Normal 13q14
Normal 17p13
23 Loss 11q22 (77%) Not done Loss 11q22
Normal 12 Loss 13q14
Loss 13q14 (50%)
Normal 17p13
24 Normal 11q22 Not done Gain 12 Gain 2q
Gain 12 (21%)
Normal 13q14
Normal 17p13
25 Loss 11q22 (56%) Not done Loss 11q22 Gain 2p
Normal 12 Loss 4q
Normal 13q14 Loss 5q
Normal 17p13 CNLOH 7pq
Loss 10p
Loss 11q
Loss 18q
Gain 21q
26 Normal 11q22 Not done Gain 12
Gain 12 (38%)
Normal 13q14
Abnormalities identified by microarray-based profiling but not by FISH or MLPA
Sixteen of the 28 patients (57%) carried additional genetic abnormalities (among which focal CNAs and CNLOH), not detected by FISH and/or MLPA. Twenty-four CNAs larger than 5 Mb, outside the loci tested by FISH and/or MLPA, were identified in 12 different cases (cases 3, 4, 7, 9, 10, 11, 12, 15, 21, 24, 25 and 28) (Tables 1 and 2). Al-though the clinical impact of these CNAs still has to be determined, recurrently affected regions such as gain of
the short arm of chromosome 2 including theMYCNgene
(cases 4, 9 and 25), loss of the long arm of chromosome 6 (cases 9, 12 and 28), and gains of chromosomes 18 and 19 (case 15) were noted. In addition, genomic complexity, de-fined as 3 or more >5 Mb CNAs, was observed in 11 cases (cases 3, 4, 7, 9, 10, 11, 12, 15, 21, 25, 28). Focal losses not observed by FISH and/or MLPA and below the level of cytogenetic resolution (<5 Mb), but containing cancer genes listed in (http://cancer.sanger.ac.uk/cancergenome/ projects/census), were identified in 5 cases (cases 9, 16, 18,
21 and 25; Table 2). Case 16 harbors a focal TP53 loss
which was not identified by FISH (see above), but could be identified by MLPA and both microarray platforms (Figure 1B). Of interest, one patient (case 18) was found to harbor a recently identified recurrent loss on chromosome
15q15, which includes theMGAgene (Figure 1C), another
patient (case 21) showed a recurrent loss on chromosome
10q24, which includes the NFKB2 gene [5] and a third
patient (case 25) showed a loss on chromosome 4q31
which encompasses the FBXW7 gene [7]. In addition,
focal CNAs involving the known cancer genesSPECC1,
WHSC1, TPR, FIP1L1, PICALM, ZBTB16, PAFAH1B2,
PCSK7,andCTDP1(cases 9, 18 and 25) were identified.
Since their involvement in CLL has not been reported before, their clinical significance is still unclear.
CNLOH was detected in 5 cases (cases 3, 17, 20, 21 and 25) and was often found to coincide with several
recurrently affected regions in CLL, including 13q14 in case 3 and 17p in case 21 (Figure 1E). Of interest,
in this latter case a homozygous pathogenic TP53
mutation was identified by targeted DNA sequencing (data not shown).
Previously, it has been suggested that the size of the 13q14 deletion may influence the clinical prognosis [8,9], i.e. patients with deletions encompassing the minimally deleted region (MDR) and smaller than <2 Mb in size (Type I deletions) were found to exhibit a better clinical prognosis as compared to patients with larger deletions
often including the RB1 locus (Type II deletions) [9]. A
concomitant advantage of microarray-based genomic pro-filing is that the size of the 13q14 deletion can directly be delineated, whereby cases with Type I and Type II dele-tions can be discerned. In our panel, 7 cases (cases 2, 6, 8, 18, 20, 27 and 28) with a Type I and 6 other cases (cases 3, 4, 11, 16, 21 and 23) with a Type II deletion could be iden-tified in this way (Table 2). In another case (11) we add-itionally observed alternating regions of gains, losses and a normal copy number status involving chromosomes 3 and 11 (Figure 1D), both fulfilling the definition of chromo-thripsis and reflecting genomic instability [10].
Discussion
In the present study we evaluated the efficacy of microarray-based genomic profiling in comparison to routinely applied techniques such as FISH and MLPA in the genetic diagnosis of CLL. One important benefit of microarray-based genomic profiling is its ability to de-tect chromosomal aberrations not dede-tected by routinely used targeted probe-based assays such as FISH and MLPA, but with clinical relevance. Although in the recent past CLL has been studied using a wide range of genomic mi-croarrays [5,6,11-16], these studies were mainly focused on the putative prognostic significance of newly identified genomic alterations. The specific aim of our study was to assess the efficacy of two recently launched high resolution microarray platforms (i.e., CytoScan HD and HumanOm-niExpress) in a clinical diagnostic setting, with special em-phasis on its limit of detection and resolution.
From our results we conclude that both microarray platforms performed equally well with respect to detect-ing genomic alterations (both CNAs and CNLOH). This performance was assessed by applying identical inter-pretation criteria (see Methods section), thereby empha-sizing the importance of applying uniform (international) interpretation criteria, especially when microarray-based genomic profiling will increasingly be used in clinical diag-nostic settings.
Since in a routine clinical diagnostic setting parallel microarray-based assays using matched normal DNAs will not be feasible, we have established stringent inter-pretation criteria based on previous microarray studies
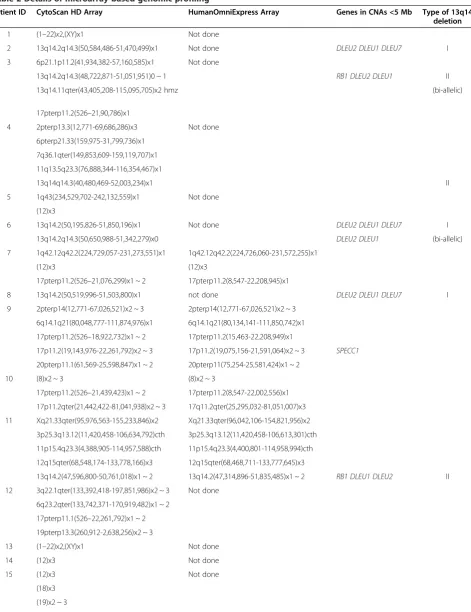
Table 1 Overview of genetic abnormalites as determined by FISH, MLPA and microarray-based genomic profiling (Continued)
27 Normal 11q22 Not done Loss 13q14*
Normal 12
Loss 13q14 (86%)*
Normal 17p13
28 Normal 11q22 Not done Loss 13q14 Loss 6q
Normal 12 Loss 17p13 Loss 15q
Loss 13q14 (33%) Gain 17q
Loss 17p13 (39%)
*Bi-allelic loss as determined by FISH (loss of both hybridization signals), MLPA (RCN below 1) or microarray (log2 ratio below 1).
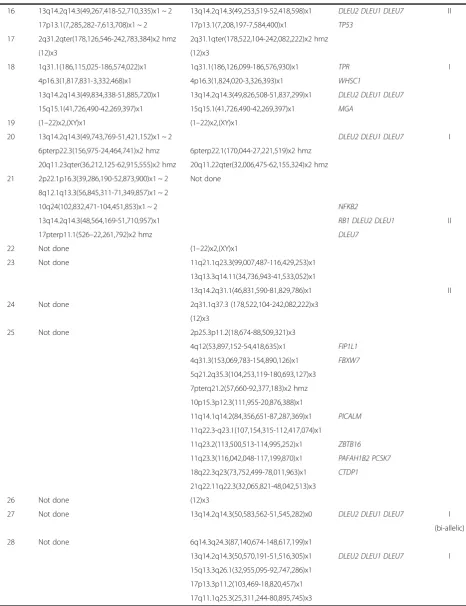
Table 2 Details of microarray-based genomic profiling
Patient ID CytoScan HD Array HumanOmniExpress Array Genes in CNAs <5 Mb Type of 13q14
deletion
1 (1–22)x2,(XY)x1 Not done
2 13q14.2q14.3(50,584,486-51,470,499)x1 Not done DLEU2 DLEU1 DLEU7 I
3 6p21.1p11.2(41,934,382-57,160,585)x1 Not done
13q14.2q14.3(48,722,871-51,051,951)0 ~ 1 RB1 DLEU2 DLEU1 II
13q14.11qter(43,405,208-115,095,705)x2 hmz (bi-allelic)
17pterp11.2(526–21,90,786)x1
4 2pterp13.3(12,771-69,686,286)x3 Not done
6pterp21.33(159,975-31,799,736)x1
7q36.1qter(149,853,609-159,119,707)x1
11q13.5q23.3(76,888,344-116,354,467)x1
13q14q14.3(40,480,469-52,003,234)x1 II
5 1q43(234,529,702-242,132,559)x1 Not done
(12)x3
6 13q14.2(50,195,826-51,850,196)x1 Not done DLEU2 DLEU1 DLEU7 I
13q14.2q14.3(50,650,988-51,342,279)x0 DLEU2 DLEU1 (bi-allelic)
7 1q42.12q42.2(224,729,057-231,273,551)x1 1q42.12q42.2(224,726,060-231,572,255)x1
(12)x3 (12)x3
17pterp11.2(526–21,076,299)x1 ~ 2 17pterp11.2(8,547-22,208,945)x1
8 13q14.2(50,519,996-51,503,800)x1 not done DLEU2 DLEU1 DLEU7 I
9 2pterp14(12,771-67,026,521)x2 ~ 3 2pterp14(12,771-67,026,521)x2 ~ 3
6q14.1q21(80,048,777-111,874,976)x1 6q14.1q21(80,134,141-111,850,742)x1
17pterp11.2(526–18,922,732)x1 ~ 2 17pterp11.2(15,463-22,208,949)x1
17p11.2(19,143,976-22,261,792)x2 ~ 3 17p11.2(19,075,156-21,591,064)x2 ~ 3 SPECC1
20pterp11.1(61,569-25,598,847)x1 ~ 2 20pterp11(75,254-25,581,424)x1 ~ 2
10 (8)x2 ~ 3 (8)x2 ~ 3
17pterp11.2(526–21,439,423)x1 ~ 2 17pterp11.2(8,547-22,002,556)x1
17p11.2qter(21,442,422-81,041,938)x2 ~ 3 17q11.2qter(25,295,032-81,051,007)x3
11 Xq21.33qter(95,976,563-155,233,846)x2 Xq21.33qter(96,042,106-154,821,956)x2
3p25.3q13.12(11,420,458-106,634,792)cth 3p25.3q13.12(11,420,458-106,613,301)cth
11p15.4q23.3(4,388,905-114,957,588)cth 11p15.4q23.3(4,400,801-114,958,994)cth
12q15qter(68,548,174-133,778,166)x3 12q15qter(68,468,711-133,777,645)x3
13q14.2(47,596,800-50,761,018)x1 ~ 2 13q14.2(47,314,896-51,835,485)x1 ~ 2 RB1 DLEU1 DLEU2 II
12 3q22.1qter(133,392,418-197,851,986)x2 ~ 3 Not done
6q23.2qter(133,742,371-170,919,482)x1 ~ 2
17pterp11.1(526–22,261,792)x1 ~ 2
19pterp13.3(260,912-2,638,256)x2 ~ 3
13 (1–22)x2,(XY)x1 Not done
14 (12)x3 Not done
15 (12)x3 Not done
(18)x3
Table 2 Details of microarray-based genomic profiling(Continued)
16 13q14.2q14.3(49,267,418-52,710,335)x1 ~ 2 13q14.2q14.3(49,253,519-52,418,598)x1 DLEU2 DLEU1 DLEU7 II
17p13.1(7,285,282-7,613,708)x1 ~ 2 17p13.1(7,208,197-7,584,400)x1 TP53
17 2q31.2qter(178,126,546-242,783,384)x2 hmz 2q31.1qter(178,522,104-242,082,222)x2 hmz
(12)x3 (12)x3
18 1q31.1(186,115,025-186,574,022)x1 1q31.1(186,126,099-186,576,930)x1 TPR I
4p16.3(1,817,831-3,332,468)x1 4p16.3(1,824,020-3,326,393)x1 WHSC1
13q14.2q14.3(49,834,338-51,885,720)x1 13q14.2q14.3(49,826,508-51,837,299)x1 DLEU2 DLEU1 DLEU7
15q15.1(41,726,490-42,269,397)x1 15q15.1(41,726,490-42,269,397)x1 MGA
19 (1–22)x2,(XY)x1 (1–22)x2,(XY)x1
20 13q14.2q14.3(49,743,769-51,421,152)x1 ~ 2 DLEU2 DLEU1 DLEU7 I
6pterp22.3(156,975-24,464,741)x2 hmz 6pterp22.1(170,044-27,221,519)x2 hmz
20q11.23qter(36,212,125-62,915,555)x2 hmz 20q11.22qter(32,006,475-62,155,324)x2 hmz
21 2p22.1p16.3(39,286,190-52,873,900)x1 ~ 2 Not done
8q12.1q13.3(56,845,311-71,349,857)x1 ~ 2
10q24(102,832,471-104,451,853)x1 ~ 2 NFKB2
13q14.2q14.3(48,564,169-51,710,957)x1 RB1 DLEU2 DLEU1 II
17pterp11.1(526–22,261,792)x2 hmz DLEU7
22 Not done (1–22)x2,(XY)x1
23 Not done 11q21.1q23.3(99,007,487-116,429,253)x1
13q13.3q14.11(34,736,943-41,533,052)x1
13q14.2q31.1(46,831,590-81,829,786)x1 II
24 Not done 2q31.1q37.3 (178,522,104-242,082,222)x3
(12)x3
25 Not done 2p25.3p11.2(18,674-88,509,321)x3
4q12(53,897,152-54,418,635)x1 FIP1L1
4q31.3(153,069,783-154,890,126)x1 FBXW7
5q21.2q35.3(104,253,119-180,693,127)x3
7pterq21.2(57,660-92,377,183)x2 hmz
10p15.3p12.3(111,955-20,876,388)x1
11q14.1q14.2(84,356,651-87,287,369)x1 PICALM
11q22.3-q23.1(107,154,315-112,417,074)x1
11q23.2(113,500,513-114,995,252)x1 ZBTB16
11q23.3(116,042,048-117,199,870)x1 PAFAH1B2 PCSK7
18q22.3q23(73,752,499-78,011,963)x1 CTDP1
21q22.11q22.3(32,065,821-48,042,513)x3
26 Not done (12)x3
27 Not done 13q14.2q14.3(50,583,562-51,545,282)x0 DLEU2 DLEU1 DLEU7 I
(bi-allelic)
28 Not done 6q14.3q24.3(87,140,674-148,617,199)x1
13q14.2q14.3(50,570,191-51,516,305)x1 DLEU2 DLEU1 DLEU7 I
15q13.3q26.1(32,955,095-92,747,286)x1
17p13.3p11.2(103,469-18,820,457)x1
17q11.1q25.3(25,311,244-80,895,745)x3
performed on several types of hematological malignan-cies [17-19]. These interpretation criteria are set in such a way that non-tumor-related copy number variants and CNLOH are excluded. Only gross CNAs (>5 Mb) and CNLOH (>25 Mb) or those extending to the telomeres were considered as tumor-associated abnormalities. Focal CNAs were only considered when they encom-passed (a) known tumor-related gene(s). In addition, we excluded variants present in a panel of healthy individ-uals identified by using the same microarray platforms (~250 for the HumanOmniExpress and ~1,000 for the CytoScan HD). This approach allows for the filtering of background noise such as calling errors and genomic polymorphisms and, at the same time, allows for the
identification of recurrently affected genomic regions, as well as regions of potential clinical or biological rele-vance in CLL.
In order to evaluate the detection limit of the micro-array platforms, 7 cases (7, 9, 10, 11, 17, 20 and 24) were selected in which the genomic abnormality was present in 5-28% of the cells as determined by interphase FISH. By doing so, both microarray platforms exhibited a high limit of detection, i.e., CNAs present in at least 16% of the cells could unambiguously be detected and, in addition, a bi-allelic loss of 13q14 present in only 5% of the cells could be observed on the CytoScan HD array platform. Although in the present study low-mosaic CNAs present in at least 16% of the cells are readily detected,
log
CytoScan HD HumanOmniExpress
A
Case 9 Chr. 17
D
Case 11 Chr. 11
C
Case 18 Chr. 15q15.1
B
Case 16 Chr. 17p13.1
E
Case 21 Chr. 17
Log2 rat
io
S-log
2
AP
TP53
MGA
Log2 rat
io
Log2 rat
io
Log2 rat
io
Log2 rat
io
S-log
2 S-log
2
S-log
2
S-log
2
Log2 ratio
MGA
Log2 rat
io
Log2 rat
io
Log2 rat
io TP53
Figure 1Examples of microarray-based genomic profiles.Microarray-based genomic profiles obtained using the CytoScan HD and HumanOmnioExpress platforms, showing log2 ratios, the log2 ratios smoothened over 10 probes (S-log2) and allele peaks (AP) (case 21 only).
others [6,12,15,16,20] have reported CNAs identified by FISH (ranging from 10% to ~40% of abnormal cells) that remained undetected using genomic microarrays. This may, at least in part, be explained by the microarray plat-forms used, which appeared to exhibit a lower limit of de-tection, the choice of the software packages used [14], or even false-positive FISH results [15].
Despite the fact that we performed microarray-based genomic profiling on whole peripheral blood samples, and not on (CD19) enriched cells, we have shown the feasibil-ity of microarray-based profiling to detect genomic abnor-malities in peripheral blood samples from CLL patients. This finding is not unexpected, as CLL is characterized by a clonal expansion of B cells in peripheral blood. Nonethe-less, in laboratories that use microarray platforms with a lower limit of detection, an enrichment step for CD19-positive cells could improve the detection rate. An internal check for the presence of sufficient numbers of clonal B cells in the patient samples can be obtained by analysis of
the microarray profiles for the IGH, IGKand IGL genes,
for which copy number alterations reflect physiological
events accompanied by somatic V(−D-)J assemblies of the
IGH,IGKandIGL genes in the clonal B cell populations
[21,22]. We emphasize the importance of detecting small CLL clones based on their putative clinical impact in CLL patients. As yet, there is still some controversy re-garding the relevance of the size of a 17p deletion clone, in the range 10% to 25%, which could be associated with risk stratification and inferior outcome [23,24].
In 16 of the 28 CLL patients included, additional gen-omic alterations were identified by microarray-based pro-filing. Although the prognostic impact of many of these alterations awaits to be defined, an a priori clinical rele-vance may be assigned to at least some of them. It has previously been shown that the presence of a high number
of CNAs (ranging from 1 to ≥3 abnormalities >5 Mb),
referred to as genomic complexity, serves as an independ-ent risk factor for disease progression [11,15,25]. In the present study genomic complexity (as defined by 3 or
more aberrations≥5 Mb) was detected in 11 cases, and
was found to be associated with other high-risk features,
such as 11q22 loss, 17p13 loss andTP53mutation in 9 of
these 11 patients.
Eleven of the focal CNAs (smaller than 5 Mb and con-taining a tumor-related gene) were found to be recurrent,
such as lesions involving theRB1, LEU2, DLEU1, DLEU7,
and TP53genes, whereas other CNAs encompassed genes
(i.e., MGA, NFKB2and FBXW7) known to play a role in
CLL [5,7]. In one case (16) we identified a small focal
TP53 loss, which was not detected by FISH. This focal
TP53 loss was detected by both microarray platforms
(Figure 1B) and by MLPA. These latter findings indicate that microarray-based profiling not only allows the genome-wide detection of genomic abnormalities, but also
has a higher resolution for detecting clinical relevant focal lesions as compared to FISH and thus, is of added value. For the 8 non-recurrent CNAs detected involving tumor-related gene(s) (cases 9, 18 and 25), their role in the patho-genesis in CLL is as yet unknown.
Tumor-specific CNLOH was found in 5 cases, and in 2 of these cases the CNLOH involved regions affected by recurrent CNAs such as 13q14 and 17p13. In the pa-tient with 17p CNLOH, this genomic aberration was
asso-ciated with a homozygousTP53 mutation. Our CNLOH
observations are consistent with previously published data in which focal bi-allelic deletions in 13q14 and
homozy-gous TP53 mutations were found within larger CNLOH
regions [5,25,26].
High resolution microarray-based genomic profiling allows the definition of the size of recurrently deleted re-gions in CLL. In this way we were able to discriminate between cases with a large 13q deletion involving the
RB1 gene (Type II deletion) (cases 3, 4, 11, 16, 21 and
23) associated with shorter time to treatment and overall survival, from those with smaller losses encompassing
theDLEU2, DLEU1 and DLEU7genes and some
micro-RNAs (MIR15AandMIR16-1)(Type I deletion) (cases 2,
6, 8, 18, 20, 27 and 28) [8,9]. Microarray-based genomic profiling also allowed the detection of chromothripsis (case 11). This phenomenon was initially described in CLL as a new oncogenic event [10]. In an univariate analysis it has been shown that CLL patients with chro-mothripsis have an inferior outcome [5].
Conclusion
We here show that both microarray platforms tested ex-hibit a high limit of detection and resolution to identify clinically relevant genomic aberrations, including those that escape routine FISH and/or MLPA-based analyses, in CLL. In our hands, CNAs present in only 16% of the cells as determined by FISH can unambiguously be iden-tified. By applying similar interpretation criteria, results obtained from different microarray platforms are com-parable. This opens up the possibility to fully replace the use of the current FISH panel by microarray-based profil-ing in all CLL patients. In addition, we show that microarray-based genomic profiling allows the detection of
putative prognostic relevant abnormalities (i.e., focalTP53
deletions, CNLOH of 17p, size of 13q14 deletions and gen-omic complexity), that would have remained undetected by routine FISH and/or MLPA procedures. The ultimate prognostic value of these novel genomic alterations re-quires further evaluation in prospective clinical trials.
Methods
Patient samples and DNA isolation
university medical center and University Medical Center Groningen). The diagnosis CLL was based on standard morphologic and immunophenotypic criteria [27]. To determine the limit of detection of both microarray plat-forms, 7 patients with low percentages of abnormal cells as determined by FISH were selected from this cohort. One aliquot of each blood or bone marrow sample was cultured for 24 hours and a standard cytogenetic cell preparation was prepared for FISH analysis. From a sec-ond aliquot DNA was extracted using a QIAamp DNA mini kit (Qiagen, Venlo, The Netherlands) or the Max-well Instrument (Promega, Leiden, The Netherlands), both according to the instructions of the manufacturers.
FISH analysis
The following commercially available probes were used
for FISH:ATM(11q22), centromere 12, D13S319 (13q14)
andTP53(17p13) (all from Abbott Molecular, Des Plaines,
Illinois). FISH was performed according to the
manufac-turer’s specifications. At least 100 interphase nuclei were
scored by two independent investigators. Overall, there was a perfect concordance in scoring between the two investigators. The cut-off values for both gains and losses were determined by statistical evaluation of FISH results from control tissues: for each probe the mean + 3 standard deviations of false positive nuclei was taken as the cut-off level.
MLPA analysis
MLPA was carried out as described before [4] using two probe sets specifically designed for the detection of genetic aberrations in CLL, i.e., P037 and P038 (MRC-Holland, Amsterdam, The Netherlands). Amplified products were analyzed by capillary electrophoresis on an ABI 3730 genetic analyzer (Life Technologies, Carlsbad, USA). Data
were normalized by dividing each probe’s peak area by the
average peak area of the sample. This normalized peak pattern was divided by the average normalized peak pat-tern of all healthy control samples included in the same experiment. In a diploid situation, i.e., when two DNA copies are present in all cells, a relative copy number (RCN) of 1.0 is expected. When a deletion or duplication is present, the RCN will deviate towards 0.5 or 1.5, respectively.
Genomic profiling and data analysis
Microarray-based genomic profiling was carried out in a blinded fashion using two different platforms; the CytoSan HD array platform (Affymetrix, Inc., Santa Clara, CA, USA) and the HumanOmniExpress12v1.0 array platform (Illumina Inc., San Diego, CA, USA). Hybridizations were
performed according to the manufacturer’s protocols.
The data obtained by the CytoScan HD array platform were analyzed using the Chromosome Analysis Suite
software package (Affymetrix), and for the HumanOm-niExpress12v1.0 platform data were analyzed using Nexus copy number software (Biodiscovery Inc., Hawthorne, CA, USA) using annotations of genome version GRCh37 (hg19).
Interpretation of microarray data in CLL
For a comprehensive analysis of the microarray-based genomic profiling data we used a previously developed fil-tering pipeline, and its interpretation was performed using criteria adapted from [28]: (i) All segments larger than 5 Mb (resolution of conventional karyotyping), regardless of gene content, were denoted as true aberrations. (ii) All segments smaller than 5 Mb that coincided with known cancer genes (http://cancer.sanger.ac.uk/cancergenome/ projects/census/ date of accession November 2012) were included. (iii) Since paired control DNA was not used, al-terations that coincided with normal genomic variants were excluded. For this approach the publicly available
database‘Database of Genomic Variants’ (http://projects.
tcag.ca/variation/ NetAfix version 32; date of accession February 2012) and, in addition, the in-house databases in which CNVs are stored from respectively ~1,000 healthy individuals run on the CytoScan HD platform and ~250 healthy individuals run on the HumanOmniExpress were used. (iv) Regions of copy-neutral loss of heterozygosity (CNLOH), also known as acquired uniparental disomy (UPD) were only considered if they were >25 Mb in size or if they extended towards the telomeres of the involved chromosomes, based on [18,19,29]. (v) Focal CNAs in the immunoglobulin genes were excluded from this study, since these lesions generally represent the B-cell clone with a rearranged immunoglobulin gene.
All the data were also visually inspected to define al-terations present in a lower proportion of cells, and to eliminate alterations reported in regions with low probe density. Only aberrations fulfilling the above criteria were included in the genomic profiles, and were described according the standardized ISCN 2013 nomenclature system [30].
Ethical consent
This study performed according to code for proper use of human tissue in the Netherlands as determined by the Federation of Medical Scientific Societies and in compliance with the Helsinki Declaration.
Competing interests
All authors declare that they have no competing interests.
Authors’contributions
Acknowledgements
The authors thank the technicians of the laboratory of tumor genetics (LTG) of the Radboud university medical center and the department of Genetics of the University Medical Center Groningen for their contributions in FISH, MLPA and microarray-based genomic profiling.
Author details
1
Department of Human Genetics, Radboud university medical center, P.O. Box 9101, Nijmegen 6500 HB, The Netherlands.2Department of Genetics,
University Medical Center Groningen, P.O. Box 30001, Groningen 9700 RB, The Netherlands.3Department of Pathology, Radboud university medical
center, P.O. Box 9101, Nijmegen 6500 HB, The Netherlands.
Received: 5 November 2013 Accepted: 11 December 2013 Published: 9 January 2014
References
1. Dohner H, Stilgenbauer S, Benner A, Leupolt E, Krober A, Bullinger L, Dohner K, Bentz M, Lichter P:Genomic aberrations and survival in chronic lymphocytic leukemia.N Engl J Med2000,343:1910–1916.
2. Zenz T, Gribben JG, Hallek M, Dohner H, Keating MJ, Stilgenbauer S:Risk categories and refractory CLL in the era of chemoimmunotherapy.
Blood2012,119:4101–4107.
3. Dicker F, Schnittger S, Haferlach T, Kern W, Schoch C:Immunostimulatory oligonucleotide-induced metaphase cytogenetics detect chromosomal aberrations in 80% of CLL patients: a study of 132 CLL cases with correl-ation to FISH, IgVH status, and CD38 expression.Blood2006,
108:3152–3160.
4. Stevens-Kroef M, Simons A, Gorissen H, Feuth T, Olde Weghuis D, Buijs A, Raymakers R, Geurts van Kessel A:Identification of chromosomal abnormalities relevant to prognosis in chronic lymphocytic leukemia using multiplex ligation-dependent probe amplification.Cancer Genet Cytogenet2009,95:97–104.
5. Edelmann J, Holzmann K, Miller F, Winkler D, Buhler A, Zenz T, Bullinger L, Kuhn MW, Gerhardinger A, Bloehdorn J, Radtke I, Su X, Ma J, Pounds S, Hallek M, Lichter P, Korbel J, Busch R, Mertens D, Downing JR, Stilgenbauer S, Dohner H:High-resolution genomic profiling of chronic lymphocytic leukemia reveals new recurrent genomic alterations.Blood2012, 120:4783–4794.
6. Puiggros A, Puigdecanet E, Salido M, Ferrer A, Abella E, Gimeno E, Nonell L, Herranz MJ, Galvan AB, Rodriguez-Rivera M, Melero C, Pairet S, Bellosillo B, Serrano S, Florensa L, Sole F, Espinet B:Genomic arrays in chronic lympho-cytic leukemia routine clinical practice: are we ready to substitute con-ventional cytogenetics and fluorescence in situ hybridization techniques?Leuk Lymphoma2012,54:986–995.
7. Wang L, Lawrence MS, Wan Y, Stojanov P, Sougnez C, Stevenson K, Werner L, Sivachenko A, DeLuca DS, Zhang L, Zhang W, Vartanov AR, Fernandes SM, Goldstein NR, Folco EG, Cibulskis K, Tesar B, Sievers QL, Shefler E, Gabriel S, Hacohen N, Reed R, Meyerson M, Golub TR, Lander ES, Neuberg D, Brown JR, Getz G, Wu CJ:SF3B1 and other novel cancer genes in chronic lymphocytic leukemia.N Engl J Med2011,365:2497–2506.
8. Dal BM, Rossi FM, Rossi D, Deambrogi C, Bertoni F, Del G, Palumbo G, Nanni M, Rinaldi A, Kwee I, Tissino E, Corradini G, Gozzetti A, Cencini E, Ladetto M, Coletta AM, Luciano F, Bulian P, Pozzato G, Laurenti L, Forconi F, Di RF, Marasca R, Del PG, Gaidano G, Foa R, Guarini A, Gattei V:13q14 deletion size and number of deleted cells both influence prognosis in chronic lymphocytic leukemia.Genes Chromosomes Cancer2011,50:633–643. 9. Parker H, Rose-Zerilli MJ, Parker A, Chaplin T, Wade R, Gardiner A, Griffiths M,
Collins A, Young BD, Oscier DG, Strefford JC:13q deletion anatomy and disease progression in patients with chronic lymphocytic leukemia.
Leukemia2011,25:489–497.
10. Stephens PJ, Greenman CD, Fu B, Yang F, Bignell GR, Mudie LJ, Pleasance ED, Lau KW, Beare D, Stebbings LA, McLaren S, Lin ML, McBride DJ, Varela I, Nik-Zainal S, Leroy C, Jia M, Menzies A, Butler AP, Teague JW, Quail MA, Burton J, Swerdlow H, Carter NP, Morsberger LA, Iacobuzio-Donahue C, Follows GA, Green AR, Flanagan AM, Stratton MR, Futreal PA, Campbell PJ: Massive genomic rearrangement acquired in a single catastrophic event during cancer development.Cell2011,144:27–40.
11. Ouillette P, Erba H, Kujawski L, Kaminski M, Shedden K, Malek SN:Integrated genomic profiling of chronic lymphocytic leukemia identifies subtypes of deletion 13q14.Cancer Res2008,68:1012–1021.
12. Gunn SR, Mohammed MS, Gorre ME, Cotter PD, Kim J, Bahler DW, Preobrazhensky SN, Higgins RA, Bolla AR, Ismail SH, de Jong D, Eldering E, van Oers MH, Mellink CH, Keating MJ, Schlette EJ, Abruzzo LV, Robetorye RS: Whole-genome scanning by array comparative genomic hybridization as a clinical tool for risk assessment in chronic lymphocytic leukemia.J Mol Diagn2008,10:442–451.
13. Hagenkord JM, Monzon FA, Kash SF, Lilleberg S, Xie Q, Kant JA:Array-based karyotyping for prognostic assessment in chronic lymphocytic leukemia: performance comparison of Affymetrix 10 K2.0, 250 K Nsp, and SNP6.0 arrays.J Mol Diagn2010,12:184–196.
14. O’Malley DP, Giudice C, Chang AS, Chang D, Barry TS, Hibbard MK, Chen R, Chen ST:Comparison of array comparative genomic hybridization (aCGH) to FISH and cytogenetics in prognostic evaluation of chronic lymphocytic leukemia.Int J Lab Hematol2011,33:238–244.
15. Mian M, Rinaldi A, Mensah AA, Rossi D, Ladetto M, Forconi F, Marasca R, Uhr M, Stussi G, Kwee I, Cavalli F, Gaidano G, Zucca E, Bertoni F:Large genomic aberrations detected by SNP array are independent prognosticators of a shorter time to first treatment in chronic lymphocytic leukemia patients with normal FISH.Ann Oncol2013,24:1378–1384.
16. Urbankova H, Papajik T, Plachy R, Holzerova M, Balcarkova J, Divoka M, Prochazka V, Pikalova Z, Indrak K, Jarosova M:Array-based karyotyping in chronic lymphocytic leukemia (CLL) detects new unbalanced abnormalities that escape conventional cytogenetics and CLL FISH panel.Biomed Pap Med Fac Univ Palacky Olomouc Czech. Epub ahead of print.
17. Maciejewski JP, Tiu RV, O’Keefe C:Application of array-based whole gen-ome scanning technologies as a cytogenetic tool in haematological ma-lignancies.Br J Haematol2009,146:479–488.
18. Tiu RV, Gondek LP, O’Keefe CL, Elson P, Huh J, Mohamedali A, Kulasekararaj A, Advani AS, Paquette R, List AF, Sekeres MA, McDevitt MA, Mufti GJ, Maciejewski JP:Prognostic impact of SNP array karyotyping in myelodysplastic syndromes and related myeloid malignancies.
Blood2011,117:4552–4560.
19. Simons A, Stevens-Kroef M, El Idrissi-Zaynoun N, van Gessel S, Olde Weghuis D, van den Berg E, Waanders E, Hoogerbrugge P, Kuiper R, Geurts van Kessel A:Microarray-based genomic profiling as a diagnostic tool in acute lymphoblastic leukemia.Genes Chromosomes Cancer2011,50:969–981. 20. Ouillette P, Collins R, Shakhan S, Li J, Peres E, Kujawski L, Talpaz M, Kaminski
M, Li C, Shedden K, Malek SN:Acquired genomic copy number aberrations and survival in chronic lymphocytic leukemia.Blood2011, 118:3051–3061.
21. Wlodarska I, Matthews C, Veyt E, Pospisilova H, Catherwood MA, Poulsen TS, Vanhentenrijk V, Ibbotson R, Vandenberghe P, Morris TC, Alexander HD: Telomeric IGH losses detectable by fluorescence in situ hybridization in chronic lymphocytic leukemia reflect somatic VH recombination events.
J Mol Diagn2007,9:47–54.
22. Mraz M, Stano KK, Plevova K, Musilova K, Tichy B, Borsky M, Kuglik P, Doubek M, Brychtova Y, Mayer J, Pospisilova S:The origin of deletion 22q11 in chronic lymphocytic leukemia is related to the
rearrangement of immunoglobulin lambda light chain locus.Leuk Res
2013,37:802–808.
23. Delgado J, Espinet B, Oliveira AC, Abrisqueta P, de la SJ, Collado R, Loscertales J, Lopez M, Hernandez-Rivas JA, Ferra C, Ramirez A, Roncero JM, Lopez C, Aventin A, Puiggros A, Abella E, Carbonell F, Costa D, Carrio A, Gonzalez M:Chronic lymphocytic leukaemia with 17p deletion: a retro-spective analysis of prognostic factors and therapy results.Br J Haematol
2012,157:67–74.
24. Oscier D, Wade R, Davis Z, Morilla A, Best G, Richards S, Else M, Matutes E, Catovsky D:Prognostic factors identified three risk groups in the LRF CLL4 trial, independent of treatment allocation.Haematologica2010, 95:1705–1712.
25. Gunnarsson R, Isaksson A, Mansouri M, Goransson H, Jansson M, Cahill N, Rasmussen M, Staaf J, Lundin J, Norin S, Buhl AM, Smedby KE, Hjalgrim H, Karlsson K, Jurlander J, Juliusson G, Rosenquist R:Large but not small copy-number alterations correlate to high-risk genomic aberrations and sur-vival in chronic lymphocytic leukemia: a high-resolution genomic screen-ing of newly diagnosed patients.Leukemia2010,24:211–215.
27. Hallek M, Cheson BD, Catovsky D, Caligaris-Cappio F, Dighiero G, Dohner H, Hillmen P, Keating MJ, Montserrat E, Rai KR, Kipps TJ:Guidelines for the diagnosis and treatment of chronic lymphocytic leukemia: a report from the International Workshop on Chronic Lymphocytic Leukemia updating the National Cancer Institute-Working Group 1996 guidelines.
Blood2008,111:5446–5456.
28. Simons A, Sikkema-Raddatz B, de LN, Konrad NC, Hastings RJ, Schoumans J: Genome-wide arrays in routine diagnostics of hematological malignan-cies.Hum Mutat2012,33:941–948.
29. Heinrichs S, Li C, Look AT:SNP array analysis in hematologic malignancies: avoiding false discoveries.Blood2010,115:4157–4161. 30. Shaffer LG, McGowan-Jordan J, Schmid M:ISCN 2013: An International
System for Human Cytogenetic Nomenclature.Basel: Karger; 2013.
doi:10.1186/1755-8166-7-3
Cite this article as:Stevens-Kroefet al.:Identification of prognostic relevant chromosomal abnormalities in chronic lymphocytic leukemia using microarray-based genomic profiling.Molecular Cytogenetics
20147:3.
Submit your next manuscript to BioMed Central and take full advantage of:
• Convenient online submission
• Thorough peer review
• No space constraints or color figure charges
• Immediate publication on acceptance
• Inclusion in PubMed, CAS, Scopus and Google Scholar
• Research which is freely available for redistribution