R E S E A R C H P A P E R
Gene expression profiles in human HepG2 cells treated
with extracts of the
Tamarindus indica
fruit pulp
Nurhanani Razali•Azlina A. Aziz • Sarni M. Junit
Received: 11 June 2010 / Accepted: 29 September 2010 / Published online: 19 October 2010 ÓThe Author(s) 2010. This article is published with open access at Springerlink.com
Abstract Tamarindus indica L. (T. indica) or locally known as asam jawa belongs to the family of Leguminosae. The fruit pulp had been reported to have antioxidant activities and possess hypolipidaemic effects. In this study, we attempted to investigate the gene expression patterns in human hepatoma HepG2 cell line in response to treatment with low concentration of the fruit pulp extracts. Micro-array analysis using Affymetrix Human Genome 1.0 S.T arrays was used in the study. Microarray data were vali-dated using semi-quantitative RT–PCR and real-time RT–PCR. Amongst the significantly up-regulated genes were those that code for the metallothioneins (MT1M,
MT1F, MT1X) and glutathione S-transferases (GSTA1,
GSTA2, GST02) that are involved in stress response.
APOA4,APOA5,ABCG5andMTTPgenes were also sig-nificantly regulated that could be linked to hypolipidaemic activities of theT. indicafruit pulp.
Keywords Tamarindus indicafruit pulp Gene
expressionMicroarray analysisRT–PCRHepG2 cells
Introduction
Plants and herbs have been used for years traditionally as food and for various medicinal purposes. Many of these plants are excellent sources for polyphenols that are potent antioxidant compounds which exhibit a wide range of biological effects as consequences of their antioxidant properties [7, 21]. Tamarindus indica L. (T. indica) or
locally known as asam jawa belongs to the family Leguminosae and grows naturally in many tropical and subtropical regions. Various parts of the plants are used as food components and in herbal medicine. The T. indica
fruits have irregular curved pods. When ripe, the pods are filled with brown or reddish-brown pulp that coats the seeds. The pulp has a sweet/sour taste and is widely used as flavouring in cooking. There are wide differences in fruit size and flavour in seedling trees. The Indian types have longer pods with 6–12 seeds, while the West Indian types have shorter pods, containing only 3–6 seeds. The pulp is believed to be rich in vitamins and minerals such as niacin and calcium, respectively [27]. TheT. indicafruit pulp is commonly used in traditional medicine including as a digestive, laxative, expectorant and an antipyretic agent. Biochemical analysis in support of the beneficial effects of the T. indica fruit pulp extracts includes a study by Martinello et al. [26] who showed that the T. indica fruit extracts were able to decrease the levels of serum choles-terol and triglycerides in hypercholescholes-terolaemic hamsters. The T. indicafruit pulps have also been shown to contain phenolic antioxidants such as epicatechins [44] that were able to inhibit low-density lipoprotein (LDL) oxidation in vitro [45]. Chan et al. [9] had shown that epicatechins from jasmine green tea were able to reduce serum levels of TG, and cholesterol in hamsters fed a high-fat diet, but the hypolipidaemic effects were not through the inhibition of liver HMGCoA reductase or intestinal ACAT. They further postulated that the observed hypolipidaemic effects of epicatechins were probably associated with the inhibition of absorption of dietary fat, cholesterol or reabsorption of bile acids [9]. Another group of researchers, Landi Librandi et al. [22], reported that the fruit pulp extract was able to modulate the activity of the complement system when tested both in vitro and in vivo. Scientific data based N. RazaliA. A. AzizS. M. Junit (&)
Department of Molecular Medicine, Faculty of Medicine, University of Malaya, 50603 Kuala Lumpur, Malaysia e-mail: sarni@um.edu.my
on molecular analysis to support the beneficial effects of the pulp extracts are, however, still lacking. Therefore, in this study, we decided to analyse the global gene expres-sion in response to low concentration of the fruit pulp extracts ofT. indica in HepG2 cell line, a widely used in vitro model for human liver hepatocytes.
Materials and methods
Preparation ofT. indicafruit pulp extracts
Whole, ripeT. indicafruits were collected from Kedah in the northern region of Malaysia. The voucher specimen of the sample with an identification number, KLU 45976, was deposited in the Rimba Ilmu Herbarium, the University of Malaya. The fruit pulp extracts were prepared as previously described by Razali et al. [37]. Briefly, the fruit pulp was separated from the seeds, air-dried and then powdered. The powderedT. indica fruit pulp (2.5 g) was then placed in a conical flask and soaked in 50 ml methanol at room tem-perature for 24 h. The resulting extracts were then filtered, roto-evaporated and redissolved in 10% DMSO. The samples were kept at-20°C until further analysis. Cell culture
The human hepatoma cell line HepG2 (ATCC, Manassas, VA, USA) was grown in Dulbecco’s modified Eagle’s medium (DMEM) supplemented with 10% foetal bovine serum (Flowlab, Australia), 1% penicillin (Flowlab, Aus-tralia) and 1% streptomycin (Flowlab, AusAus-tralia). Cells were maintained in humidified air with 5% CO2at 37°C. Cell viability assay
A cell viability assay was carried out using 3-(4,5-dimethyl-thiazol-2-yl)-2,5-diphenyltetrazolium bromide (MTT) as described by Mosmann [28], with minor modifications. Briefly, HepG2 cells at a density of 5,000 cells per well were seeded in a 96-well ELISA microplate. The cells were incubated at 37°C in 5% CO2for 24 h. After 24 h, the pulp extracts, at various concentrations (100–9,000lg/ml), were added into the wells. The cells were left to grow in the incubator for 48 h. After 48 h, MTT reagent (Merck) was added, and the mixture was further incubated for 4 h. Next, the mixture in each well was removed, and formazan crystals formed were dissolved in 10ll of 75% isopropa-nol. Spectrophotometric measurement of the mixture was performed in a microplate reader (Bio-Rad) at wavelengths of 570 and 620 nm. A log plot of cell viability (%) against the concentrations of plant extracts were constructed. From the plot, a near non-toxic concentration of the extracts was
chosen to study the modifications of gene expression patterns in HepG2 cells in response to treatment with methanol extracts of the T. indicafruit pulp. The concen-tration of the methanol extracts of theT. indicafruit pulp that reduced cell viability by 50% (IC50) was also calculated from the plot.
Treatment of HepG2 cells with methanol extracts of T. indicafruit pulp
Confluent HepG2 cells maintained in DMEM were treated with methanol extracts at 300 lg/ml, a non-toxic concen-tration determined from the MTT assay. The cells were then incubated at 37°C for 24 h. As a control, cells were incubated in the absence of the methanol extracts. After 24 h, cells were trypsinized and then precipitated by cen-trifugation at 1,300 rpm for 5 min. Cells were washed with PBS twice before total cellular RNA (tcRNA) was extracted from the cells.
Total cellular RNA preparation from the control and treated HepG2 cells
tcRNA from both untreated (control) andT. indica-treated HepG2 cells was isolated and then purified using RNAEasy kit (Qiagen) according to the manufacturer’s instructions. Briefly, the cells were lysed with guanidine thiocyanate-containing buffer (RLT buffer) followed by homogeniza-tion with a QIAshredder. Ethanol (75%) was then added to the mixture, and the mixture was then loaded into RNA spin columns. Following this, the columns were washed with RW1 and RPE buffers that were supplied by the manufac-turer. After washing with a reduced volume of buffer RW1, the RNA was treated with DNase I using RNase-free DNase Set (Qiagen) while bound to the RNAEasy membrane. The DNase I was removed by a second wash with buffer RW1. Then, washing with buffer RPE and elution of RNA were then performed. In the final step, the tcRNA was eluted using RNase-free water into collection tubes. The quality of the tcRNA was estimated by measuring the absorbance ratio of 260–280 nm. Values above 1.8 indicate that the tcRNA is of good quality. The integrity of the tcRNA was also ana-lysed using denaturing gel electrophoresis. The integrity of the tcRNA is indicated by the presence of two distinct bands corresponding to the ribosomal 28S and 18S subunits, with the intensity of the larger 28S band approximately twice than that of the smaller 18S band.
Preparation of the sense strand DNA for microarray gene expression analysis
conventional Affymetrix eukaryotic RNA labelling proto-col (Affymetrix). Briefly, the tcRNA (100 ng) isolated from the untreated (control) and the T. indica-treated HepG2 cells was first converted to single-stranded sense strand DNA (cDNA) in two cycles using the whole tran-script (WT) cDNA synthesis, amplification kit and sample clean-up module. In the first cycle, the tcRNA was con-verted to double-stranded cDNA using random hexamers tagged with a T7 promoter sequence. Each strand of the double-stranded cDNA was then used as a template to synthesize antisense RNA (cRNA). In the second cycle, the cRNA was reversed transcribed into sense strand DNA in the presence of random hexamers (3lg/ml) and dNTPs mix containing dUTP (10 mM).
Sense strand DNA labelling and hybridization to the Affymetrix Human Gene 1.0 S.T arrays
The sense strand DNA was cleaned up using the sample clean-up kit and then cleaved into small fragments using a mixture of UDP and apurinic/apyrimidinic endonuclease 1 or APE1. The fragmented sense strand DNA was then end-labelled through a terminal transferase reaction that incorporates biotinylated dideoxynucleotides using the WT terminal labelling kit. The fragmented, biotinylated sense strand DNA (5.5lg) was then hybridized to the Affymetrix Human Gene 1.0 S.T array at 45°C for 16 h in a hybridization Oven 640. After hybridization, the arrays were stained and then washed in the Affymetrix Fluidics Station 450 under standard conditions. The stained arrays were then scanned at 532 nm using an Affymetrix GeneChip Scanner 3000, and CEL files for each array were generated using the Affymetrix Gene-ChipÒ Operating Software (GCOS). The data were sub-jected to normalization, background correction and data summarization using Affymetrix Expression Console software.
Microarray data normalization and analysis
The CEL files were then converted to text files and exported to Partek Genomic Suite software to get the whole list of up-regulated and down-regulated genes. The whole gene lists generated were then normalized by filtering out probeset IDs that did not have any annotation in the Partek software, using the Netaffx Analysis Center software. The gene sets were then subjected to a one-way analysis of variance (ANOVA) in the Partek Genomic software to determine significantly expressed sets of genes, which was set according to P value less than 0.05 (P\0.05). Sig-nificantly expressed genes were then re-filtered to include only those with fold change difference of equal to or greater than 1.5.
Biological interpretation: gene ontology (GO)
Additional information on the biological functions of the genes (genes products) that were significantly regulated (P\0.05) with a fold change which was equal to or greater than 1.5 was determined using the Gene Ontology Enrichment tool in the Partek Genomic Suite Software. Validation of the microarray data using
semi-quantitative reverse transcription polymerase chain reaction (RT–PCR)
The microarray data were validated using semi-quantitative reverse transcription PCR (RT–PCR) as follows: tcRNA (2 lg) from control and T. indica-treated cells were reverse-transcribed to cDNA in a final volume of 20ll containing a mixture of first strand buffer (1X), random hexamers (25 ng/ll), dNTP mix (0.5 mM), dithiothreitol (DTT) (0.1 M) and superscript II reverse transcriptase (10 units). The mixture was then incubated at 42°C for 50 min followed by inactivation at 70°C for 15 min. The cDNA was then used as templates for PCR amplification of selected up-regulated and down-regulated genes using primer pairs listed in Table1. A PCR mixture containing cDNA (2000 ng), PCR buffer (1 X), 50 and 30 primers for GADPH and the selected genes of interest (1lM), dNTPs (10 mM), DMSO (10% v/v) and Taq DNA polymerase (5 units) were prepared to a final volume of 50 ll with sterile distilled water (Sigma). PCR amplification was carried out in a thermal cycler (Biometra) with initial DNA denaturation at 95°C for 3 min followed by 35 cycles of denaturation at 94°C for 5 s, annealing of primers to the cDNA templates at 55°C for 1 min and DNA extension/ elongation at 72°C for 3 min. The final DNA extension was done at 72°C for 10 min. The PCR products were then separated through electrophoresis on a 2% agarose gel stained with 2lg/ml ethidium bromide. The separated bands were visualized using a UV transilluminator, and the images were captured using a Canon CCD camera (BioRad Gel Doc 1000/2000). The intensity of the bands that corresponded to the amount of the PCR products of the selected regulated genes was then quantitated using Quantity One software (BioRad). Scanned values were expressed in arbitrary unit, and the expression of the selected genes relative to that of a housekeeping gene
GADPHwas then determined.
Validation of the microarray data using real-time RT–PCR
cDNA and primer pairs for the selected up-regulated and down-regulated genes as well as a housekeeping gene,
GADPH, as listed in Table1 were used. The PCR ampli-fication was performed in 0.2 ml MicroAmpÒ Optical 8-tube strips in a final volume of 20ll containing a mix-ture of cDNA (30 ng), reverse and forward primers (1lM), pre-prepared Power SYBRÒ Green PCR master mix containing SYBRÒ Green 1 dye, AmpliTaq GoldÒ DNA Polymerase dNTPs, dUTP, Passive Reference 1 and optimized buffer components. The PCR parameters con-sisted of 40 cycles of amplification with initial denaturation at 95°C for 15 s, annealing of primers and elongation of the newly synthesized strands at 60°C for 60 s. The PCR mixture was initially held for 10 min at 95°C for AmpliTaq
GoldÒ DNA polymerase activation. The comparative CT method (DDCT) was chosen for the relative quantitation of gene expression. Each sample type was run in triplicate. mRNA levels of the selected genes were normalized against GADPH mRNA.
Results
MTT cell proliferation assay
The viability of HepG2 cells (%) in response to different concentrations of the methanol extracts of the T. indica
fruit pulp is presented as a log plot in Fig.1a. The plot shows a concentration-dependent decrease in cell viability with increasing concentrations of the methanol extracts of theT. indicafruit pulp. Cell viability was maintained above 80% even at a concentration of 1,000lg/ml. The IC50was found to be 4.57 mg/ml. Figure1b shows the pictures of the cells viewed under light microscope, when the cells were treated with 300lg/ml and 4.57 mg/ml of the methanolic extracts. In this study, we investigated the
effects of methanol extracts of the T. indicafruit pulp on gene expression patterns in cultured human HepG2 cells at a concentration of 300lg/ml where cell viability was still above 90%.
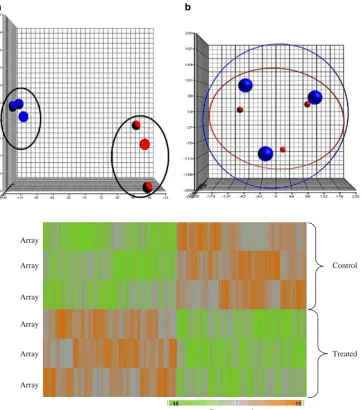
Normalization and visualization of microarray data Microarray data were initially visualized using a principal components analysis (PCA) plot (Fig.2). The data from the control group (n =3) were shown in blue, whereas those in the treated group (n=3) were indicated in red. Each ball represents gene expression data generated from a sample that was applied on a gene chip. Figure2a shows the data that were generated from the three biological replicates. From the plot, sample outliers were not detected both in the control and in treated group. The control group is also distinguishably separated from those of the treated samples. Each biological replicate comprising a control and a treated sample was also analysed on a different date (scan date), and the results are illustrated in Fig.2b. It clearly shows that when analysed together, the control and the sample in each replicate are always grouped together.
Figure3 shows hierarchical clustering of genes in HepG2 cells in response to treatment with methanol extracts of theT. indicafruit pulp. Each lane represents an array. Up-regulated genes in treated samples were shown in orange, and down-regulated genes were shown in green. The pattern of the gene expression was similar in the biological replicates. In response to fruit pulp extracts of 300 lg/ml, 827 genes were significantly down-regulated, and a further 674 genes were significantly up-regulated. Amongst the significantly up-regulated genes wereMT1M,
MT1F, MT1X, GSTA1, GSTA2 and GST02 (Table2). In addition,APOA4,APOA5andABCG5were also up-regu-lated. Genes that were significantly down-regulated include
PDE3A, PTTG1, CYP1A1, IFIT1 and MTTP (Table2).
Table 1 Primer sequences for the selected genes used for validation of the microarray data using semi-quantitative RT–PCR and real-time RT–PCR
Gene Primer sequence Product
size (bp)
Glyceraldehyde-3-phosphate dehydrogenase (GADPH) (NM_002046)
Forward: 50-TGCCTCCTGCACCACCAACTGC-30
Reverse: 50-AATGCCAGCCCCAGCGTCAAAG-30
457
Phosphodiesterase 3A (PDE3A) (NM_000921)
Forward: 50-GAACAGATGACACTGCTCAAGTT-30
Reverse: 50-GAGCAAGAATTGGTTTGTCCAG-30
180
Interferon-induced protein with tetratricopeptide repeats (IFIT1) (NM_001548)
Forward: 50-AGAACGGCTGCCTAATTTACAG-30
Reverse: 50-GCTCCAGACTATCCTTGACCTG-30
73
Glutathione S-transferase A1 (GSTA1) (NM_145740)
Forward: 50-AGCCGGGCTGACATTCATCT-30
Reverse: 50-TGGCCTCCATGACTGCGTTA-30
230
Microsomal triglyceride transfer protein (MTTP) (NM_000253)
Forward: 50-CGTTCGGCATCTACTTACAGC-30
Reverse: 50-GTTCTCCTCCCCCTCGTCAG-30
In addition, a set of genes that are involved in the cell cycles CCNG1, CCNG2, CCNA2, CCNB1, CCNB2 and
CDC2were also significantly down-regulated. Gene ontology: biological process
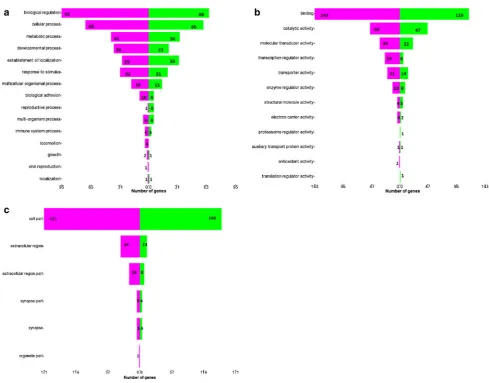
Gene ontology analysis of the differentially expressed genes in HepG2 cells in response to treatment with the methanol extracts of theT. indica fruit pulp is shown in
Figs. 4and5. In Fig.4, genes (and subsequently their gene products) were categorized into their participations in general metabolisms. It was found that 60 genes that are related to reactive oxygen species were up-regulated, whereas 13 were down-regulated. In addition, 95 genes that are involved in lipid metabolism were down-regulated, and another 62 were up-regulated. Figure5 shows the number of significantly regulated genes that are categorized according to their roles in major biological processes (a), molecular functions (b) and major cellular components (c). The green bars represent the up-regulated genes, and the purple bars depict the down-regulated genes.
Validation of the microarray data
Semi-quantitative RT–PCR analysis was performed on selected significantly regulated genes as follows: PDE3A,
GSTA1andMTTP(Fig.6). The sizes of the PCR products that corresponded to the selected genes were 180, 230 and 180 bps, respectively. The PCR product for the house-keeping gene, GADPH, which is 457 bp, is shown by the arrow. The relative expression of the PDE3A, GSTA and
MTTPgenes to that of the housekeeping gene were-0.69-, 1.401- and -0.439-fold, respectively.
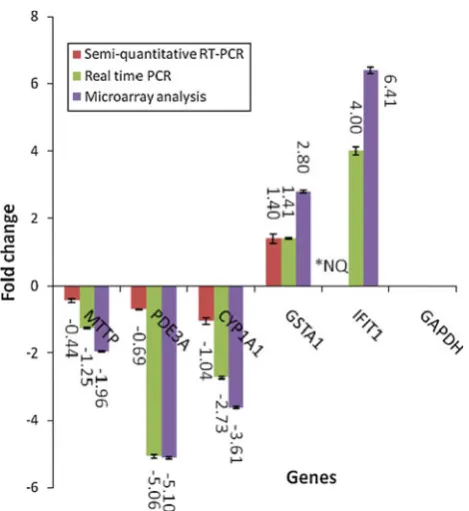
The expression of the selected genes PDE3A,GSTA1,
CYP1A1 and MTTP as well as the interferon-induced protein (IFIT1) relative to that of GADPH was also quantitated using real-time RT–PCR. As shown in Fig.7, the pattern of expression of the genes analysed using microarray technology was similar to that of the real-time RT–PCR. TheMTTPgene was down-regulated by -1.25-fold in real-time RT–PCR compared with -1.96-fold in microarray. PDE3A gene was down-regulated by about -5.06-fold in RT–PCR when compared with -5.10 in microarray analysis. CYP1A1 gene was also shown to be down-regulated when analysed using both RT–PCR and microarray methods by -2.73- and -3.61-fold, respec-tively. GSTA1 was up-regulated by 1.54-fold in RT–PCR analysis compared with 2.8-fold in microarray. In addition,
IFIT1was up-regulated by fourfold in RT–PCR compared with 6.41-fold in microarray. All data were normalized to the reference gene, GAPDH. The expression patterns obtained with semi-quantitative RT–PCR and real-time RT–PCR were consistent with the microarray results.
Discussion
The MTT assay is a rapid colorimetric assay developed by Mosman [28] and had since been widely used to measure cell viability/proliferation in living cells [2,5,15]. In this study, the methanol extracts of theT. indicafruit pulp were shown to have an IC50of 4.57 mg/ml. For the microarray
Fig. 1 a A log plot of concentrations of the T. indica fruit pulp extracts (lg/ml) versus percentage (%) of HepG2 cells viability. From the log10plot, the IC50was found to be 4.57 mg/ml.bExamination
analysis, we decided to use a low concentration of 300lg/ml where cell viability was still above 90%. We decided to use a low concentration of the extracts instead of the usual IC50 concentration, because it is known that dietary antioxidants are present in circulation in small amount because they are either poorly absorbed from the intestine or once absorbed they are quickly metabolized [18, 46]. At this low con-centration, we found that the methanol extracts of the
T. indicafruit pulp were able to significantly regulate a total of 1501 genes (P\0.05) with a fold change of at least 1.5. Amongst the significantly up-regulated genes were those that code for the metallothioneins (MTs), MT1M, MT1F,
MT1X and glutathione S-transferases (GSTs) namely
GSTA1,GSTA2andGSTO2. MTs and GSTs have protective roles over heavy metals such as cadmium [8] and oxidative DNA, protein and lipid damage [6,11]. In this study, only genes encoding MT-1 but not the other two isoforms, MT-2 and MT-3, were induced by low concentration of the
T. indicafruit pulp extracts. In addition, GSTs are involved in the detoxification of xenobiotics such as toxins and carcinogens [13,15] and regulate cellular stress response to the formation of reactive oxygen species through the JNK-associated apoptosis [39]. Omega class GSTs have dehy-droascorbate reductase and thioltransferase activities and also catalyse the reduction of monomethylarsonate, an intermediate in the pathway of arsenic biotransformation. Other diverse actions of human GSTO1-1 include modu-lation of ryanodine receptors and interaction with cytokine release inhibitory drugs. Glutathione S-transferase omega 1 and omega 2 (GSTO1 and GSTO2) catalyse monomethyl arsenate reduction during arsenic biotransformation [29].
Diseases of the cardiovascular system are the most common cause of death in developed countries. It has been established that hyperlipidaemia including high cholesterol levels in blood represents a major risk factor for the premature development of atherosclerosis and its
Fig. 2 A principal components analysis (PCA) plot of HepG2 cells grown in the presence and absence of extracts of the T. indicafruit pulp showing biological replicates (n=3) of control and treated samples. Arrays for the control group were inblue, and those for the treated group were inred. The data are clustered by treatment (a) and scan date (b). Eachball represents an array or a sample
Control
Treated
Gene expression Array
Array
Array
Array
Array Array
cardiovascular complications. Presently, statin, which is an inhibitor of HMGCoA reductase, is widely used to decrease plasma LDL and is able to reduce cardiovascular events by 20–40% [42]. Patients who cannot tolerate or respond poorly to statin are given other hypolipidaemic therapies such as fibrates and nicotinic acid. Scientists are
now tapping into the rich biodiversity of the world to look for functional foods that can reduce cholesterol and lipid levels and are as potent, well-tolerated, cheaper, safer alternatives to the currently marketed drugs.
The extracts of theT. indicafruit pulp have the potential to be used as lipid-lowering agents. An earlier study by
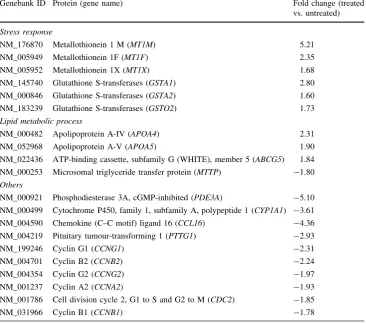
Table 2 A list of selected significantly up-regulated and down-regulated genes in HepG2 cells treated with methanolic extracts ofT. indicafruit pulp that may be related to stress response (A), lipid metabolic processes (B) and others (C)
Details of the GenBank accession number, name of the gene and its respective protein and fold change difference between treated and non-treated cells are included
Genebank ID Protein (gene name) Fold change (treated vs. untreated)
Stress response
NM_176870 Metallothionein 1 M (MT1M) 5.21
NM_005949 Metallothionein 1F (MT1F) 2.35
NM_005952 Metallothionein 1X (MT1X) 1.68
NM_145740 Glutathione S-transferases (GSTA1) 2.80
NM_000846 Glutathione S-transferases (GSTA2) 1.60
NM_183239 Glutathione S-transferases (GSTO2) 1.73
Lipid metabolic process
NM_000482 Apolipoprotein A-IV (APOA4) 2.31
NM_052968 Apolipoprotein A-V (APOA5) 1.90
NM_022436 ATP-binding cassette, subfamily G (WHITE), member 5 (ABCG5) 1.84
NM_000253 Microsomal triglyceride transfer protein (MTTP) -1.80
Others
NM_000921 Phosphodiesterase 3A, cGMP-inhibited (PDE3A) -5.10
NM_000499 Cytochrome P450, family 1, subfamily A, polypeptide 1 (CYP1A1) -3.61
NM_004590 Chemokine (C–C motif) ligand 16 (CCL16) -4.36
NM_004219 Pituitary tumour-transforming 1 (PTTG1) -2.93
NM_199246 Cyclin G1 (CCNG1) -2.31
NM_004701 Cyclin B2 (CCNB2) -2.24
NM_004354 Cyclin G2 (CCNG2) -1.97
NM_001237 Cyclin A2 (CCNA2) -1.93
NM_001786 Cell division cycle 2, G1 to S and G2 to M (CDC2) -1.85
NM_031966 Cyclin B1 (CCNB1) -1.78
Martinello et al. [26] showed that the extracts of the
T. indica fruit pulp were able to decrease the levels of serum cholesterol and triglycerides in hypercholesterolae-mic hamsters. The molecular mechanism of the lipid-lowering activity of the fruit extracts is, however, still unknown. Our microarray analysis did not detect changes in the expression of the HMGCoA reductase gene, sug-gesting that the lipid-lowering activity is not through the inhibition of cholesterol biosynthesis. Our microarray data showed that amongst others, three genes that critically regulate lipid metabolism were differentially expressed:
APOA4,APOA5,ABCG5andMTTP.
Apoliporotein A-V (ApoA-V) that is coded by APOA5
gene plays a vital role in the regulation of TG metabolism [43]. ApoA-V is thought to reduce TG levels by activating lipoprotein lipase (LPL), the enzyme that is responsible in catabolizing TG-rich lipoproteins, chylomicrons and VLDL, hence improving the clearance of these lipoproteins
Fig. 5 Gene ontology analysis. Forest plots showing the categoriza-tion of the significantly regulated genes (P\0.05; fold change more or equal to 1.5) according to their roles in major biological processes
(a), molecular functions (b) and major cellular components (c). The green bars represent the up-regulated genes, and the purple bars depict the down-regulated genes
from blood. Mutations in the APOA5 gene have been shown to cause hypertriglyceridaemia [35]. In our study, we found that in the methanol extract-treated HepG2 cells,
APOA5gene was up-regulated by 1.9-fold. This could be contributed by procyanidin, a phenolic compound found in grape seed that was able to lower TG levels in rats, up-regulate apoA5 gene expression in mouse liver [12] and was shown to also be present in the T. indica fruit pulp [44].
APOA4gene codes for the apolipoprotein A-IV (ApoA-IV) which is like cholecystokinin (CCK), a known gas-trointestinal satiety signal proteins whose synthesis and secretion from the gut are stimulated by fat absorption [24]. Apart from the intestine, apoA-IV is also synthesized by the hypothalamus, and the gene has also been shown to be expressed in the liver [23]. In human hepatoma HepG2 cells, APOA4 mRNA was up-regulated when cells were treated with liver X receptors (LXR) agonists. LXRs are oxysterol receptors that can mediate cholesterol homeo-stasis. Treatment of C57B6 mice with a synthetic LXR agonist, T0901317, resulted in significant increases in plasma apoA-IV that was associated with an increase in high-density lipoprotein. Examination of both intestinal
and liver apo A-IV mRNA revealed specific increases in liver mRNA only [23]. ApoA-IV had also been shown to be a potent endogenous antioxidant that inhibits lipid per-oxidation [14,36].
In this study, the gene encoding an ATP-binding cassette sterol transporter, ABCG5, was also up-regulated by the methanol extracts of theT. indica fruit pulp. ABCG5 has been shown to be regulated in the liver and intestine by the LXRs [38,48]. An overexpression ofABCG5was found to promote cholesterol excretion through bile and reduce absorption of dietary cholesterol [48]. In addition, muta-tions in the ABCG5 gene were implicated in sitosterola-emia [17,19,25], characterized by elevated plasma levels of plant sterols and cholesterol due to increased absorption and decreased excretion of the neutral sterols into biles [3,4]. The increased circulating levels of these sterols are associated with the deposition of cholesterol in the skin and tendons (xanthomas), and in the walls of the coronary arteries, resulting in premature coronary atherosclerosis.
Peroxisome proliferator-activated receptor alpha (PPARa) is a key regulator in hepatic lipid metabolism, and apoA-IV had been identified as a potential therapeutic target for dyslipidaemia [30]. Oral administration of PPARa agonist KRP-101 in dogs caused a decrease in serum TG accompanied by an increase in serum apoA-IV levels [30]. In addition, administration of a potent and selective PPARaagonist, LY570977L-lysine decreased TG and increased circulating apoA-V levels in cynomolgus monkeys [41]. Functional PPAR-binding element in the promoter of the humanAPOA5gene was found in human, which is somewhat degenerate and non-functional in the corresponding mouse Apoa5 [34]. APOA5 resides on the
APOAI/CIII/AIVgene cluster on human 11q23 [33]. Gene coding for the apolipoprotein C-III which is a marker of TG-rich lipoproteins was up-regulated in this study but at a lower fold change compared to that of the APOA5 with
APOA5/APOC3ratio of 1.3.
In our study, we found that the crude extracts from the
T. indica fruit pulp up-regulated the expression of genes that code for apoA-IV, apo A-V and ABCG5. Since the methanol extracts up-regulated three genes, we postulated that there are components in the crude extracts that may act as PPARalpha agonist which can regulate TG and HDL levels and may eventually be able to be used as a lipid-lowering agent. It is postulated that there may be compo-nents in the extracts that could also regulate cholesterol homeostasis by increasing the expression of the ABCG5 gene that could promote biliary cholesterol secretion and reduce dietary cholesterol absorption which could poten-tially be used to reduce TG levels in blood and help to prevent coronary heart disease.
We also found that the crude extract down-regulated the expression of the MTTP gene that codes for microsomal
triglyceride transfer protein (MTTP). MTTP is required for the assembly and secretion of TG-rich lipoproteins from both enterocytes and hepatocytes. MTTP inhibitor, JTT-130, had been shown to lower plasma lipid mainly plasma TG [1]. The inhibition of MTTP gene expression, espe-cially in the intestine, may subsequently lead to reduction in the levels of cholesterol in blood.
Other genes that were down-regulated in response to the extracts of the T. indica pulp were PDE3A, PTTG1 and
CYP1A1. PDE3 is one of the phosphodiesterases (PDEs) that regulate intracellular concentrations of second mes-sengers, cAMP and cGMP, by catalysing the hydrolysis of their 30-50-phosphodiester bond [1]. The PDE3 family comprises 2 genes, thePDE3Aand PDE3B. The PDE3A has higher affinity towards cAMP than cGMP and is directly inhibited by cGMP [19]. Known inhibitors of the PDE3 include cilostamide and milrinone, but these inhib-itors do not differentiate between PDE3A and PDE3B [3]. The crude extracts of theT. indicafruit pulp suppressed the expression of only thePDE3A, by 5.1-fold, suggesting that the extracts contain bioactive compound(s) that is (are) selective inhibitor(s) ofPDE3A.
PTTG1 is an oncogene involved in cell cycle regulation and sister chromatid separation [31]. High levels of PTTG1 expression have been reported in various tumours including thyroid, pituitary, lung, colon, oesophagus, ovary and breast [16,40,47]. Studies had shown that nude mice developed cancer when subcutaneously injected with PTTG1-trans-fected cells [32]. CYP1A1 is one of the most important detoxification enzymes, but it is also capable of generating carcinogenic intermediate metabolites from polycyclic aromatic hydrocarbons [20]. Resveratrol, an antioxidant widely found in fruits such as grapes, was found to inhibit the transcription ofCYP1A1in the HepG2 cells supposedly by preventing the activation of aryl hydrocarbon receptor [10]. Our microarray results showed that the crude extracts of theT. indicafruit pulp have the potential application as a chemotherapeutic agent for the treatment of cancer through the inhibition of the transcription ofCYP1A1 andPTTG1
genes. In addition, a set of genes that are involved in reg-ulating the cell cycle checkpoints namely the cyclins,
CCNG1, CCNG2, CCNA2, CCNB1, CCNB2 and CDC2
were also significantly down-regulated.
In conclusion, low concentration ofT. indicafruit pulp extracts was able to significantly regulate a total of 1501 genes. Amongst the up-regulated genes were those that code for the metallothioneins and glutathione S-transfer-ases which are well known for their stress response activ-ities. The extracts may act as hypolipidaemic agents by regulating the expression ofAPOA4,APOA5,ABCG5and
MTTPgenes. The fruit pulp extracts also have anti-cancer potential by regulating genes involved in the cell cycle checkpoints.
Acknowledgments This study was funded by the following research grants: EScience Fund (12-03-02-2061) from the Ministry of Science, Technology and Innovation Malaysia (MOSTI), FRGS (FP004/2003C) from the Ministry of Higher Education Malaysia (MOHE), Postgraduate Research Fund (PS166/2008C) and Tutorship from the University of Malaya. We would like to thank Mr. Siah Eng Tian for the technical assistance on the microarray analysis.
Open Access This article is distributed under the terms of the Creative Commons Attribution Noncommercial License which per-mits any noncommercial use, distribution, and reproduction in any medium, provided the original author(s) and source are credited.
References
1. Aggarwal D, West KL, Zern TL, Shrestha S, Vergara-Jimenez M, Fernandez ML (2005) JTT-130, a microsomal triglyceride transfer protein (MTP) inhibitor lowers plasma triglycerides and LDL cholesterol concentrations without increasing hepatic tri-glycerides in guinea pigs. BMC Cardiovasc Disord 5:30 2. Berridge MV, Herst PM, Tan AS (2005) Tetrazolium dyes as
tools in cell biology: new insights into their cellular reduction. Biotechnol Annu Rev 11:127–152
3. Bhattacharyya AK, Connor WE (1974) Beta-sitosterolemia and xanthomatosis. A newly described lipid storage disease in two sisters. J Clin Invest 53(4):1033–1043
4. Bjorkhem I, Starck L, Andersson U, Lutjohann D, von Bahr S, Pikuleva I, Babiker A, Diczfalusy U (2001) Oxysterols in the circulation of patients with the Smith-Lemli-Opitz syndrome: abnormal levels of 24S- and 27-hydroxycholesterol. J Lipid Res 42(3):366–371
5. Bounous DI, Campagnoli RP, Brown J (1992) Comparison of MTT colorimetric assay and tritiated thymidine uptake for lym-phocyte proliferation assays using chicken splenocytes. Avian Dis 36(4):1022–1027
6. Cai L, Klein JB, Kang YJ (2000) Metallothionein inhibits per-oxynitrite-induced DNA and lipoprotein damage. J Biol Chem 275(50):38957–38960
7. Cao YH, Cao RH (1999) Angiogenesis inhibited by drinking tea. Nature 398(6726):381
8. Chan HM, Cherian MG (1992) Protective roles of metallothio-nein and glutathione in hepatotoxicity of cadmium. Toxicology 72(3):281–290
9. Chan PT, Fong WP, Cheung YL, Huang Y, Ho WK, Chen ZY (1999) Jasmine green tea epicatechins are hypolipidemic in hamsters (Mesocricetus auratus) fed a high fat diet. J Nutr 129(6):1094–1101
10. Ciolino HP, Daschner PJ, Yeh GC (1998) Resveratrol inhibits transcription of CYP1A1 in vitro by preventing activation of the aryl hydrocarbon receptor. Cancer Res 58(24):5707–5712 11. Coyle P, Philcox JC, Carey LC, Rofe AM (2002)
Metallothio-nein: the multipurpose protein. Cell Mol Life Sci 59(4):627–647 12. Del Bas JM, Ricketts ML, Baiges I, Quesada H, Ardevol A, Salvado MJ, Pujadas G, Blay M, Arola L, Blade C, Moore DD, Fernandez-Larrea J (2008) Dietary procyanidins lower triglyc-eride levels signaling through the nuclear receptor small hetero-dimer partner. Mol Nutr Food Res 52(10):1172–1181
13. Eaton DL, Bammler TK (1999) Concise review of the glutathione S-transferases and their significance to toxicology. Toxicol Sci 49(2):156–164
coronary artery disease and healthy controls. J Lipid Res 44(8):1523–1529
15. Fallon AM, Hellestad VJ (2008) Standardization of a colorimetric method to quantify growth and metabolic activity of Wolbachia-infected mosquito cells. In Vitro Cell Dev Biol Anim 44(8–9): 351–356
16. Hamid T, Malik MT, Kakar SS (2005) Ectopic expression of PTTG1/securin promotes tumorigenesis in human embryonic kidney cells. Mol Cancer 4(1):3
17. Heimerl S, Langmann T, Moehle C, Mauerer R, Dean M, Beil FU, von Bergmann K, Schmitz G (2002) Mutations in the human ATP-binding cassette transporters ABCG5 and ABCG8 in sitosterolemia. Hum Mutat 20(2):151
18. Hollman PC, de Vries JH, van Leeuwen SD, Mengelers MJ, Katan MB (1995) Absorption of dietary quercetin glycosides and quercetin in healthy ileostomy volunteers. Am J Clin Nutr 62(6):1276–1282
19. Hubacek JA, Berge KE, Cohen JC, Hobbs HH (2001) Mutations in ATP-cassette binding proteins G5 (ABCG5) and G8 (ABCG8) causing sitosterolemia. Hum Mutat 18(4):359–360
20. Ito S, Chen C, Satoh J, Yim S, Gonzalez FJ (2007) Dietary phytochemicals regulate whole-body CYP1A1 expression through an arylhydrocarbon receptor nuclear translocator-dependent system in gut. J Clin Invest 117(7):1940–1950 21. Kahkonen MP, Hopia AI, Vuorela HJ, Rauha JP, Pihlaja K,
Kujala TS, Heinonen M (1999) Antioxidant activity of plant extracts containing phenolic compounds. J Agric Food Chem 47(10):3954–3962
22. Landi Librandi AP, Chrysostomo TN, Azzolini AE, Recchia CG, Uyemura SA, de Assis-Pandochi AI (2007) Effect of the extract of the tamarind (Tamarindus indica) fruit on the complement system: studies in vitro and in hamsters submitted to a choles-terol-enriched diet. Food Chem Toxicol 45(8):1487–1495 23. Liang Y, Jiang XC, Liu R, Liang G, Beyer TP, Gao H, Ryan TP,
Dan Li S, Eacho PI, Cao G (2004) Liver X receptors (LXRs) regulate apolipoprotein AIV-implications of the antiatheroscle-rotic effect of LXR agonists. Mol Endocrinol 18(8):2000–2010 24. Lo CM, Zhang DM, Pearson K, Ma L, Sun W, Sakai RR,
Davidson WS, Liu M, Raybould HE, Woods SC, Tso P (2007) Interaction of apolipoprotein AIV with cholecystokinin on the control of food intake. Am J Physiol Regul Integr Comp Physiol 293(4):R1490–R1494
25. Mannucci L, Guardamagna O, Bertucci P, Pisciotta L, Libera-toscioli L, Bertolini S, Irace C, Gnasso A, Federici G, Cortese C (2007) Beta-sitosterolaemia: a new nonsense mutation in the ABCG5 gene. Eur J Clin Invest 37(12):997–1000
26. Martinello F, Soares SM, Franco JJ, Santos AC, Sugohara A, Garcia SB, Curti C, Uyemura SA (2006) Hypolipemic and anti-oxidant activities fromTamarindus indicaL. pulp fruit extract in hypercholesterolemic hamsters. Food Chem Toxicol 44(6):810– 818
27. Morton JF (1958) The tamarind (Tamarindus indicaL.) its food, medicinal and industrial uses. In: Proceedings of the Florida state horticultural society, vol 71, pp 288–294
28. Mosmann T (1983) Rapid colorimetric assay for cellular growth and survival: application to proliferation and cytotoxicity assays. J Immunol Methods 65(1–2):55–63
29. Mukherjee B, Salavaggione OE, Pelleymounter LL, Moon I, Eckloff BW, Schaid DJ, Wieben ED, Weinshilboum RM (2006) Glutathione S-transferase omega 1 and omega 2 pharmacoge-nomics. Drug Metab Dispos 34(7):1237–1246
30. Nagasawa M, Akasaka Y, Ide T, Hara T, Kobayashi N, Utsumi M, Murakami K (2007) Highly sensitive upregulation of apoli-poprotein A-IV by peroxisome proliferator-activated receptor alpha (PPARalpha) agonist in human hepatoma cells. Biochem Pharmacol 74(12):1738–1746
31. Panguluri SK, Yeakel C, Kakar SS (2008) PTTG: an important target gene for ovarian cancer therapy. J Ovarian Res 1(1):6 32. Pei L, Melmed S (1997) Isolation and characterization of a
pituitary tumor-transforming gene (PTTG). Mol Endocrinol 11(4):433–441
33. Pennacchio LA, Olivier M, Hubacek JA, Cohen JC, Cox DR, Fruchart JC, Krauss RM, Rubin EM (2001) An apolipoprotein influencing triglycerides in humans and mice revealed by com-parative sequencing. Science 294(5540):169–173
34. Prieur X, Lesnik P, Moreau M, Rodriguez JC, Doucet C, Chapman MJ, Huby T (2009) Differential regulation of the human versus the mouse apolipoprotein AV gene by PPARalpha. Implications for the study of pharmaceutical modifiers of hypertriglyceridemia in mice. Biochim Biophys Acta 1791(8):764–771
35. Priore Oliva C, Pisciotta L, Li Volti G, Sambataro MP, Cantafora A, Bellocchio A, Catapano A, Tarugi P, Bertolini S, Calandra S (2005) Inherited apolipoprotein A-V deficiency in severe hyper-triglyceridemia. Arterioscler Thromb Vasc Biol 25(2):411–417 36. Qin X, Swertfeger DK, Zheng S, Hui DY, Tso P (1998)
Apoli-poprotein AIV: a potent endogenous inhibitor of lipid oxidation. Am J Physiol 274((5 Pt 2)):H1836–H1840
37. Razali N, Razab R, Junit SM, Aziz AA (2008) Radical scav-enging and reducing properties of extracts of cashew shoots (Anacardium occidentale). Food Chem 111(1):38–44
38. Repa JJ, Berge KE, Pomajzl C, Richardson JA, Hobbs H, Mangelsdorf DJ (2002) Regulation of ATP-binding cassette sterol transporters ABCG5 and ABCG8 by the liver X receptors alpha and beta. J Biol Chem 277(21):18793–18800
39. Romero L, Andrews K, Ng L, O’Rourke K, Maslen A, Kirby G (2006) Human GSTA1-1 reduces c-Jun N-terminal kinase sig-nalling and apoptosis in Caco-2 cells. Biochem J 400(1):135–141 40. Salehi F, Kovacs K, Scheithauer BW, Lloyd RV, Cusimano M (2008) Pituitary tumor-transforming gene in endocrine and other neoplasms: a review and update. Endocr Relat Cancer 15(3):721– 743
41. Schultze AE, Alborn WE, Newton RK, Konrad RJ (2005) Administration of a PPARalpha agonist increases serum apoli-poprotein A-V levels and the apoliapoli-poprotein A-V/apoliapoli-poprotein C-III ratio. J Lipid Res 46(8):1591–1595
42. Shah PK (2003) Emerging non-statin LDL-lowering therapies for dyslipidemia and atherosclerosis. Rev Cardiovasc Med 4(3):136– 141
43. Shu X, Chan J, Ryan RO, Forte TM (2007) Apolipoprotein A-V association with intracellular lipid droplets. J Lipid Res 48(7):1445–1450
44. Sudjaroen Y, Haubner R, Wu¨rtele G, Hull WE, Erben G, Spiegelhalder B, Changbumrung S, Bartsch H, Owen RW (2005) Isolation and structure elucidation of phenolic antioxidants from Tamarind (Tamarindus indicaL.) seeds and pericarp. Food Chem Toxicol 43(11):1673–1682
45. Suksomtip M, Pongsamart S (2008) Protective effect against oxidation of human low-density lipoprotein and plasmid DNA strand scission of Tamarind seed coat extract in vitro. LWT Food Science and Technology 41(10):2002–2007
46. Tesoriere L, Allegra M, Butera D, Livrea MA (2004) Absorption, excretion, and distribution of dietary antioxidant betalains in LDLs: potential health effects of betalains in humans. Am J Clin Nutr 80(4):941–945
47. Ying H, Furuya F, Zhao L, Araki O, West BL, Hanover JA, Willingham MC, Cheng SY (2006) Aberrant accumulation of PTTG1 induced by a mutated thyroid hormone beta receptor inhibits mitotic progression. J Clin Invest 116(11):2972–2984 48. Yu L, Li-Hawkins J, Hammer RE, Berge KE, Horton JD, Cohen