R E S E A R C H P A P E R
Validating nutrient-related gene expression changes
from microarrays using RT
2PCR-arrays
S. GajÆL. EijssenÆ R. P. MensinkÆ C. T. A. Evelo
Received: 8 October 2008 / Accepted: 12 November 2008 / Published online: 26 November 2008
ÓThe Author(s) 2008. This article is published with open access at Springerlink.com
Abstract Microarray technology allows us to perform high-throughput screening of changes in gene expression. The outcome of microarray experiments largely depends on the applied analysis methods and cut-off values chosen. Results are often required to be verified using a more sensitive detection technique, such as quantitative real-time PCR (qPCR or RT-PCR). Throughout the years, this technique has become a de facto golden standard. Indi-vidual qPCRs are time-consuming, but the technology to perform high-throughput qPCR reactions has become available through PCR-arrays that allow up to 384 PCR reactions simultaneously. Our current aim was to investi-gate the usability of a RT2 ProfilerTM PCR-array as validation in a nutritional intervention study, where the measured changes in gene expression were low. For some differentially expressed genes, the PCR-array confirmed the microarray prediction, though not for all. Furthermore, the PCR-array allowed picking up the expression of genes that were not measurable on the microarray platform but also vice versa. We conclude that both techniques have
their own (dis)advantages and specificities, and for less pronounced changes using both technologies may be useful as complementation rather than validation.
Keywords Human PBMCMicroarrayNutrigenomics qPCRRT-PCRValidation
Introduction
Gene expression microarrays have become the leading technology to evaluate changes in genome wide gene expression under different conditions. To confirm results from microarray studies, a selection of differentially expressed genes of interest is generally verified using a highly sensitive technique, mostly a quantitative real-time reverse transcriptase PCR (RT-PCR/qPCR) reaction [8, 21]. Even though qPCR is considered to be a ‘‘golden standard’’ or a necessary validation [11,15,16,19,20], it has also been stated that qPCR results are not always better [2] or validation is not always necessary [21]. In a qPCR reaction, cDNA is synthesised from mRNA molecules present in the sample, which is then amplified exponen-tially using a combination of gene-specific primers, labelled nucleotides and the DNA polymerase enzyme, theoretically doubling the amount of cDNA at every cycle. Upon analysis, the expression level of the target gene is computed relative to the expression level of one or more reference genes, often housekeeping genes. Selecting proper housekeeping genes is one of the most critical aspects of the analysis, since they need to be constantly expressed between all samples and conditions in the experiment. A survey of publications reveals a wide range in correlations between microarray and qPCR results [3–7, 12,19].
Electronic supplementary material The online version of this article (doi:10.1007/s12263-008-0094-1) contains supplementary material, which is available to authorized users.
S. Gaj (&)R. P. Mensink
Nutrigenomics Consortium, Top Institute Food and Nutrition, Wageningen, The Netherlands
e-mail: [email protected]
S. GajR. P. Mensink
Department of Human Biology, Maastricht University, PO Box 616, 6200 MD Maastricht, The Netherlands
S. GajL. EijssenC. T. A. Evelo
Department of Bioinformatics, BiGCaT, Maastricht University, PO Box 616, 6200 MD Maastricht, The Netherlands
To allow qPCR in a more high-throughput way, several companies have developed a practical solution to perform up to 384 qPCR reactions on one single plate, such as the TaqManTM Gene Expression Arrays from Applied Bio-systems and RT2 ProfilerTM PCR Array System from SABiosciences. PCR-arrays have mainly been used in cancer research, but also in some other fields, for example, drug metabolism [13]. At the time of writing, 74 RT2 ProfilerTM PCR-arrays are catalogued that contain primer sequences for genes belonging to a specific function, structure or pathway (e.g., apoptosis, common cytokines, NF-jB signalling pathway) or disease (e.g., cancer). In addition, arrays can be custom-made. For the 96-well system, every plate contains five housekeeping genes (B2M, HPRT1, RPL13a, GADPH and ACTB), three positive PCR controls, three reverse transcriptase controls and one control to detect the presence of genomic cDNA contamination. Correlations between results of several RT2 Profiler PCR-arrays and qPCR have been reported to be good [3,13].
In human nutritional intervention studies, the response of a given diet on gene expression can be minimal. Most publications in this field make use of qPCR to validate a few genes of interest [14,18], but no larger scale approa-ches have been used. The goal of this study is to evaluate if for this purpose a PCR-array can be used in a dietary intervention study where the expected changes are small.
Materials and methods
This paper elaborates on a study investigating the rela-tionship between diet and inflammation [10]. For microarray analysis, mRNAs from peripheral mononuclear blood cell (PBMC) samples of eight obese subjects were collected. These subjects participated in both the fish oil (FishOil) and weight loss (WeightLoss) interventions. More details about the study design are provided in the original paper [10].
RNA was pooled with the control (Cy3) being the control diet and with either the WeightLoss or FishOil end-point as Cy5. RNA quantity and purity were determined using the NanoDrop ND-2000 (Nanodrop Technologies, Wilmington, DE, USA), and RNA integrity was assessed by determining the RNA 28S/18S ratio using the Bioana-lyzer 2100 (Agilent Technologies, Santa Clara, CA, USA). Pooled RNA samples were hybridised to Agilent Human 1A G4110B microarrays, containing 22,575 reporters. This was done according to a dye-flip design, resulting in a total number of four arrays. Array quality control was performed in Spotfire DecisionSite 9.0 and R 2.5.1 using the limma library version 2.10.5 [17]. Reporters passed quality con-trol when (1) signals of both channels consisted of more
than 55 pixels; (2) both signals were higher than 2.6 times the standard deviation of the local background and (3) at least one signal was not saturated. All further data analyses were performed in R. Within-array normalisation was performed by using the LOESS algorithm. Next, a linear model was fitted for every reporter and a moderatedttest was performed. To ensure microarray reporter specificity, all reporters were reannotated using stable UniProt and EnsEMBL identifiers [9].
Microarray results were validated using a specific PCR-array (SABiosciences, Frederick, USA) that met two cri-teria. We selected all human PCR-arrays that contained a relatively large number of genes that were differentially expressed (P value\0.05 and |FC|[1.2) by the two treatment comparisons performed in the microarray study and that contained a gene set that was related to the observed changes in plasma metabolic parameters. Based on the outcome, the 96-well plate Human Common Cyto-kines PCR-array (PAHS-021) was selected.
The mRNA of each individual was converted into cDNA using the RT2 First Strand Kit (SABiosciences, Frederick, USA). This cDNA was then added to the RT2 SYBR Green qPCR Master Mix (SABiosciences, Freder-ick, USA). Next, each sample was aliquotted on 24 Human Common Cytokine PCR-arrays. All steps were done according to the manufacturer’s protocol for the ABI Prism 7000 Sequence Detection System. RNA quality was good, with 260/280 ratios slightly higher than 2.0 and 260/230 ratios slightly higher than 1.8. To analyze the PCR-array data, an MS-Excel sheet with macros was downloaded from the manufacturer’s website (http://www. sabiosciences.com/pcrarraydataanalysis.php). The website also allowed online analysis. We preferred to use offline calculations since it was not possible to save the results online, and even more importantly because it was easier to track the formulas and to understand what was being done. For each PCR reaction, the Excel sheet calculated two normalised averageCtvalues, a pairedttestPvalue and a
fold change. To filter out undetectable genes, an extra quality check was added by us: for each intervention, the PCR gene product was flagged as either ‘‘good’’ or ‘‘bad’’. A gene was considered good when in both the control and the dietary intervention the difference between the mea-sured genomic cDNA Ct value (maximum 35) and the
measuredCtvalue of the gene was at least three cycles in
correcting allCtvalues for the averageCtvalues of several
constantly expressed housekeeping genes (HKGs) present on the array. PCR-array analysis results were evaluated and also compared to the outcome of the gene expression microarrays.
Results and discussion
In our current analysis, only four HKGs (HPRT1, RPL13A, GAPDH and ACTB) were used for normalisation. Beta-2-microglobulin (B2M) was not included, since it was signif-icantly altered on the PCR-array after the weight loss period. Applying the flagging criteria resulted in finding 29 and 33 detectable genes after the FishOil and the WeightLoss intervention, respectively. All detected genes in the FishOil intervention were also measured accurately in the Weight-Loss comparison. The flagging procedure removed several observations that were most likely caused by failing ampli-fications, since only one value of one subject was undetectable (Ct[35). Note however that in some cases this
flagging may be somewhat conservative: for example, for two subjects in the FishOil experiment, the IFNK gene changed from baseline undetected (Ct=35) toCtvalues of
30.27 and 30.72 cycles. All other subjects had a nearly constantCtvalue ranging between 29.5 and 29.8 cycles. The
same pattern occurred for two subjects, and therefore it could well be a real biological effect. In general, the measurements obtained by the PCR-array were consistent between subjects and show very small variation, as in regular qPCR.
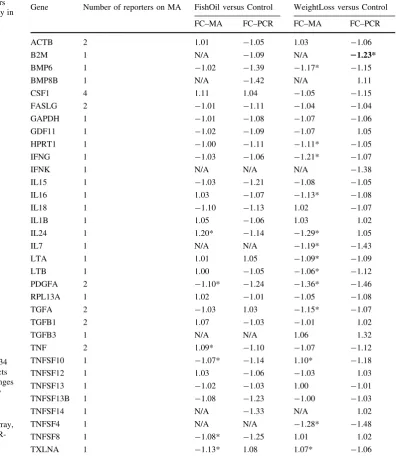
Table1 summarizes our findings with respect to the detectable genes on the PCR-array and their corresponding microarray values. The coverage of the detected PCR genes on the reannotated microarray was 100%. Seven PCR genes were present more than once on the Agilent micro-array platform. For two of those genes (FASLG and TNF) their corresponding reporters on the microarray were identical, specific, and showed only a slight difference in fold change. The other five genes (ACTB, CSF1, PDGFA, TFGA and TFGB1) had two different microarray reporter sequences that align to different parts of the gene product. For these seven genes, the fold change for the highest expressed reporter was chosen to represent the gene on the microarray. It was not possible to measure the expression of five of the PCR-measured genes on the microarray: two genes (B2M, TNFSF14) were always saturated, whereas the other three (BMP8B, CSF1, IFNK) were filtered out during microarray quality control due to a too low back-ground-corrected intensity value. All other genes on the PCR-array, apart from IFNA1, were also present on the reannotated microarray, where IFNA4 was only covered by reporters targeting several of its family members as well. Within the complete list of genes (cf. Supplementary
Table 1), only*10% of genes detected on the PCR-array could not be detected on the microarray. Conversely, *50% of genes, for which primers were available on the PCR-arrays, could be detected on the microarray but not on the PCR-array. This result contradicts the original hypothesis of a better sensitivity of qPCR in comparison to microarray [1,19]. This could be explained by the different criteria used and may point to the fact that a required threefold difference inCt value compared to the genomic
control, as suggested by the manufacturer, is too strict. However, this cannot offer an explanation for all the findings, illustrated by the INHA gene, which was detect-able on the microarray in low concentrations and significant for all comparisons, but had Ctvalues of*35
on the PCR-array. On the other hand, with highly expres-sed genes, the microarray measurements were sometimes saturated. This saturation did not occur on the qPCR. Thus, the reported lower dynamic range of microarray measure-ments [1,19] was confirmed for this end of the spectrum. In principle, a simple rescanning of the array at a lower scanning intensity could overcome this problem. However, such rescanning procedures have to be done shortly after hybridisation, and in our experience, in practice, this is not often done. We did not observe that array performance would be especially lower with lower expression levels or fold changes, as reported before [1,5–7,15, 19], though several authors also found acceptable detection levels of lower fold changes or expression levels or less correlation between expression and accuracy [6,19,20]. In our study, consistency in direction of change between both methods remained high down to the 10% change range for the qPCR. Finally, even though a trend of the microarray in estimating smaller fold changes as compared to qPCR was observed [6,22], the difference was quite limited.
gene, showing opposite values for both comparisons. Bad annotation or crosshybridisation are unlikely causes for this inconsistency, since both arrays were very carefully annotated in our study, as the microarray contains specific probes for this gene, and the PCR primers were designed to be specific for all gene variants. It may however be explained by a possible difference in splice variants detected by the two technologies, as IL24 has more than one associated transcript. It is known that between-plat-form consistency decreases with different primers [5,6,19] or increased distance on the sequence between them [7]. Unfortunately, since the primer sequences of the PCR products are not publicly available, we cannot verify this possible cause of discrepancy.
In conclusion, we have observed consistencies and dif-ferences between results obtained by two different technologies. In general, we could not observe a better detection level of the PCR-array, though this may be caused by the chosen quality criteria set. Especially with different probes/primers, it is hard to decide which tech-nology gives a more accurate measurement. Different results may be considered complementary instead of con-tradictory. Especially, for nutritional studies, where effects can be expected to be small, one could argue that running a microarray with a broader coverage could be followed by using a PCR-array focused at a specific process, to possibly detect extra transcripts. However, current and future costs will also play a role in the choice of the platforms to be
Table 1 Detectable reporters on RT2ProfilerTMPCR-array in human PBMCs
Calculated fold changes of 34 detectable PCR gene products as compared to the fold changes derived from the microarray experiment for each intervention
FCfold change,MAmicroarray,
N/Anot available,PCR PCR-array
*P\0.05
Gene Number of reporters on MA FishOil versus Control WeightLoss versus Control FC–MA FC–PCR FC–MA FC–PCR ACTB 2 1.01 -1.05 1.03 -1.06 B2M 1 N/A -1.09 N/A 21.23* BMP6 1 -1.02 -1.39 -1.17* -1.15
BMP8B 1 N/A -1.42 N/A 1.11
CSF1 4 1.11 1.04 -1.05 -1.15 FASLG 2 -1.01 -1.11 -1.04 -1.04 GAPDH 1 -1.01 -1.08 -1.07 -1.06 GDF11 1 -1.02 -1.09 -1.07 1.05 HPRT1 1 -1.00 -1.11 -1.11* -1.05 IFNG 1 -1.03 -1.06 -1.21* -1.07
IFNK 1 N/A N/A N/A -1.38
IL15 1 -1.03 -1.21 -1.08 -1.05 IL16 1 1.03 -1.07 -1.13* -1.08 IL18 1 -1.10 -1.13 1.02 -1.07
IL1B 1 1.05 -1.06 1.03 1.02
IL24 1 1.20* -1.14 -1.29* 1.05
IL7 1 N/A N/A -1.19* -1.43
LTA 1 1.01 1.05 -1.09* -1.09 LTB 1 1.00 -1.05 -1.06* -1.12 PDGFA 2 -1.10* -1.24 -1.36* -1.46 RPL13A 1 1.02 -1.01 -1.05 -1.08 TGFA 2 -1.03 1.03 -1.15* -1.07 TGFB1 2 1.07 -1.03 -1.01 1.02
TGFB3 1 N/A N/A 1.06 1.32
TNF 2 1.09* -1.10 -1.07 -1.12 TNFSF10 1 -1.07* -1.14 1.10* -1.18 TNFSF12 1 1.03 -1.06 -1.03 1.03 TNFSF13 1 -1.02 -1.03 1.00 -1.01 TNFSF13B 1 -1.08 -1.23 -1.00 -1.03
TNFSF14 1 N/A -1.33 N/A 1.02
utilized. Finally, we conclude that PCR-arrays should not be considered a perfect validation tool, since both array technologies have their own specific detection limits and neither can be considered to be the real golden standard.
Acknowledgments This research was partly funded by the Nutri-genomics Consortium of the Top Institute Food and Nutrition (TIFN), the Dutch BSIK Fund and NuGO. The authors would like to express their thanks to M. Hulsbosch for performing the PCR-array experi-ments. We also thank the support staff at Tebu-Bio Netherlands for their helpful suggestions during the data analysis.
Conflict of interest statement The authors declare no conflicts of interest.
Open Access This article is distributed under the terms of the Creative Commons Attribution Noncommercial License which per-mits any noncommercial use, distribution, and reproduction in any medium, provided the original author(s) and source are credited.
References
1. Allanach K, Mengel M, Einecke G, Sis B, Hidalgo LG, Mueller T, Halloran PF (2008) Comparing microarray versus RT-PCR assessment of renal allograft biopsies: similar performance despite different dynamic ranges. Am J Transplant 8:1006–1015 2. Allison DB, Cui X, Page GP, Sabripour M (2006) Microarray data analysis: from disarray to consolidation and consensus. Nat Rev Genet 7:55–65
3. Arikawa E, Sun Y, Wang J, Zhou Q, Ning B, Dial SL, Guo L, Yang J (2008) Cross-platform comparison of SYBR Green real-time PCR with TaqMan PCR, microarrays and other gene expression measurement technologies evaluated in the Micro-Array Quality Control (MAQC) study. BMC Genomics 9:328 4. Beckman KB, Lee KY, Golden T, Melov S (2004) Gene
expression profiling in mitochondrial disease: assessment of microarray accuracy by high-throughput Q-PCR. Mitochondrion 4:453–470
5. Canales RD, Luo Y, Willey JC, Austermiller B, Barbacioru CC, Boysen C, Hunkapiller K, Jensen RV, Knight CR, Lee KY, Ma Y, Maqsodi B, Papallo A, Peters EH, Poulter K, Ruppel PL, Samaha RR, Shi L, Yang W, Zhang L, Goodsaid FM (2006) Evaluation of DNA microarray results with quantitative gene expression platforms. Nat Biotechnol 24:1115–1122
6. Dallas PB, Gottardo NG, Firth MJ, Beesley AH, Hoffmann K, Terry PA, Freitas JR, Boag JM, Cummings AJ, Kees UR (2005) Gene expression levels assessed by oligonucleotide microarray analysis and quantitative real-time RT-PCR—how well do they correlate? BMC Genomics 6:59
7. Etienne W, Meyer MH, Peppers J, Meyer RA Jr (2004) Com-parison of mRNA gene expression by RT-PCR and DNA microarray. BioTechniques 36:618–620, 622, 624–616
8. Fathallah-Shaykh HM (2005) Microarrays: applications and pit-falls. Arch Neurol 62:1669–1672
9. Gaj S, van Erk A, van Haaften RI, Evelo CT (2007) Linking microarray reporters with protein functions. BMC Bioinformatics 8:360
10. Jellema A, Plat J, Mensink RP (2004) Weight reduction, but not a moderate intake of fish oil, lowers concentrations of inflamma-tory markers and PAI-1 antigen in obese men during the fasting and postprandial state. Eur J Clin Invest 34:766–773
11. Mackay IM (2004) Real-time PCR in the microbiology labora-tory. Clin Microbiol Infect 10:190–212
12. Morey JS, Ryan JC, Van Dolah FM (2006) Microarray valida-tion: factors influencing correlation between oligonucleotide microarrays and real-time PCR. Biol Proced Online 8:175–193 13. Ning B, Dial S, Sun Y, Wang J, Yang J, Guo L (2008) Systematic
and simultaneous gene profiling of 84 drug-metabolizing genes in primary human hepatocytes. J Biomol Screen 13:194–201 14. Olofsson LE, Orho-Melander M, William-Olsson L, Sjoholm K,
Sjostrom L, Groop L, Carlsson B, Carlsson LM, Olsson B (2008) C/EBP{alpha} in adipose tissue regulates genes in lipid and glucose metabolism and a genetic variation in C/EBP{alpha} is associated with serum levels of triglycerides. J Clin Endocrinol Metab (in press)
15. Park WD, Stegall MD (2007) A meta-analysis of kidney micro-array datasets: investigation of cytokine gene detection and correlation with rt-PCR and detection thresholds. BMC Genomics 8:88
16. Rajeevan MS, Ranamukhaarachchi DG, Vernon SD, Unger ER (2001) Use of real-time quantitative PCR to validate the results of cDNA array and differential display PCR technologies. Methods 25:443–451
17. Smyth GK (2005) Limma: linear models for microarray analysis. In: Gentleman VCR, Dudoit S, Irizarry R, Huber W (eds) Bio-informatics and computational biology solutions using R and bioconductor. Springer, New York, pp 397–420
18. Svensson PA, Gabrielsson BG, Jernas M, Gummesson A, Sjo-holm K (2008) Regulation of human aldoketoreductase 1C3 (AKR1C3) gene expression in the adipose tissue. Cell Mol Biol Lett 13(4):599–613
19. Wang Y, Barbacioru C, Hyland F, Xiao W, Hunkapiller KL, Blake J, Chan F, Gonzalez C, Zhang L, Samaha RR (2006) Large scale real-time PCR validation on gene expression measurements from two commercial long-oligonucleotide microarrays. BMC Genomics 7:59
20. Wurmbach E, Yuen T, Sealfon SC (2003) Focused microarray analysis. Methods 31:306–316
21. Yang YH, Speed T (2002) Design issues for cDNA microarray experiments. Nat Rev 3:579–588