M E T H O D
Open Access
Next Generation-Targeted Amplicon
Sequencing (NG-TAS): an optimised
protocol and computational pipeline for
cost-effective profiling of circulating
tumour DNA
Meiling Gao
1†, Maurizio Callari
1†, Emma Beddowes
1,2, Stephen-John Sammut
1, Marta Grzelak
1, Heather Biggs
2,
Linda Jones
2, Abdelhamid Boumertit
2, Sabine C. Linn
3, Javier Cortes
4,5, Mafalda Oliveira
5, Richard Baird
2,
Suet-Feung Chin
1*and Carlos Caldas
1,2*Abstract
Circulating tumour DNA (ctDNA) detection and monitoring have enormous potential clinical utility in oncology. We describe here a fast, flexible and cost-effective method to profile multiple genes simultaneously in low input cell-free DNA (cfDNA): Next Generation-Targeted Amplicon Sequencing (NG-TAS). We designed a panel of 377 amplicons spanning 20 cancer genes and tested the NG-TAS pipeline using cell-free DNA from two HapMap lymphoblastoid cell lines. NG-TAS consistently detected mutations in cfDNA when mutation allele fraction was > 1%. We applied NG-TAS to a clinical cohort of metastatic breast cancer patients, demonstrating its potential in monitoring the disease. The computational pipeline is available athttps://github.com/cclab-brca/NGTAS_pipeline.
Keywords:NG-TAS, ctDNA, Liquid biopsy, Mutation, Multiplexing, Deep sequencing, Computational pipeline, Cancer,
Heterogeneous
Background
Cell-free DNA (cfDNA) in plasma was first analysed in cancer patients nearly 50 years ago [1]. A fraction of cfDNA was shown to carry mutations found in the matched tumour and designated circulating tumour DNA (ctDNA) [1–3]. The utility of ctDNA as a non-invasive diagnostic, prognostic or predictive bio-marker in human cancer is now well documented [4–8].
The amount of cfDNA in plasma is usually low, and the ctDNA fraction is typically only 1–30%; hence, low mutant allele frequencies have to be detected. Human cancers are genetically heterogeneous, and mutations occur infrequently at recurrent hotspots. Therefore, in
most clinical scenarios (e.g. early diagnosis or monitor-ing of tumour evolution), high sensitivity and the simul-taneous investigation of multiple gene targets are desirable features of any ctDNA detection and quantita-tion method.
There is a range of methods for detecting mutations in ctDNA, with the target varying from a single nucleotide variant (SNV) to the whole genome. A widely used method to detect mutations in ctDNA is digital poly-merase chain reaction (dPCR) performed in microfluidic devices or water-in-oil droplet emulsions [9, 10]. Whilst dPCR is able to detect rare mutations with extremely high sensitivity, it is restricted by the number of targets that can be examined in a single reaction [11].
Several sequencing-based approaches have been devel-oped to incorporate multiple genomic loci, enabling de novo mutation identification in ctDNA. Previously, we described Targeted Amplicon Sequencing (TAm-Seq),
* Correspondence:[email protected]; [email protected]
†Meiling Gao and Maurizio Callari contributed equally to this work. 1Department of Oncology and Cancer Research UK Cambridge Institute, Li
Ka Shing Centre, University of Cambridge, Cambridge CB2 0RE, UK Full list of author information is available at the end of the article
which utilised 48 primer pairs to identify mutations in hotspots or selected regions of 6 key driver genes [12]. Whilst TAm-Seq is useful, it is limited to a small num-ber of targets. Capture-based sequencing methods can cover a larger number of genes (or the whole exome) but are costly at the sequencing coverage (> 300) re-quired to detect allele frequencies ~ 1%.
There are several ready-to-use commercial kits for ctDNA sequencing, which can cover up to hundreds of mutation hotspots and many genes. These include Invi-sion™(Inivata), Oncomine™cfDNA assay (Thermo Fisher Scientific), Guardant360™ (Guardant Health) and Plas-maSELECT™ (Personal Genome Diagnostics). These products are expensive and test custom gene panels. Disturbingly, a recent study comparing the performance of two of these commercial products (Guardant360™and PlasmaSELECT™) in a cohort of plasma samples from prostate cancer patients revealed poor agreement [13].
Recently, unique molecular barcodes have been devel-oped to tag each cfDNA template molecule before PCR amplification in order to reduce the error rate and allow robust detection of rare mutant alleles in ctDNA [14].
In summary, using current ctDNA profiling method-ology, the detection of mutations in a good number of cancer genes with sufficient sensitivity and in a cost-effective way poses significant challenges. Here, we describe a new method for the profiling of ctDNA, des-ignated Next Generation-Targeted Amplicon Sequencing (NG-TAS), with several unique features: (i) optimised for low input ctDNA; (ii) high level of multiplexing, en-abling the analyses of multiple gene targets; (iii) a be-spoke computational pipeline for data analysis; and (iv) very competitive costing. NG-TAS is designed to be flex-ible in terms of the choice of gene targets and regions of interest; thus, it can be tailored to various cancer types and clinical contexts.
Methods
Patient samples and blood processing
Patients were recruited from three different centres including Cambridge University Hospital, Netherland Cancer Institute (NKI) and Vall d’Hebron Institute of Oncology (VHIO). Metastatic breast cancer patients with hormone receptor-positive tumours were recruited as a part of a clinical trial (patient number = 30, plasma samples number = 366). Blood samples were collected in EDTA tubes and processed within 1 h to prevent lymphocyte lysis and fragmentation. Samples were cen-trifuged at 820gfor 10 min at room temperature to sep-arate the plasma from the peripheral blood cells. The plasma was further centrifuged at 1400g for 10 min to remove the remaining cells and cell debris. The plasma was stored at −80 °C until DNA extraction. This study was approved by the regulatory and ethics committees at
each site, and the reference number is NCT02285179 (https://clinicaltrials.gov/ct2/show/NCT02285179). All human samples used were collected after informed con-sent, and the study was fully compliant with the Helsinki Declaration.
DNA extraction from plasma and buffy coat
Plasma DNA was extracted between 2 and 4 ml of plasma with the QiaSymphony according to the manu-facturer’s instruction using Qiagen circulating DNA ex-traction kit. DNA was isolated from the buffy coat samples using DNeasy Blood & Tissue Kits (Qiagen).
Generation of cfDNA from NA12878 and NA11840
As previously reported [15], two lymphoblastoid cell lines, NA12878 and NA11840 from the Human Genome Diversity Project (HGDP)-CEPH collection, were ob-tained from the Coriell Cell Repository. A catalogue of highly accurate whole genome variant calls and homozy-gous reference calls has been derived for sample NA12878 by integrating independent sequencing data and the results of multiple pipelines (http://www.illumi na.com/platinumgenomes). NA11840 cell line was chosen from a set of 17 available CEPH cell lines in our laboratory as it shared the least number of SNPs with NA12878, to generate the maximum number of virtual somatic SNVs.
The cell lines were grown as a suspension in RPMI 1640-Glutamax (Invitrogen) supplemented with 10% foetal calf serum, 5% penicillin and streptomycin at 37 °C and 5% CO2. The media that the cell lines were grown in
were collected when cells were passaged. The media were centrifuged at 1500 rpm for 10 min at 4 °C to remove cells and cellular debris. The clarified media were stored at− 20 °C until required. Cell-free DNA was extracted from the thawed media using the Qiagen circulating DNA ex-traction kit (Qiagen) according to the manufacturer’s in-structions and quantified using Qubit High Sensitivity DNA quantification kit (Life Technologies). DNA from both cell lines was diluted to obtain 50 ng/μl stock con-centrations. To generate the serial dilutions of one cell line with the other, we mixed by volume to obtain the percent-age (volume/volume) as presented in Additional file 1: Table S1 (n= 12).
targeted by one of the amplicons showing no coverage; therefore, four SNVs were considered as identifiable ‘somatic variants’.
NGS library construction
NGS libraries were prepared from 3 to 5 ng of cfDNA using the ThruPLEX® Plasma-seq kit (Rubicon Genom-ics, USA) as described in the manufacturer’s instruc-tions. NGS library was quantified using qPCR KAPA Library Quantification kit (KAPA Biosystem), whilst the fragment size and the NGS library yield were measured with 2200 TapeStation instrument (Agilent).
Digital PCR
BioMark system from Fluidigm has been used for dPCR, and the analyses have been performed as previ-ously described [17]. As described in the manufacturer’s instructions, DNA samples were mixed with 2× Taq-Man® Gene Expression Master Mix (Life Technology, 4369016), 20× GE Sample Loading Reagent (Fluidigm, 85000746) and 20× gene-specific assays. The reaction mix was loaded on the qdPCR 37K™ IFC (Fluidigm, 100-6152). ForKRAS(G13D) andAKT1(E17K) mutant and wild-type PrimePCR™ ddPCR™ Mutation Assays were obtained from Bio-Rad (dHsaCP2000013 and
dHsaCP2000014, dHsaCP2000032 and dHsaCP200
0031, respectively). The PIK3CA andESR1 probes and primers were previously described [7, 18], and the pri-mer and probes used are listed in Additional file 1: Table S2.
NG-TAS protocol
Primer design for NG-TAS
Primers were designed with NCBI Primer-BLAST tool with Tm range of 59–61 °C. The universal primer se-quences (CS1 and CS2) were added at the 5′end of the de-signed primers. All primer pairs were tested alone and in multiplexed PCR reactions using 10 ng of TaqMan® Control Human Genomic DNA (Thermo Fisher Scientific) in 10μl reaction volumes. The coverage and performance of primers were analysed using 2200 TapeStation instru-ment (Agilent) and Hi-seq 4000. The primers were grouped together as 7-8plex, and primers in each group were chosen to target different genes in order to minimise non-specific amplification and cross-reactivity.
Access Array™microfluidic system
The 377 pairs of optimised primers were divided into 48 wells, with each well containing 7–8 pairs of primers for multiplexed PCR. Primers were diluted to the final con-centration of 1μM to make 20× primer solution. Four microlitres of the 20× primer solution from the 48 wells was added to the primer inlets of the Access Array™IFC (Fluidigm). For the sample inlets, pre-sample master mix
consisted of 2× Master Mix (Qiagen, 206143), 5× Q so-lution, 20× Access Array™ Loading Reagent (Fluidigm), and DNA sample was added. The loaded IFC then moved to FC1™Cycler (Fluidigm) for thermal cycles: 95 °C for 15 min, 30 cycles of 94 °C for 30 s, 59 °C for 90 s, 72 °C for 90 s and a final extension step 60 °C for 30 min. The reaction products were harvested using post-PCR IFC controller as described in the manufacturer’s instructions.
The harvested product was diluted (1:10) with water for further barcoding PCR. Barcoding PCR reaction master mix contains 2× Master Mix (Qiagen), a diluted harvested product from Access Array™, and Access Array™ Barcode Library for Illumina® Sequencers single direction for barcoding primers (Fluidigm, 100-4876). The thermal cycle for barcoding is 95 °C for 10 min, 15 cycles of 95 °C for 15 s, 60 °C for the 30 s, 72 °C for 1 min and a final extension step of 72 °C for 3 min. The PCR reaction was performed using T100™ Thermal Cy-cler (Bio-Rad).
Quantification and clean-up of barcode Access Array™harvest After barcoding PCR, all samples were analysed using 2200 TapeStation (Agilent) to measure the concentration and size of the products (average 260 bp). The PCR products were pooled and cleaned with AMPure XP beads (Beckman Coulter, A63880) following the manu-facturer’s instruction. Briefly, the samples were mixed with the magnetic beads to the ratio of 180:100 in vol-ume. The beads were washed twice with 80% ethanol and dried by incubating at 30 °C for 10 min. Then, the beads were eluted with water, and the cleaned PCR product was run on the E-Gel® 2% agarose gel (Thermo Fisher Scientific, G501802) for further size selection and extraction. The band between 200 and 300 bp was cut out, and DNA was isolated from the gel using the QIA-quick Gel Extraction kit (Qiagen, 28704), and 10–20 nM of the eluents was submitted for paired-end Hi-seq 4000 for sequencing.
Analysis of NG-TAS data
Quality control, alignment and BAM files annotation For each sequencing lane, quality control of raw data was performed using FastQC (http://www.bioinforma tics.babraham.ac.uk/projects/fastqc/). Up to 384 samples were multiplexed in a single sequencing lane and demul-tiplexing was performed using in-house software.
BAM files were locally realigned using the Genome Ana-lysis Toolkit (GATK, v 3.6). Reads were then assigned to the amplicon they belonged to using a custom javascript, in order to enable a per amplicon coverage and mutation calling analysis. Coverage was computed for each ampli-con in each sample using a custom java/R script. One amplicon (SF3B1_D0069_001) showed an extremely high rate of mismatches and indels in all the analysed samples; therefore, we excluded it from downstream analyses.
Mutation calling
Mutation calling was run separately for each amplicon in the panel. The core mutation calling was performed for each pair of plasma and normal samples (or NA12878 an NA11849 from the dilution series) using Mutect2 (included in GATK 3.6). The minPruning par-ameter was set at 5 to reduce computational time with no significant impact on the results. Besides the set of mutations passing all internal filters, we included those failing the following internal filters or a combination of them: ‘alt_allele_in_normal’, ‘clustered_events’, ‘homolo-gous_mapping_event’ and ‘multi_event_alt_allele_in_-normal’. On this set of candidate mutations, we applied the following filtering criteria: coverage in normal and plasma > 100×, alternative allele in normal < 1% and plasma/normal VAF ratio > 5. The core mutation calling was repeated for the three replicates generated for each pair, and only mutations called in at least two replicates were retained. For this set of mutations, we run Haploty-peCaller (included in GATK 3.6) to compute the average VAF across the three replicates and filter out mutations with an average VAF < 1% and an average plasma/normal ratio < 5 (Fig. 4a). An extra filter was introduced for FFPE samples, where C>T and G>A transitions with VAF < 15% were filtered out because likely to be a conse-quence of cytosine deamination caused by fixation.
In calling somatic mutations from a set of longitudinal samples from the same patient, we first repeated the above procedure for all samples. Then, HaplotypeCaller was run again to estimate in all samples the coverage and VAF of each mutation called in at least one of them. This was followed by a variant annotation step using Annovar. Finally, results obtained for all amplicons were merged to generate a single VCF file. A final filter was applied at the group level, that is, keeping only muta-tions that at least in one sample had VAF higher than 5% (Additional file1: Figure S1).
Results
Optimising targeted deep sequencing in cfDNA by NG-TAS
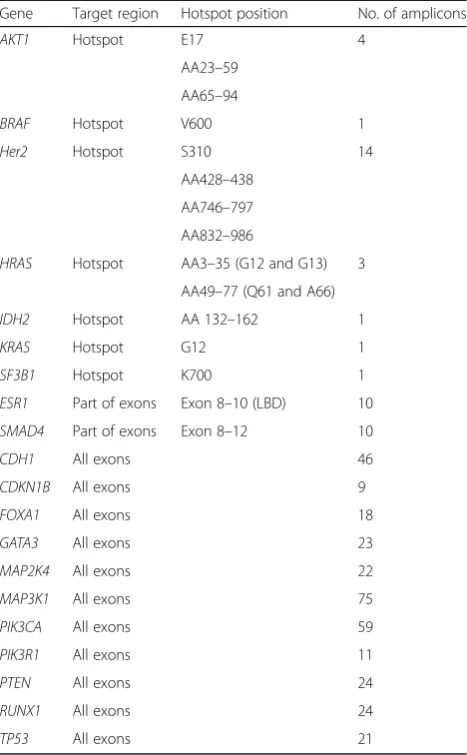
We designed 377 pairs of primers covering all exons or hotspots of 20 genes commonly mutated in breast can-cer (Table1). To identify the genes or hotspots of inter-est, we primarily looked at the comprehensive study
carried out in our lab (Pereira et al. Nat Comm 2016). Other genes (e.g.ESR1) were included because reported as frequently mutated in metastasis [19]. Since the aver-age cfDNA fragment size is 160–170 bp, NG-TAS primers were designed to generate amplicons of 69–157 bp (Additional file2).
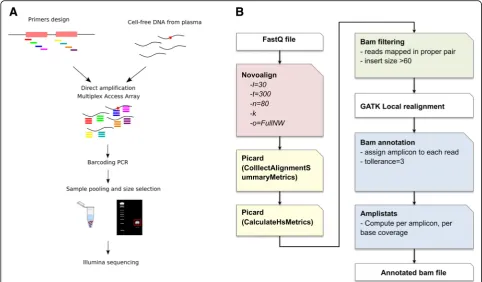
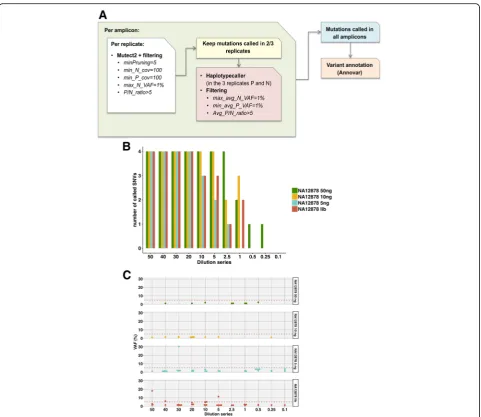
In a preliminary optimization step, individual primer pairs were tested in conventional single and multiplexed (7-8plex) PCR reactions. The NG-TAS experimental workflow (Fig. 1a), starts with a multiplexed PCR step (7–8 primer pairs) performed using Access Array™, a microfluidic system from Fluidigm. Each multiplexed re-action contained primers targeting different genes to minimise the generation of unwanted PCR products. The multiplexed PCR products were assessed using the Bioanalyser and 2200 TapeStation instrument (Agilent Genomics; Additional file 1: Figure S2). Multiplexed PCR products were then pooled and barcoded with 384 unique barcodes in a second PCR reaction. Barcoded products were pooled and size selected to remove Table 1List of genes and regions covered in the panel
Gene Target region Hotspot position No. of amplicons
AKT1 Hotspot E17 4
AA23–59 AA65–94
BRAF Hotspot V600 1
Her2 Hotspot S310 14
AA428–438 AA746–797 AA832–986
HRAS Hotspot AA3–35 (G12 and G13) 3 AA49–77 (Q61 and A66)
IDH2 Hotspot AA 132–162 1
KRAS Hotspot G12 1
SF3B1 Hotspot K700 1
ESR1 Part of exons Exon 8–10 (LBD) 10 SMAD4 Part of exons Exon 8–12 10
CDH1 All exons 46
CDKN1B All exons 9
FOXA1 All exons 18
GATA3 All exons 23
MAP2K4 All exons 22
MAP3K1 All exons 75
PIK3CA All exons 59
PIK3R1 All exons 11
PTEN All exons 24
RUNX1 All exons 24
primer dimers before submission for NGS paired-end 150 bp sequencing.
Raw sequencing data were aligned and processed as described in Fig. 1b and in the ‘Methods’ section. Spe-cific filters were applied to exclude reads from primer dimers or other PCR artefacts. Since the amplicons are partially overlapping, each read was assigned to its re-spective amplicon, to enable a per-amplicon analysis for coverage estimation and mutation calling.
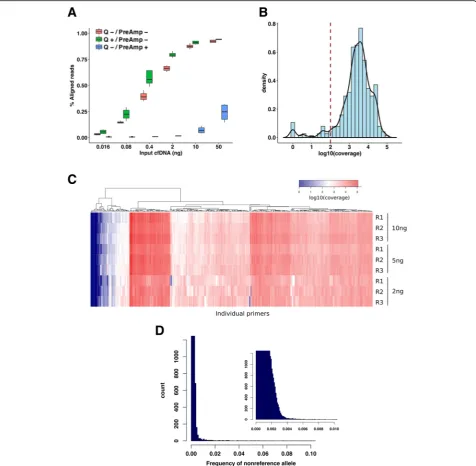
To optimise NG-TAS, we used cfDNA isolated from the culture media of the Platinum Genome HapMap NA12878 cell line. The size profile of cfDNA isolated from the tissue culture media was similar to that of plasma cfDNA (Additional file1: Figure S3). We tested a range of input cfDNA amounts with NG-TAS (0.016 to 50 ng) in four replicates for each input. For each cfDNA input, we tested (i) a pre-amplification step and (ii) the use of the Qiagen Q solution. To assess the data gener-ated, the percentage of aligned sequencing reads was com-puted (Fig. 2a). In the TAM-Seq protocol, addition of a pre-amplification step reduced the probability of nonspe-cific amplification and biased coverage [12]. However, using NG-TAS, the pre-amplification step reduced the percentage of aligned reads in all cfDNA input samples tested. Hence, we eliminated pre-amplification from the
NG-TAS protocol. Adding Q solution systematically in-creased the percentage of aligned reads, with the largest improvement observed with 0.4 and 2 ng input samples (Fig.2a). Thus, we incorporated the Q solution in all sub-sequent NG-TAS experiments.
We then used the optimised NG-TAS protocol in triplicate experiments for each input NA12878 cfDNA (2 ng, 5 ng and 10 ng). With 10 ng of input cfDNA, NG-TAS generated a median read depth of 3064×, and only 22/377 amplicons (5.8%) had coverage less than 100× (Fig. 2b). In fact, high amplicon coverage was observed irrespective of the amount of input cfDNA (Additional file 1: Figure S4A and S4B). The coverage heatmap of individual amplicons showed similar patterns with 10 ng and 5 ng cfDNA input. Strong consistency was observed within each triplicate (Fig. 2c). However, with 2 ng cfDNA input, we observed a stochastic reduc-tion in coverage for some of the amplicons. This is prob-ably due to a reduction in template availability, with the number of amplifiable copies approaching zero for some of the amplicons.
Sensitivity and specificity of mutation detection in control cfDNA
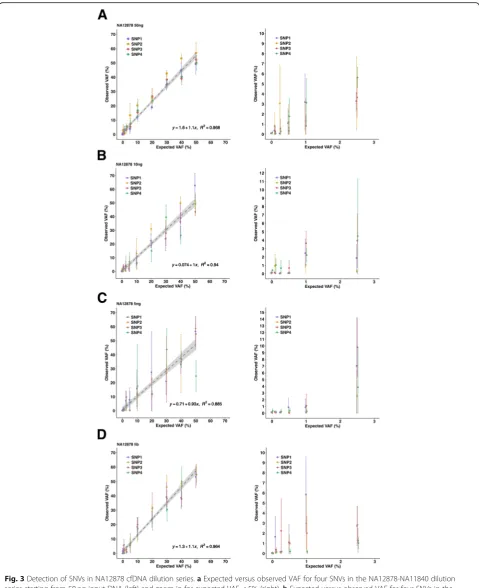
To establish an analysis pipeline and assess the perform-ance of NG-TAS, we generated a benchmark dilution series, similar to what we have previously described [15], using cfDNA collected from the tissue culture media from two lymphoblastoid cell lines from the HapMap/
mutations at high and low allele frequency (50–0.1%). The 377-amplicon panel encompassed four heterozygous single nucleotide polymorphisms (SNPs) present only in NA12878. These SNPs were used as‘somatic’mutations for the purpose of this analysis.
Using NG-TAS, the cfDNA dilution series was tested in triplicate, varying the input cfDNA from 5 to 50 ng. Since in clinical plasma samples the amount of ctDNA is frequently a limiting factor, we also tested the Thru-Plex plasma-seq kit (requiring as little as 3 ng of cfDNA input) to generate a whole genome cfDNA library (termed NGS cfDNA library). An aliquot of this NGS cfDNA library was then used as input for NG-TAS.
These NG-TAS experiments showed a strong linear relationship between the observed and expected variant allele frequencies (VAF) for the four‘somatic’mutations (Table 2, Fig. 3). As the input cfDNA reduced from 50 to 5 ng, the R2 values decreased from 0.968 to 0.885. With 10 ng input cfDNA, VAFs as low as 1% could be consistently detected. Lowering the input cfDNA gener-ated more variable results (i.e. VAF deviating from the ex-pected values and higher standard deviations), in particular at low AF. This is probably caused by stochastic amplification of the alternative allele. NG-TAS performed using NGS cfDNA library as input performed better than 5 ng of cfDNA input (R2= 0.964, Table2, Fig.3).
The NG-TAS analysis pipeline was developed and optimised using this dilution series data and later ap-plied to data from clinical plasma samples. As illustrated in Fig.4a and in the‘Methods’section, mutation calling was performed using MuTect2, processing each ampli-con individually. To limit the number of false positives (FPs) caused by PCR errors, we only called mutations observed in at least two out of three replicates. With the reported settings and using 10 ng of input cfDNA from the dilution series, all four SNVs were called when the expected VAF was 5% or higher, and three of four SNVs when the expected VAF was 1% (Fig. 4b). No FPs with VAF higher than 3% were called with 50 ng and 10 ng in-put cfDNA from the dilution series. NG-TAS of both the 5 ng cfDNA input and NGS cfDNA library input generated seven FPs above 3% in the dilution series (Fig. 4c). Template scarcity and extra PCR cycles during library preparation could explain this increase in FPs.
Therefore, for NG-TAS in plasma samples, we recom-mend the use of 10 ng cfDNA per replicate as input and
a threshold of 5% VAF for de novo mutation calling. In plasma samples with less cfDNA, the use of NGS cfDNA library as input for NG-TAS enables ctDNA profiling in samples with as little as 3 ng of cfDNA. However, this approach is more suitable for tracking in plasma ctDNA mutations previously identified in the tumour, rather than for de novo plasma ctDNA mutation calling.
Testing NG-TAS performance in cancer patient samples
We applied NG-TAS to a clinical cohort of 30 metastatic breast cancer patients from which we have collected 360 plasma samples (for 31 of these NGS cfDNA library samples were used) and buffy coats. This cohort is part of a clinical trial which will be comprehensively reported in a separate manuscript (Baird et al. in preparation).
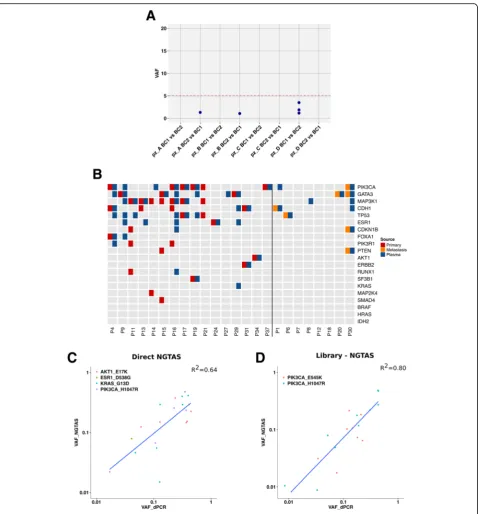
To estimate the FP rate in blood samples, we used pairs of DNA extracted from the buffy coats collected at two different time points from four patients. Any muta-tion identified by NG-TAS in any of the eight possible buffy coat DNA pairs tested was considered a FP. Figure 5a shows that in these samples, NG-TAS identi-fied no FP with VAF greater than 5% (a result similar to NG-TAS performed using the cell line cfDNA dilution series, Fig.4c).
In 24 of the cases in our cohort, at least 1 tissue sam-ple was also available and analysed. Sixteen of these cases had tissues from the primary tumour whilst in the remaining 8 cases, tissue samples were obtained from metastasis biopsies collected during the trial. Overall, we found at least 1 mutation in 21/24 patients (87.5%, Fig.5b). Forty-four mutations were detected in the tissue samples and 60 in at least 1 plasma sample; of these, 23 were observed in both tissue and plasma. The agreement was higher for the 8 cases where a metastasis biopsy was sequenced: 7 mutations detected in the tissue, 11 detected in plasma and 7 in common (100% of tissue mutations detected in plasma). In the 16 cases where a primary tumour was tested, 33 mutations were detected in the tissue, 41 in plasma and 19 in common (58% of tissue mutations detected in plasma, Fig. 5b and Additional file 1: Figure S5). The discordance seen in this cohort is probably due to the time gap between the primary tumour tissue sample and plasma, the latter obtained when the patients had metastatic disease. In addition, most of the tissue samples were formalin-fixed paraffembedded (FFPE); hence, we detected an in-crease of C>T/G>A SNVs not usually found in ctDNA samples (Additional file1: Figure S5).
We used dPCR to validate a subset of the mutations identified in seven patients in which NG-TAS was per-formed either directly on cfDNA (n= 4) or using post-NGS library products (n= 3). In the four direct NG-TAS samples, four hotspot mutations PIK3CA (H1047RandE545K),KRAS(G13D),ESR1(D538G) and Table 2Linear regression analysis for different cfDNA input
Input DNA R2 Estimated coefficient 2.5% CI 97.5% CI
50 ng 0.968 1.075 1.018 1.133
10 ng 0.940 1.005 0.930 1.080
5 ng 0.885 0.932 0.832 1.032
AKT1 (E17K) were all validated by dPCR. A good con-cordance between VAFs estimated by NG-TAS and dPCR was found (R2= 0.64, Fig.5c). In the three patients where post-NGS library products were used as input,
two PIK3CA hotspots (H1047R and E545K) were also
validated by dPCR, and a high concordance between the VAFs estimated by NG-TAS and dPCR was observed (R2= 0.80, Fig.5d).
Monitoring response in breast cancer patients using NG-TAS
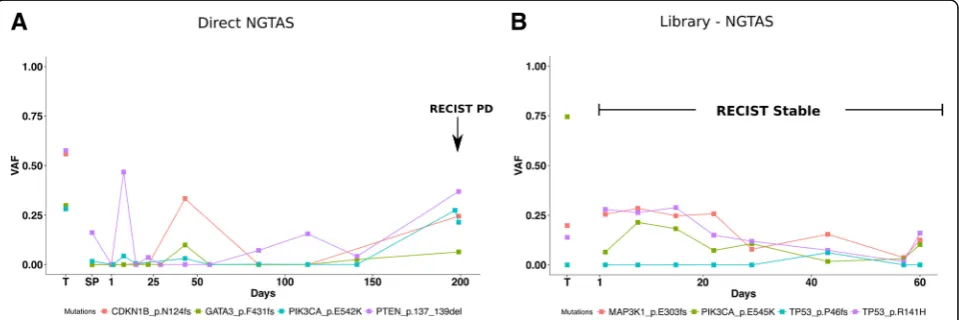
We report the example of two patients from the above clinical trial to demonstrate the use of NG-TAS for metastatic breast cancer disease monitoring. Patients had clinical monitoring performed as per the trial
protocol using Response Evaluation Criteria in Solid Tumour (RECIST), version 1.1.
The first patient had RECIST partial response in the first 28 weeks and progression on day 197. NG-TAS identified mutations in GATA3 (F431 fs), PIK3CA (E542K), CDKN1B (N124 fs) and PTEN (137-139del) (Fig. 6a).PTENmutation VAFs in ctDNA showed paral-lel dynamics to RECIST: initial drop, followed by a con-tinuous rise from day 85, preceding RECIST progression by over 100 days. The VAFs of the other mutations showed a parallel rise starting later.
NG-TAS detected PIK3CA (H1047R), MAP3K1 (E303fs) and TP53 (R141H and P46fs) mutations, and their VAFs showed stable values, and then a slight
reduction between days 20–56, followed by a slight rise by the time monitoring was discontinued (Fig. 6b).
These two examples demonstrate the use of NG-TAS in plasma cfDNA samples to monitor tumour burden in metastatic breast cancer patients.
Comparison of NG-TAS with other approaches
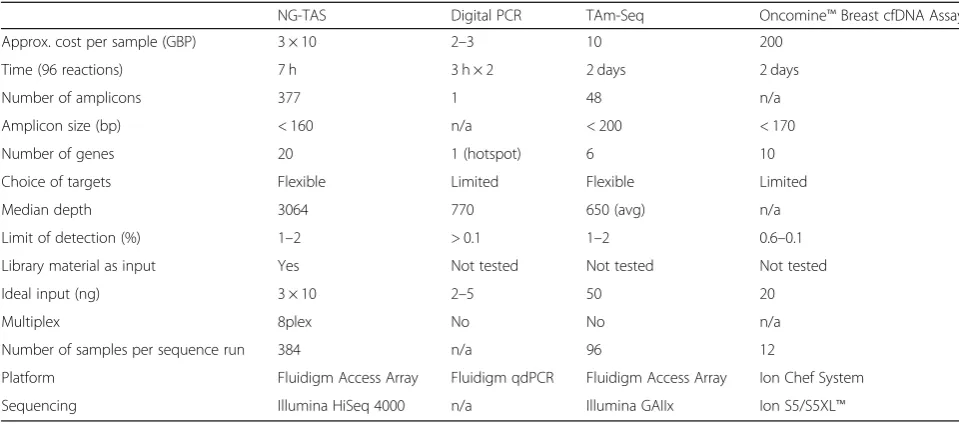
We finally compared NG-TAS to other existing tech-nologies such as digital PCR, TAm-Seq and Oncomine™ Breast cfDNA Assay (Table 3). NG-TAS can be per-formed in 7 h using the Fluidigm system as detailed in the ‘Methods’section. Up to 384 samples can be proc-essed at the same time. Lower limits of detection can be reached using Digital PCR or Oncomine technology; however, this is limited to one target for the first and a set of pre-defined hotspots for the latter. Importantly, the cost of NG-TAS, estimated at 30 GBP per sample, is significantly lower than any commercial solution, mak-ing it cost-effective for use in the clinics.
Discussion
The genes frequently mutated in different human can-cers have been characterised by large-scale sequencing studies such as The Cancer Genome Atlas [20, 21]. These pan-cancer studies have revealed that most hu-man tumours have at least one to ten driver mutations, allowing the design of custom gene panels that could be used for generic cancer detection. But the challenge remaining is there are very few recurrent or hotspot mu-tations in tumours such as breast cancer, with mumu-tations spread along the protein coding region, as observed in TP53, GATA3and MAP3K1. Therefore, it would be de-sirable to cover most exons of these genes simultan-eously in a ctDNA mutation detection panel.
The detection of specific mutations in ctDNA is achievable by dPCR, now considered the gold standard to detect mutations with low VAFs. However, dPCR is constrained by the number of mutations that can be de-tected in a single reaction [11]. Thus, its high sensitivity and specificity are at the expense of the number of mu-tations that can be detected concurrently. At the other end of the spectrum, whole genome sequencing or whole exome sequencing suffers from reduced sensitivity at the current achievable level of sequencing depth [22].
We report here a new approach, NG-TAS, an optimised targeted amplicon sequencing pipeline that provides clinic-ally relevant sensitivity in mutation calling across a tar-geted, but relatively broad and customizable panel of genes. The current version of NG-TAS covers all exons or hotspots of 20 breast cancer-associated genes in a total of 377 amplicons, has a lower detection limit of 1% VAF and requires only three aliquots of 10 ng cfDNA input. The single step multiplexed PCR amplification makes it a less time-consuming method and more cost-effective than other assays, such as the commercially available Oncomine assay (Table 3). NG-TAS is flexible and custom designed primers can be adjusted to the needs of the end user, de-pending on the cancer type and the clinical context.
Importantly, we developed a bespoke NG-TAS compu-tational pipeline for data analysis, with all the relevant open-source code available at GitHub (https://github. com/cclab-brca/NGTAS_pipeline). All sequencing data are also made available at https://figshare.com/articles/ NGTAS_NA12878/7387370 and https://www.ebi.ac.uk (EGAS00001003392). These will be instrumental to test and further develop the computational pipeline, as re-quired by regulatory agencies.
Fig. 6Monitoring response in metastatic breast cancer patients using NG-TAS.aExample of patient monitoring during treatment using direct NG-TAS in ctDNA. There are four mutations detected in more than one sample:GATA3(F431 fs),PIK3CA(E542K),CDKN1B(N124 fs) andPTEN
The custom design of primers for NG-TAS is po-tentially challenging. Building a customised panel of primers manually, using the tool mentioned above is time-consuming and, in some cases, difficult due to genomic sequence context (e.g. high GC and repeti-tive regions). The multiplex PCR requires a fixed an-nealing temperature, but more complex PCR cycle design can circumvent this. Nevertheless, we were able to design primers that yielded in 94% of ampli-cons over 100× coverage (Fig. 2b). We provide all pri-mer sequences (Additional file 2), and an open source optimised primer library will be growing with an NG-TAS user community.
When using NG-TAS for accurate estimation of VAF, as required to do serial tumour burden monitor-ing, our data suggests that at least 10 ng of input cfDNA per replicate is required. NG-TAS has poor performance with cfDNA input below 5 ng (per repli-cate), with amplicon coverage reduced in a stochastic manner, probably due to the limited availability of template. A suitable alternative protocol for these cases is to generate an NGS cfDNA library, requiring only 3 ng of cfDNA, and use the library material as input for NG-TAS.
We applied NG-TAS to a cohort of 30 patients for which both tissue and serial plasma samples were available. The percentage of mutations identified in tissue and detected in ctDNA was 100% when the tis-sue was from a synchronous metastasis biopsy and 58% when the tissue was from the primary tumour. Such an agreement is higher than what recently re-ported by Chae et al. [23]. In their cohort of 45 pa-tients, 60% of tissue samples were from primary
tumours, and 58% of the tissues were acquired more than 90 days before ctDNA testing. The Foundatio-nOne panel was used for tissue analysis and the Guardant360 assay for ctDNA. They detected only 25.6% of tissue mutations in plasma when evaluating
the common regions between the two targeted
approaches.
A future development of NG-TAS will be the use of molecular barcoding since this has been shown to im-prove sensitivity and specificity of amplicon-based deep sequencing [24]. This will have cost implica-tions, potentially limiting one of the main advantages of the current NG-TAS protocol. The extra costs would be the result of the generation of barcoded primers. For example, if 96 distinct barcodes are used, the primer cost will increase around 100 times. How-ever, costs will be significantly diluted when consider-ing laboratories processing a large number of samples, keeping the overall cost of NG-TAS within a very reasonable range.
Conclusions
We have described here the workflow for a highly
multi-plexed cfDNA deep sequencing method named
NG-TAS. NG-TAS assesses the mutational status of sev-eral genes simultaneously, with high sensitivity (allowing quantification of AF) and competitive costs, and offers flexibility in the choice of target genes. We have also shown proof of principle that the monitoring of ctDNA using NG-TAS in metastatic breast cancer can allow de-tection of cancer progression earlier than conventional RECIST measurements.
Table 3Comparison of different approaches for ctDNA detection
NG-TAS Digital PCR TAm-Seq Oncomine™Breast cfDNA Assay
Approx. cost per sample (GBP) 3 × 10 2–3 10 200
Time (96 reactions) 7 h 3 h × 2 2 days 2 days
Number of amplicons 377 1 48 n/a
Amplicon size (bp) < 160 n/a < 200 < 170
Number of genes 20 1 (hotspot) 6 10
Choice of targets Flexible Limited Flexible Limited
Median depth 3064 770 650 (avg) n/a
Limit of detection (%) 1–2 > 0.1 1–2 0.6–0.1
Library material as input Yes Not tested Not tested Not tested
Ideal input (ng) 3 × 10 2–5 50 20
Multiplex 8plex No No n/a
Number of samples per sequence run 384 n/a 96 12
Platform Fluidigm Access Array Fluidigm qdPCR Fluidigm Access Array Ion Chef System
Additional files
Additional file 1:Figure S1.Schematic overview of the computational pipeline to identify somatic mutations in NG-TAS data from longitudinal samples.Figure S2.Representative image of the Bioanalyser gel plot. The 8plex PCR products were analysed using Bioanalyser for primer efficiency and quality control.Figure S3.Fragment size distribution according to the Bioanalyser results for cfDNA extracted from the media where NA12878 cells were grown (main peak at around 160-170bp).Figure S4. (A) Percentage of amplicons having more than 100x coverage for 2, 5 and 10 ng of input cfDNA from NA12878 sample. (B) Percentage of reads on target for 2, 5 and 10 ng of input cfDNA from NA12878 sample. Figure S5.Detailed representation of mutations identified in tumour or plasma samples of 21 metastatic breast cancer cases. The colour gradient indicates the VAF as indicated; PT = primary tumour, M = metastasis biopsy, V1…n= plasma.Table S1.The proportion of NA12878 and NA11840 for the generation of the cfDNA dilution series with expected VAF.Table S2.Primers and Probes for PIK3CA and ESR1 hotspot mutations for digital PCR. (PDF 705 kb)
Additional file 2:List and description of the 377 primers used. (XLS 208 kb)
Abbreviations
cfDNA:Cell-free DNA; CT: Computed tomography; ctDNA: Circulating tumour DNA; dPCR: Digital PCR; FFPE: Formalin-fixed paraffin-embedded; FP: False positive; NGS: Next-generation sequencing; NG-TAS: Next Generation Targeted Amplicon Sequencing; RECIST: Response Evaluation Criteria In Solid Tumour; SNV: Single nucleotide variant; TAm-Seq: Targeted Amplicon Sequencing; UDG: Uracil DNA glycosylase; VAF: Variant allele frequency
Acknowledgements
We are grateful to Cancer Research UK and the University of Cambridge for the support. We thank the Cancer Molecular Diagnostics Lab and Cancer Research UK Cambridge Institute Core Facilities including Genomics and Bio-repository that supported this work. We thank Dr. PA Edwards for the scientific advice and editing for this manuscript.
Funding
This research was supported with funding from Cancer Research UK. MG has been supported by a Genentech research grant (CLL-010907) awarded to the Caldas Laboratory. MC has received funding from the European Union’s Horizon 2020 research and innovation program under the Marie Sklodowska-Curie grant agreement no. 660060.
Availability of data and materials
The computational pipeline is available through GitHub (https://github.com/ cclab-brca/NGTAS_pipeline). All sequencing data are available athttps:// figshare.com/articles/NGTAS_NA12878/7387370andhttps://www.ebi.ac.uk (EGAS00001003392).
Authors’contributions
MG, MC, EB, SFC and CC conceived the study. MG and EB designed the primers and generated the dilution series. MG performed the NG-TAS in Fluidigm Access Array™system. RB, SCL, JC and MO conducted the clinical trial. HB, LJ and AB collected the clinical samples. MC developed the compu-tational approach and performed the analyses. SJS contributed in the com-putational pipeline development. MC and MG performed data analysis. MG, MC, SFC and CC drafted the manuscript. All authors revised and approved the final manuscript.
Ethics approval and consent to participate
This study was approved by the East of England - Cambridge East Research Ethics Committee (REC reference: 14/EE/1045). All human samples used were collected after informed consent, and the study was fully compliant with the Helsinki Declaration.
Consent for publication Not applicable
Competing interests
The authors declare that they have no competing interests.
Publisher’s Note
Springer Nature remains neutral with regard to jurisdictional claims in published maps and institutional affiliations.
Author details
1Department of Oncology and Cancer Research UK Cambridge Institute, Li
Ka Shing Centre, University of Cambridge, Cambridge CB2 0RE, UK.2Breast
Cancer Programme, Cancer Research UK Cambridge Cancer Centre, Cambridge University Hospitals NHS Foundation Trust, Cambridge CB2 2QQ, UK.3Netherland Cancer Institute, 1006 BE Amsterdam, Netherlands.4Ramon
y Cajal University Hospital, 28034 Madrid, Spain.5Vall d’Hebron Institute of
Oncology, 08035 Barcelona, Spain.
Received: 13 August 2018 Accepted: 17 December 2018
References
1. Leon SA, Shapiro B, Sklaroff DM, Leon SA, Shapiro B, Sklaroff DM, et al. Free DNA in the serum of cancer patients and the effect of therapy free DNA in the serum of cancer patients and the effect of therapy. Cancer Res. 1977;37:646–50. 2. Vasioukhin V, Anker P, Maurice P, Lyautey J, Lederrey C, Stroun M. Point
mutations of the N-ras gene in the blood plasma DNA of patients with myelodysplastic syndrome or acute myelogenous leukaemia. Br J Haematol. 1994;86:774–9.https://doi.org/10.1111/j.1365-2141.1994.tb04828.x. 3. Sorenson GD, Pribish DM, Valone FH, Memoli VA, Bzik DJ, Yao SL. Soluble
normal and mutated DNA-sequences from single-copy genes in human blood. Cancer Epidemiol Biomark Prev. 1994;3:67–71.
4. Murtaza M, Dawson S-J, Tsui DWY, Gale D, Forshew T, Piskorz AM, et al. Non-invasive analysis of acquired resistance to cancer therapy by sequencing of plasma DNA. Nature. 2013;497:108–12.https://doi.org/10. 1038/nature12065.
5. Diehl F, Schmidt K, Choti MA, Romans K, Goodman S, Li M, et al. Circulating mutant DNA to assess tumor dynamics. Nat Med. 2008;14:985–90.https:// doi.org/10.1038/nm.1789.
6. Schwarzenbach H, Hoon DS, Pantel K. Cell-free nucleic acids as biomarkers in cancer patients. Nat Rev Cancer. 2011;11:426–37.https://doi.org/10.1038/nrc3066. 7. Dawson S-J, Tsui DWY, Murtaza M, Biggs H, Rueda OM, Chin S-F, et al.
Analysis of circulating tumor DNA to monitor metastatic breast cancer. N Engl J Med. 2013;368:1199–209.
8. Wan JCM, Massie C, Garcia-corbacho J, James D, Caldas C, Pacey S, et al. Liquid biopsies come of age: clinical applications of circulating tumour DNA. Nat Rev Cancer. 2016.https://doi.org/10.1038/nrc.2017.7. 9. Vogelstein B, Kinzler KW. Digital PCR. Proc Natl Acad Sci U S A. 1999;96:
9236–41.https://doi.org/10.1073/pnas.96.16.9236.
10. Dressman D, Yan H, Traverso G, Kinzler KW, Vogelstein B. Transforming single DNA molecules into fluorescent magnetic particles for detection and enumeration of genetic variations. Proc Natl Acad Sci U S A. 2003;100:8817– 22.https://doi.org/10.1073/pnas.1133470100.
11. Hughesman CB, Lu XJD, Liu KYP, Zhu Y, Poh CF, Haynes C. Robust protocol for using multiplexed droplet digital PCR to quantify somatic copy number alterations in clinical tissue specimens. PLoS One. 2016;11:1–22.https://doi. org/10.1371/journal.pone.0161274.
12. Forshew T, Murtaza M, Parkinson C, Gale D, Tsui DWY, Kaper F, et al. Noninvasive identification and monitoring of cancer mutations by targeted deep sequencing of plasma DNA. Sci Transl Med. 2012;4:136ra68.https:// doi.org/10.1126/scitranslmed.3003726.
13. Torga G, Pienta KJ. Patient-paired sample congruence between 2 commercial liquid biopsy tests. JAMA Oncol. 2017.https://doi.org/10.1001/ jamaoncol.2017.4027.
14. Kinde I, Wu J, Papadopoulos N, Kinzler KW, Vogelstein B. Detection and quantification of rare mutations with massively parallel sequencing. Proc Natl Acad Sci. 2011;108:9530–5.https://doi.org/10.1073/pnas.1105422108. 15. Callari M, Sammut S-J, De Mattos-Arruda L, Bruna A, Rueda OM, Chin S-F, et
al. Intersect-then-combine approach: improving the performance of somatic variant calling in whole exome sequencing data using multiple aligners and callers. Genome Med. 2017;9:35.https://doi.org/10.1186/s13073-017-0425-1. 16. Eberle MA, Fritzilas E, Krusche P, Källberg M, Moore BL, Bekritsky MA. A
17. Yung TKF, Chan KCA, Mok TSK, Tong J, To K-F, Lo YMD. Single-molecule detection of epidermal growth factor receptor mutations in plasma by microfluidics digital PCR in non-small cell lung cancer patients. Clin Cancer Res. 2009;15:2076–84.https://doi.org/10.1158/1078-0432.CCR-08-2622. 18. Schiavon G, Hrebien S, Garcia-Murillas I, Cutts RJ, Pearson A, Tarazona N,
et al. Analysis of ESR1 mutation in circulating tumor DNA demonstrates evolution during therapy for metastatic breast cancer. Sci Transl Med. 2015; 7:313ra182.
19. Toy W, Shen Y, Won H, Green B, Sakr RA, Will M, et al. ESR1 ligand-binding domain mutations in hormone-resistant breast cancer. Nat Genet. 2013;45: 1439–45.https://doi.org/10.1038/ng.2822.
20. Cerami E, Gao J, Dogrusoz U, Gross BE, Sumer SO, Arman B, et al. In Focus The Cbio Cancer Genomics Portal: An Open Platform For Exploring Multidimensional Cancer Genomics Data 2012. doi:https://doi.org/10.1158/ 2159-8290.CD-12-0095.
21. Gao J, Aksoy BA, Dogrusoz U, Dresdner G, Gross B, Sumer SO, et al. Integrative Analysis of Complex Cancer Genomics and Clinical Profiles Using the cBioPortal Complementary Data Sources and Analysis Options 2013;6:1–20. 22. Sims D, Sudbery I, Ilott NE, Heger A, Ponting CP. Sequencing depth and coverage: key considerations in genomic analyses. Nat Rev Genet. 2014;15: 121–32.https://doi.org/10.1038/nrg3642.
23. Chae YK, Davis AA, Jain S, Santa-Maria C, Flaum L, Beaubier N, et al. Concordance of genomic alterations by next-generation sequencing in tumor tissue versus circulating tumor DNA in breast cancer. Mol Cancer Ther. 2017;16:1412–20.https://doi.org/10.1158/1535-7163.MCT-17-0061. 24. Kou R, Lam H, Duan H, Ye L, Jongkam N, Chen W. Benefits and challenges