188 2017, XX, 2 DOI: 10.15240/tul/001/2017-2-014
Introduction
Forecasting has become an important tool for statistical analysis because it helps in decision-making. The importance of forecasting is irrefutable because it is evident from the past that accurate forecasting for future interest rates helps policy makers to take timely steps in order to run the economic functions in a smooth manner. Monetary policy makers make the best use of forecasted KIBOR rates. Forecasting of the interest rates has been the center of interest for fi nancial researchers and those who are interested in fi xed income markets (Contreras et al., 2003).
Since, interest rates are highly resolute, so autoregressive models are most commonly used in the forecasting of KIBOR rates. Central banks can take various corrective and preventive measures with the help of forecasted rates. This provides benchmark future rates. Various researchers used ARMA (Auto Regressive moving average) ARIMA (Auto regressive integrated moving average) and ARCH (Autoregressive conditional heteroskedasticity models) in order to predict future rates. These models are best for time series data and to predict future values. Researchers found that GARCH models are helpful for determining the volatility and some researchers also fi nd results with the help of ARMA and ARIMA (Adhikari & Agrawal, 2014; Radha & Thenmozhi, 2002).
Karachi Inter Bank Offer Rates (KIBOR) is the average interest rate at which banks want to lend money to other banks. KIBOR as a benchmark, to encourage transparency, to promote consistency in market based pricing and improve management of the market risk undertaken by banks. The banks do lending and borrowing taking KIBOR as benchmark with additional margin on it, which depends on, the tenure of the deal, the liquidity level,
and the credit quality. Factors linked with KIBOR, 1) Interest rate, 2) Rate of Infl ation, 3) Purchase Power, 4) Discount Rate, 5) Balance of Payments. KIBOR futures will allow banks to perform their lending function effi ciently by taking the burden of interest rate risk away from the corporate and industrial sector.
For the stable economic policies Pakistan has been facing many social and economic hurdles. Therefore, monetary policy makers always search for a tool, which they can use for future forecasting for important economic variables. These important economic variables have an overall impact on economy, so they can manipulate that variable in order to run the economic matters in a smooth manner. With the various other macroeconomic factors short-term interest rates are the one, which impacts on the smooth and effi cient functioning of economy and these rates also have numerous implications. In Pakistan these short-term interest rates are called KIBOR, which is Karachi interbank offer rate. These are basically the average rates, which are set daily by State bank of Pakistan by taking the averages of the rates given by prominent commercial banks. Now, the introduction of KIBOR as a reference rate becomes more effective for monetary policy maker (Toor & Ali, 2013). Forecasting has become an important tool for statistical analysis because it helps in decision-making. The importance of forecasting is irrefutable because it is evident from the past that accurate forecasting for future interest rates helps policy makers to take timely steps in order to run the economic functions in a smooth manner (Georgoff & Murdick, 1986). Monetary policy makers make the best use of forecasted KIBOR rates. Forecasting of the interest rates has been the center of interest for fi nancial researchers and those who are interested in fi xed income markets.
KARACHI INTER-BANK OFFERED RATE
(KIBOR) FORECASTING: BOX-JENKINS
(ARIMA) TESTING APPROACH
Rizwan Raheem Ahmed, Jolita Vveinhardt, Nawaz Ahmad,
Dalia Štreimikien
ė
EM_2_2017.indd 188
189 2, XX, 2017
The objective of this paper is to fi nd out the forecasting model that is the one, which gives the best output of forecasting. So that policy makers can be benefi ted from this research. Thus, this research will also evaluate the performance of ARMA, and Box-Jenkins (ARIMA) forecasting models for KIBOR in case of Pakistan. Previous researchers applied various models and found different result to forecast short-term rates. This research will also provide evidence that time series autoregressive models is good to forecast KIBOR rates. There are very few research papers on the forecasting of KIBOR rates and in the recent years very few researches have been conducted on this topic.
1. Literature Review
Substantial literature is available and numerous of studies have been carried out in order to forecast the important macroeconomic variables like infl ation, oil prices and interest rates with the help of autoregressive models in different parts of the World. These studies are extremely valuable and useful for this research paper.
Irfan et al. (2010) studied the forecasting and volatility of KIBOR, researchers used daily observations; period was one month, six month and one year, KIBOR bid rates. Researchers used ARMA, ARCH, GARCH and E-GARCH for best time series model for forecasting KIBOR. According to the researchers, they fi nd EGARCH (1, 1) remove the effect of leverage in all KIBOR’s tenure. GARCH overcomes the existence of volatility. Researchers also compared one month, six months and one year tenure to fi nd out best forecasting period, by using Mean Absolute Error (MAE) and Root Mean Squared Error (RMSE) criteria. According to this comparison, six month time period is very good for forecasting because the errors are less in this tenure.
Sehgal et al. (2011) sought to see the forecasting of time series model of yield of debt market security in India. Researchers used four types of debt security; monthly data of yield from April 1996 to March 2010, in which for short term they used 364 days, for medium term they used 1 to 5 year data and for long term they used 6 to 15 years data. Researchers used two time series models, ARIMA and ESM (exponential smoothing method). They also used VAR model for multivariate, it is based
on economics factors. They took range from 3 months for short term, for long term they use the range up to 12 months. The fi ndings of the research revealed that ESM was the better fi t for long and short-range forecasting yield as compare to VAR and ARIMA models. In the period of high interest rate and volatility, forecasting of short range is better than long range.
Toor and Ali (2013) forecasted and analyzed the time series of different sector’s deposits rate, by using different models. ARMA-GARCH. ARIMA and ARMA-EGARCH models are used to forecast four different interest rates of four banking sectors of Pakistan. Data was taken from private, foreign, specialized and public sectors of Pakistan. Deposit rates is of monthly basis from 2004 Jan to 2013 march. Findings of the study reveal that for foreign and private sector ARMA (1, 1) model, for public sector ARMA (2, 1), for specialized sector ARMA (0, 0) model are best fi tted. According to models forecasting public and foreign sectors offer high interest rates. If investors invest in these sectors they will earn better returns.
According to Makridakis and Hibon (2000) ARIMA is a combination of 3-parameter model, which consists of Autoregressive process (memory of past events), an integrated process (maintaining and preparing the data fi xed and accessible to predict) and moving average (the older the data is the more perfect the prediction will be). ARIMA model is more preferable in time series analysis and multi variable regression. Generally problems occur due to delay in values. ARIMA model is the addition of Autoregressive model for modeling in the serial correlation for the time series data. ARIMA model and multi-variable regression analysis are very much alike while defi ning the results.
Radha and Thenmozhi (2002) develop a univariate model for forecasting the short-term interest rates for commercial paper rate, overnight MIBOR rate, call money rate and implicit yield on 91 day Treasury bill. The models under study are Random Walk, ARIMA, ARMA-GARCH and ARMA-EGARCH. Results show that random walk and ARIMA models were not useful but GARCH/E-GARCH shows that the short-term interest rate in, time series have volatility clustering effect. So, investors corporate, regulators and bankers can use ARIMA-GARCH model. ARIMA-EGARCH mode is the most appropriate model for forecasting
EM_2_2017.indd 189
190 2017, XX, 2
commercial paper rate; ARIMA-GARCH model is useful for forecasting overnight MIBOR rate, call money rate and implicit yield on 91 day Treasury bill.
Ahoniemi (2006) found the best model for VIX index for the predict ability and returns calculations. Data is taken from Chicago Board Options Exchange, and it consisted of daily observations of VIX volatility index data of fi fteen years from January 2, 1990 to December 31, 2004. Additional data is taken from S&P 500 index, LIBORE interest rate of 3 months USD, MSCI EAFE (Europe, Australasia, Far East) index, 10 years government bond yield of U.S and crude oil price from future contracts. Researcher concluded that, for VIX index time series data ARFIMA model is not fi t, GARCH and ARIMA (1, 1, 1) model is statistically signifi cant. Forecasting does not improve by errors of GARCH and it does not improve forecasting. But ARIMA model has power to predict the VIX index’s directional change 60 percent of trading day’s change correctly predicted by the best model.
Dua et al. (2004) forecast the long and short term rates of 15-91 days treasury bill rates, government security interest rates with maturity of one, fi ve and ten years, and call money rates. This research develops multi-variant models (VAR, Bayesian VAR and VECM) and univariant models (ARCH/ GARCH, ARIMA). Weekly data was taken from April 1999 to December 2001, and from January to September 2002; 36 weeks data was taken for out of sample forecast. Research fi ndings conclude that, for short and long term Treasury bill rate of 15 to 91 days, LVAR model was best fi tted. For forecasting 10 years government security LVAR was accurate, for 5-year government security VECHM was good fi t and for long and short-term call money rate ARMA-GARCH was best model fi t.
Meyler et al. (1998) forecasted the infl ation of Irish by using ARIMA time series model. Box Jenkins approach and objective penalty function method is also used as an alternative approach to fi nd the future performance that it must focus on minimizing out of sample forecast error as compared to maximizing in sample goodness of fi t. For the comparison purpose of infl ation, the harmonized index of consumer price is also used. The fi ndings of the research concluded that ARIMA model should be used to forecast the performance with HICP series.
2. Methodology
2.1 Data and Variable
Researchers have used 6-month rates of KIBOR; data is of 4 years from 2012 to 2015. The variable of this study is KIBOR.
2.2. Empirical Framework
In undertaken research the characteristics of data is time series, therefore, ARMA, Box-Jenkins (ARIMA) models have been incorporated in this research for the forecasting of KIBOR.
ARMA Model
ARMA model is used to predict values for future in time series. It is consisting of two parts AR (p) is autoregressive and MA (q) is moving average:
The autoregressive model, AR (p) model for order p is written as:
(1)
The moving average model, MA (q) for order q is written as:
(2)
Combining ARMA (p, q) model we will get:
(3)
The error terms are generally assumed to be independent identically distributed random variables (i.i.d.) sampled from a normal distribution with zero mean: ~ N(0,σ2) where
σ2 is the variance.
ARIMA Model
It is from the family of ARMA model, it is generalization of ARMA. In time series, for predicting the points they are used. If data is not stationary these models are applied, they help in reducing non-stationary form of data. ARIMA fi nd out the auto corrections in data, because it is a data oriented approach. We observe past observation’s line combination with ARIMA. In some texts the models will be specifi ed in terms
EM_2_2017.indd 190
191 2, XX, 2017
of the lag operator L. In these terms then the AR (p) model is given by:
(4)
where represents the polynomial
(5)
The MA (q) model is given by
(6)
where θ represents the polynomial
(7)
Finally, the combined ARMA (p, q) model is given by
(8)
or more concisely,
(9) or
(10)
Alternative Notation – Box-Jenkins
Some authors, including Box et al. (1994) use a different convention for the autoregression coeffi cients.This allows all the polynomials involving the lag operator to appear in a similar form throughout. Thus the ARMA model would be written as
(11)
Moreover, if we set φ0
=
θ
= 1, then we get
an even more elegant formulation:(12)
Box-Jenkins or ARIMA (p, q, d) is a non-seasonal model here p q d are non-negative integers and it is written as:
(13)
3. Results
Graphical Analysis. The Fig. 1 shows the negative trend in KIBOR rates, which means that as the time increase the KIBOR Rates tend to decreases.
Descriptive Analysis. The Fig. 2 shows histogram of the fi rst difference of KIBOR rates. The table of Fig. 1 shows the descriptive analysis. The time series data shows the value of skewness is -9.83, which means it is negatively skewed that so, it means the mass of the distribution is concentrated on the right of the fi gure and the left tail is longer. The Kurtosis of data is 176.6. It shows that the model is not normally distributed.
Augmented Dickey-Fuller Test. Before taking difference of KIBOR, it was found insignifi cant. But after taking fi rst difference the t-statistic is found to be signifi cant and greater than critical value. It means the data has unit root, which is overcome by taking fi rst difference.
Autocorrelation Plot Section for Box-Jenkins (ARIMA). This plot is the key diagnostic to determine if the model is adequate. Since, here no pattern is found as shown in Fig. 3, therefore, it can be assumed that Box-Jenkins (ARIMA) model is as good as possible and proceed to use the forecasts.
Box-Jenkins – ARIMA (1,1,1) testing approach. In this model both AR (1) MA (1) is signifi cant at 1%. The Durbin Watson is the most acceptable criteria for measuring the magnitude of autocorrelation; it is closer to 2, which means there is no evidence of strong autocorrelation. The usefulness of model selection is indicated by AIC (Akaike information Criterion). The smallest value for this is preferred -2.90, which is also estimated for our model. The Schwarz criterion is -2.88, this is alternative to AIC and it is so closer to that which means that the model is fi t for time series. Hannan-Quinn is -2.89,
EM_2_2017.indd 191
192 2017, XX, 2
Fig. 1: KIBOR
Source: own
Fig. 3: Autocorrelation Plot Section for Box-Jenkins (ARIMA)
Source: own
Fig. 2: Descriptive Statistics
Source: own
EM_2_2017.indd 192
193 2, XX, 2017
LEVEL 1st DIFFERENCE INTEGRATION
KIBOR 0.1948 -29.01 I(1)
Source: own
Tab. 1: Augmented Dickey-Fuller Test
Variable Coeffi cient Std. Error t-Statistic Prob.
C -0.005974 0.003730 -1.601604 0.1096
AR(1) 0.969755 0.023793 40.757530 0.0000
MA(1) -0.940499 0.033106 -28.408960 0.0000
R-squared 0.014347 Mean dependent var -0.005842
Adjusted R-squared 0.012211 S.D. dependent var 0.057011 S.E. of regression 0.056662 Akaike info criterion -2.900194
Sum squared resid 2.963360 Schwarz criterion -2.884543
Log likelihood 1,345.790000 Hannan-Quinn criter. -2.894223
F-statistic 6.717362 Durbin-Watson stat 1.991995
Prob(F-statistic) 0.001270 Inverted AR Roots 0.97 Inverted MA Roots 0.94
Source: own
Date Forecasted Rates Actual Rates Difference
27/11/15 6.541 6.53 0.011
28/11/15 6.535 6.53 0.005
29/11/15 6.529 6.53 -0.001
30/11/15 6.523 6.53 -0.002
1/12/15 6.517 6.53 -0.013
Source: own
Tab. 2: Box Jenkins – ARIMA (1, 1, 1) results
Tab. 3: Forecasted rates for KIBOR
which is also closer and depicting the same result. Therefore, there is no sample error as the difference between R-squared and adjusted R-squared is as low as 0.5%.
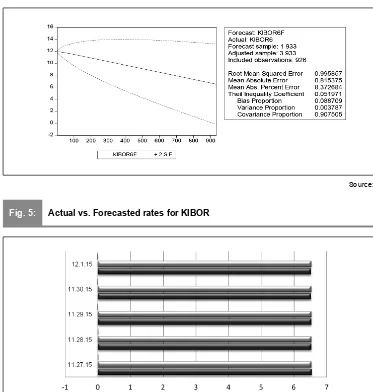
Graphical ARIMA (Box-Jenkins) Fore-casting for KIBOR. The Fig. 4 shows the forecasting of KIBOR 6 month fi rst difference rates by ARIMA, and it shows standard errors of +2 and -2. The root mean square shows
the standard error and measures the quality of estimator.
Forecasted values for KIBOR. There is very small difference between the actual and forecasted rates – see Tab. 3. The forecasted rate is almost equal to actual rates, which depict the perfection of the model applied. Thus this shows the robustness of ARIMA (Box-Jenkins) model.
EM_2_2017.indd 193
194 2017, XX, 2
Fig. 5 also shows the graphical representations of actual & forecasted values of KIBOR, the results clearly demonstrated that there is a least difference between actual and forecasted values for KIBOR.
4. Discussions
The Autoregressive integrated moving average (ARIMA) is used for analysis and forecasting in
uniformly spread out univariate time series data, transfer function data, and also for intervention data. An ARIMA model foresees a value in response time series as a linear combination of its own past values, past errors or shocks and also present and past values of other time series. Box and Jenkins (1976) fi rst explained the ARIMA method, and ARIMA models are frequently signifi ed to as Box-Jenkins models.
Fig. 4: ARIMA Forecasting for KIBOR
Source: own
Fig. 5: Actual vs. Forecasted rates for KIBOR
Source: own
EM_2_2017.indd 194
195 2, XX, 2017
The general transfer function model used by the ARIMA technique was discussed by Box and Tiao (1975). Pankratz (1991) indicates to these models as vibrant regression models.
In this research the results demonstrated that the null hypothesis is rejected and therefore, it is concluded that the model Box-Jenkins (ARIMA) is robust, which was used in this research. Since results further showed that KIBOR rates has unit root, which has overcome via taking fi rst difference for making it stationary. The study is signifi cant at 1%, the forecasting of rates shows that the rates are very close to the actual one and it further concluded that the applied model Box-Jenkins (ARIMA) is perfect for the forecasting. These results are in line with the previous fi ndings of Contreras et al. (2003), which postulated ARIMA technique because of precision and mathematical accuracy.
This paper has measured autoregressive integrated moving average (ARIMA) forecasting. The results of this research are very much coherent with previous researches of Abledu and Agbodah (2012), Alnaa and Ahiakpor (2011), Amos (2010), Awogbemi and Oluwaseyi (2011), McLeod and Li (1983). ARIMA models are academically acceptable and can be remarkably robust with respect to alternative (multivariate) modeling approaches. Indeed, Stockton and Glassman (1987) have similar fi nding or results for the United States observed, “it looks slightly stressful that a simple ARIMA model of infl ation should turn in such a reputable forecast performance relative to theoretical based provisions.”
One probable way to increase the forecasting functioning is to effort to fi t an ARIMA model to a ‘noiseless’ sort of the HICP series. This would comprise pertaining statistical techniques, following Bryan and Cecchetti (1993), to eliminate ‘noisy’ random fl uctuations from the measured infl ation rate. The Box-Jenkins approach fundamentally encompasses studying plots of the sample autocorrelogram, partial autocorrelogram and inverse autocorrelogram and deducing from patterns perceived in these functions the accurate form of ARMA model to select (Chatfi eld, 1979). Gómez and Maravall (1998) propose exhausting balanced models where probable if two models accomplish relatively likewise.
The results of AIC for this research paper exposed that there is no substantiation of
autocorrelation and there is no sample error and the model is suitable. It is in line with the Akaike Information criterion, which was demonstrated by the Akaike (1974). It is further coincided with the Hannan Quinn Criterion stated by Hannan (1980) and Schwarz Information criterion developed by Schwartz (1978). These models have been developed to help time series experts in assimilation, which needs to minimalize the errors with the contradictory plea for model parsimony. It is fi nally concluded that the forecasting of KIBOR rates by Box-Jenkins (ARIMA) model is very helpful for policy makers and these fi ndings are further in line and very much consistent with previous researches of Owusu (2010), Weiss (1984), Igogo (2010), Karanasos and Kim (2003), Alberg et al. (2008) and Cecchetti (1995) in which researchers concluded about inflation indicators and infl ation policy.
Conclusion
In this research the results demonstrated that the null hypothesis is rejected and therefore, it is concluded that the model Box-Jenkins (ARIMA) is robust, which was used in this research. Since results further showed that KIBOR rates has unit root, which has overcome via taking fi rst difference for making it stationary. The study is signifi cant at 1%, the forecasting of rates shows that the rates are very close to the actual one and it further concluded that the applied model Box-Jenkins (ARIMA) is perfect for the forecasting. The results of AIC revealed that there is no evidence of autocorrelation and there is no sample error and the model is useful. It is fi nally concluded that the forecasting of KIBOR rates by Box-Jenkins (ARIMA) model is very helpful for policy makers. The results extracted from this model are reliable for making any forecasting and also benefi cial for government functionaries, fi nancial experts and policy makers of fi nancial institutions in order to device their future strategies. This research also provides the basis to researchers from other countries to incorporate this model in their researches while calculating and forecasting for their own fi nancial and banking interest rates.
References
Abledu, G. K., & Agbodah, K. (2012). Stochastic Forecasting and Modeling of Volatility of Oil Prices in Ghana using ARIMA
EM_2_2017.indd 195
196 2017, XX, 2
Time series model. European Journal of Business and Management, 4(16), 122-131.
Adhikari, R., & Agrawal, R. K. (2014). A combination of artificial neural network and random walk models for fi nancial time series forecasting. Neural Computing and Applications, 24(6), 1441-1449. doi:10.1007/ s00521-013-1386-y.
Ahoniemi, K. (2006). Modeling and forecasting implied volatility - an econometric analysis of the VIX. Helsinki Center of Economic Research [Discussion Paper 129].
Akaike, H. (1974). A New Look at Statistical Model Identifi cation. IEEE Transactions on Automatic Control, AC-19, 716-723.
Alberg, D., Shalit, H., & Yosef, R. (2008). Estimating stock market volatility using asymmetric GARCH models. Applied Financial Economics, 18(15), 1201-1208. doi:10.1080/09603100701604225.
Alnaa, S. E., & Ahiakpor, F. (2011). ARIMA (Autoregressive Integrated Moving Average) Approach to Predicting Infl ation in Ghana. Journal of Economic and International Finance, 3(5), 328-336.
Amos, C. (2010). Time Series Modeling with Applications to South African Infl ation Data (Unpublished master thesis). University of Kwazulu Natal.
Awogbemi, C. A., & Oluwaseyi, A. (2011). Modeling Volatility in Financial Time Series: Evidence from Nigerian infl ation rates. Ozean Journal of Applied Sciences, 4(3), 337-350.
Box, G. E. P., & Jenkins, G. M. (1976). Time Series Analysis: Forecasting and Control. San Francisco: Holden-Day.
Box, G. E. P., & Tiao, G. C. (1975). Intervention Analysis with Applications to Economic and Environmental Problems.
Journal of the American Statistical Association,
70(349), 70-79.
Box, G. E. P., Jenkins, G. M., & Reinsel, G. C. (1994). Time Series Analysis: Forecasting and Control (3rd ed.). Prentice-Hall.
Bryan, M., & Cecchetti, S. (1993). Measuring Core Infl ation [NBER Working Paper Series No. 4303, March].
Cecchetti, S. (1995). Infl ation Indicators and Infl ation Policy. In B. Bernanke & J. Rotemberg (Eds.), NBER Macroeconomic Annual. London: MIT Press.
Chatfi eld, C. (1979). Inverse Autocorrela-tions. Journal of the Royal Statistical Society, Series A (General), 142(3), 363-377. doi:10.2307/2982488.
Contreras, J., Espinola, R., Nogales, F. J., & Conejo, A. J. (2003). ARIMA models to predict next-day electricity prices. Power Systems, IEEE Transactions on Power Systems, 18(3), 1014-1020. doi:10.1109/TPWRS.2002.804943.
Dua, P., Raje, N., & Sahoo, S. (2004).
Interest Rate Modeling and Forecasting in India [Occasional paper no. 3]. Centre for Development Economics, Delhi School of Economics.
Georgoff, D., & Murdick, R. (1986). Manager’s Guide to Forecasting. Harvard Business Review, Vol. 1 (January-February), p. 110.
Gómez, V., & Maravall, A. (1998). Automatic Modeling Methods for Univariate Series [Banco de España Working Paper No. 9808].
Hannan, E. (1980). The Estimation of the Order of ARMA Process. Annals of Statistics,
8(5), 1071-1081.
Igogo, T. (2010). Real Exchange Rate Volatility and International Trade fl ows in Tanzania. (Unpublished master thesis). University of Dar es Salaam.
Irfan, M., Maria, M., & Awais, M. (2010). Modeling Conditional Heteroscedasticity and Forecasting in Short Term Interest Rate of KIBOR. International Journal of Economic Perspectives, 4(4), 635-654.
Karanasos, M., & Kim, J. (2003). Moments of the ARMA-EGARCH model. Econometrics Journal, 6(1), 146-166.
Makridakis, M., & Hibon, M. (2000). The M3-Competition: results, conclusions and implications. International Journal of Forecasting, 16(4), 451-476. doi:10.1016/ S0169-2070(00)00057-1.
McLeod, A. I., & Li, W. K. (1983). Diagnostic checking of ARMA Time series Models using Squared - Residual Autocorrelations. Journal of Time Series Analysis, 4(4), 269-273. doi:10.1111/j.1467-9892.1983.tb00373.x.
Meyler, A., Kenny, G., & Quinn, T. (1998). Forecasting irish infl ation using ARIMA models.
Central Bank and Financial Services Authority of Ireland Technical Paper Series, 3, 46.
Owusu, F. K. (20 10). Time series ARIMA modeling of Infl ation in Ghana: (1990-2009). (Unpublished master thesis). Kwame Nkrumah University of Science and Technology, Institute of Distance Education, Kumasi, Ghana.
Pankratz, A. (1991). Forecasting with Dynamic Regression Models. New York: John Wiley & Sons.
EM_2_2017.indd 196
197 2, XX, 2017
Radha, S., & Thenmozhi, M. (2002). Forecasting short-term interest rates using ARMA, ARMA-GARCH and ARMA-EGARCH models. In 9th Capital Markets Conference Paper. Indian Institute of Capital Markets.
Schwarz, G. (1978). Estimating the Dimension of a Model. Annals of Statistics,
6(2), 461-464.
Sehgal, S., Bijoy, K., & Deisying, F. (2011). Modeling and forecasting debt market yields: evidence from India. Banks and Bank Systems, 6(4), 49-63.
Stockton, D., & Glassman, J. (1987). An Evaluation of the Forecast Performance of Alternative Models of Infl ation. Review of Economics and Statistics, 69(1), 108-117. doi:10.2307/1937907.
Toor, S., & Ali, M. (2013). Forecasting of Deposit Rates and Time Series Analysis
[Technical Report, BS Actuarial Sciences and Risk Management]. University of Karachi. Retrieved from https://www.academia. edu/6054561/FORECASTING_OF_DEPOSIT_ RATES_AND_TIME_SERIES_ANALYSIS.
Weiss, A. A. (1984). ARMA models with ARCH Errors. Journal of Time Series Analysis,
5(2), 129-143. doi:10.1111/j.1467-9892.1984. tb00382.x.
Prof. Rizwan Raheem Ahmed, Ph.D.
Indus University Faculty of Management Sciences rizwanraheemahmed@gmail.com
Prof. Jolita Vveinhardt, Ph.D.
Lithuanian Sports University Institute of Sport Science and Innovations jolita.vveinhardt@gmail.com
Assist. Prof. Nawaz Ahmad, M.S.
Institute of Business Management Faculty of Management Sciences nawazahmad_pk@hotmail.com
Prof. Dalia Štreimikienė, Ph.D.
Lithuanian Sports University Institute of Sport Science and Innovations dalia.streimikiene@lei.lt
EM_2_2017.indd 197
198 2017, XX, 2
Abstract
KARACHI INTER-BANK OFFERED RATE (KIBOR) FORECASTING:
BOX-JENKINS (ARIMA) TESTING APPROACH
Rizwan Raheem Ahmed, Jolita Vveinhardt, Nawaz Ahmad, Dalia Štreimikienė
The aim of this paper is to fi nd out the forecasting model that is the one, which gives the best output of forecasting. So that policy makers can be benefi ted from this research. Thus, this research will also evaluate the performance of ARMA, and Box-Jenkins (ARIMA) forecasting models for KIBOR in case of Pakistan. Karachi Inter Bank Offer Rates (KIBOR) is the average interest rate at which banks want to lend money to other banks. KIBOR as a benchmark, to encourage transparency, to promote consistency in market based pricing and to improve management of the market risk undertaken by banks. Researchers have used 6-month rates of KIBOR; data is of 4 years from 2012 to 2015. Therefore, keeping in view of the importance of KIBOR, the objective of this research is to forecast, Karachi Inter Bank Offer Rates (KIBOR) using time series autoregressive moving average (ARMA), Box-Jenkins (ARIMA) model. The study is signifi cant at 1%, the forecasting of rates shows that the rates are very close to the actual one and it further concluded that the applied model Box-Jenkins (ARIMA) is perfect for the forecasting. The results of AIC revealed that there is no evidence of autocorrelation and there is no sample error and the model is useful and robust. It is
fi nally concluded that the forecasting of KIBOR rates by ARIMA (Box-Jenkins) model is very helpful for policy makers. The results extracted from this model are reliable for making any forecasting and also benefi cial for government functionaries, fi nancial experts and policy makers of fi nancial institutions in order to device their future strategies.
Key Words: KIBOR, ARMA, Box-Jenkins, ARIMA, forecasting.
JEL Classifi cation: B23, E4, E5, E47.
DOI: 10.15240/tul/001/2017-2-014
EM_2_2017.indd 198