Proc. IAHS, 378, 29–35, 2018
https://doi.org/10.5194/piahs-378-29-2018 © Author(s) 2018. This work is distributed under the Creative Commons Attribution 4.0 License.
Open Access
spatio-tempor
al
v
ar
iability
of
w
ater
resources
in
easter
n
and
souther
n
Afr
ica
Spatio-temporal variations of hydrochemical and
isotopic patterns of groundwater in hand-dug wells: the
Cuvelai-Etosha Basin, Namibia
Josefina Tulimevava Hamutoko1, Heike Wanke1, Matthias Beyer2, Marcel Gaj2,3, and Paul Koeniger2 1Geology Department, University of Namibia (UNAM), 340 Mandume Ndemufayo Avenue,
Windhoek, Namibia
2Federal Institute for Geosciences and Natural Resources (BGR), Hannover, Germany
3Global Institute for Water Security, School of Environment and Sustainability, University of Saskatchewan,
Saskatoon, Canada
Correspondence:Josefina Tulimevava Hamutoko (jhamutoko@gmail.com)
Received: 10 November 2017 – Revised: 15 March 2018 – Accepted: 17 March 2018 – Published: 29 May 2018
Abstract. The rural population in parts of the Cuvelai-Etosha Basin (CEB) in Namibia depends on
ground-water as a source for drinking and livestock ground-watering. The aim of this study is to investigate spatial-temporal patterns for understanding water origins and recharge processes of perched aquifers in the CEB. The study uses hydrochemical data and water stable isotope signatures (18O and2H) of samples collected during (10) ten field campaigns over a three-year period (from 2014 to 2016) originating from two regions within the basin (Ohangwena and Omusati). A clear distinction between the shallow groundwater in the Omusati and Ohang-wena regions documented by TDS values, hydrochemical water types as well as the isotopic compositions of water. These differences are influenced mainly by their location in the landscape, depth to water table, the type of well infrastructure and aquifer material. Spatial and temporal variations indicate that even though these perched aquifers are both within the same basin, they are chemically different because of the rock materials in which their flow. Therefore, these differences in the water hydrochemical composition as well as the processes governing perched aquifers must be taken into account when planning groundwater management in the basin.
1 Introduction
More than half of the rural communities in the Namibian part of the Cuvelai-Etosha Basin (CEB) depend on groundwa-ter as a main source of domestic wagroundwa-ter supply. The major-ity of people live in rural areas and are supplied by ground-water wells that tap both shallow and deep aquifers. The shallow groundwater which is trapped on both local, discon-tinuous impermeable layers (perched aquifers) and shallow regional aquifers is commonly tapped by traditional hand-dugs wells that are more affordable and cheap in compari-son with deep boreholes. However, because of the shallow depth to water table and assumed small catchment of these local aquifers, the perched aquifers face both naturally and human induced challenges, e.g., population growth and agri-cultural activities; lack of proper water abstraction
Figure 1.Location of the study area and sampling sites. The map also shows area that is connected to the national water supply pipeline.
isotopic composition of the hand-dug wells in the Ohang-wena region and concluded that the groundwater is bicarbon-ate dominbicarbon-ated while the isotope signatures imply recharge through both fast infiltration and diffuse recharge. Neverthe-less, spatio-temporal variations of both hydrochemical com-position and isotopic signatures are still not well understood and this hinders an effective management of these important shallow water resources. Hence, in this the study we sought to understand the spatial and temporal variations of major ions and water stable isotope signatures (18O and2H), to de-termine the predominant processes that contribute to ground-water recharge and evolution of hydrochemistry of hand-dug wells in the CEB.
2 Study area
The study was carried out in the as part of the CEB (Fig. 1). CEB is the Namibian part of the Cuvelai catchment which is a huge sedimentary basin extending from the southern An-golan highlands into north central Namibia covering an area of about 165 000 km2(Lindenmaier et al., 2014). Two core study areas were defined, namely Ohangwena and Omusati regions (Table 1). The drainage system is directed towards the saline Etosha pan which is the lowest point in the basin (Fig. 1).
The Ohangwena multi-layered aquifers (KOH) has three aquifers. In this area KOH consist of local perched aquifers (KOH-0) that lie between 0 and 40 m on top, underlain by the regional Ohangwena 1 aquifer (KOH-I) is between 60 and 160 m below groundwater level (m b.g.l.) and at the
bot-tom is the Ohangwena 2 aquifer (KOH-II) which is between 250 to 350 m b.g.l. (Bittner, 2006). The Omusati multi-zoned aquifer (KOM) has a shallow depth to water table, ranging between 10 to 100 m with perched aquifers occurring in a fewer places as compared to the KOH region. The Ohang-wena region is characterized by two types of hand-dug wells: shallow wells (funnel-shaped hand-dug wells) locally known as “Omifima” and the deep wells (cylindrical-shaped hand-dug wells) known as “Eendungu”. In the Omusati region all hand-dug wells are of the funnel-shaped type. In the Ohang-wena region all hand-dug wells are tapping the perched aquifers while in the Omusati region some hand-dug wells are tapping both perched aquifers and the shallow parts of the regional aquifer KOM.
3 Sampling Methods and Laboratory Analysis
Water samples were collected from 48 hand-dug wells, from the two core study regions. Sampling took place over a pe-riod of three years (2014–2016) within ten campaigns. Some wells were not sampled at all times because they were not in use or/and dry during the particular field campaign; thus sampling would have been unrepresentative. In the field the physical parameters pH, electrical conductivity (EC), redox potential (Redox), oxygen content (O2) and temperature (T)
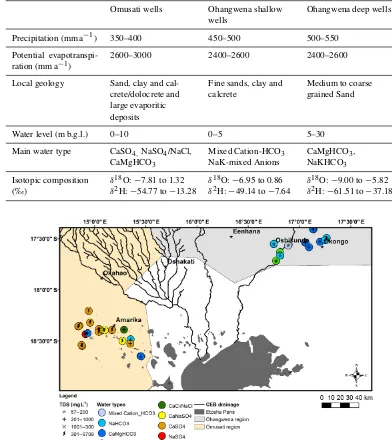
analy-Table 1.Comparison of the two core sites and main results. Source for climate data Mendelsohn et al. (2013).
Omusati wells Ohangwena shallow
wells
Ohangwena deep wells
Precipitation (mm a−1) 350–400 450–500 500–550
Potential evapotranspi-ration (mm a−1)
2600–3000 2400–2600 2400–2600
Local geology Sand, clay and cal-crete/dolocrete and large evaporitic deposits
Fine sands, clay and calcrete
Medium to coarse grained Sand
Water level (m b.g.l.) 0–10 0–5 5–30
Main water type CaSO4,NaSO4/NaCl,
CaMgHCO3
Mixed Cation-HCO3
NaK-mixed Anions
CaMgHCO3,
NaKHCO3
Isotopic composition (‰)
δ18O:−7.81 to 1.32 δ2H:−54.77 to−13.28
δ18O:−6.95 to 0.86 δ2H:−49.14 to−7.64
δ18O:−9.00 to−5.82 δ2H:−61.51 to−37.18
Figure 2.Spatial distribution of TDS and water types in the study area.
ses were performed at the Analytical Laboratory Services in Windhoek, Namibia and at the hydrochemistry labora-tory of German Federal Institute for Geosciences and Nat-ural Resources (BGR) in Hanover, Germany. The methods used at each laboratory is discussed in details by Hamutoko et al. (2017). Stable isotopes were measured at the University of Namibia (UNAM) and BGR laboratories using an off-axis integrated cavity output spectroscope (OA-ICOS, Los Gatos DLT-100) and a cavity ring down spectroscope (CRDS, Pi-carro L2120-i) respectively.
4 Results
4.1 Spatial variations in water chemistry and isotopes
magne-δ2H = 5.2δ18O - 13.80
δ2H = 5.0δ18O - 12.78 δ2H= 5.2δ18O - 10.88
δ2H = 8δ18O + 10
δ2H = 7.2δ18O + 4.4
-70 -60 -50 -40 -30 -20 -10 0
-10 -8 -6 -4 -2 0 2
10
3
δ
2H
VSMOW
103δ18O VSMOW Ohangwena deep wells
Ohangwena shallow wells
Omusati wells
GMWL
CEB-LMWL
Figure 3.δ2H vs.δ18O plot of all collected samples including the global meteoric (GMWL) and local meteoric (LMWL) water lines.
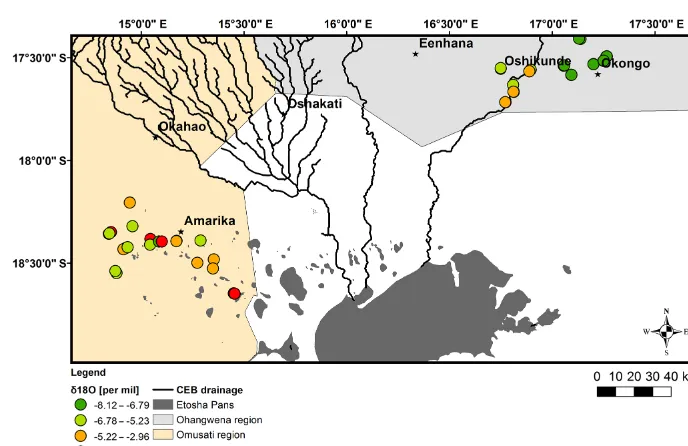
Figure 4.Spatial distribution ofδ18O [per mil] in the Ohangwena and Omusati regions.
sium (Ca-Mg) dominated to sodium and potassium (Na-K) dominated water (Fig. 2). The stable isotope values of all col-lected samples are plotting close to the Global Meteoric Wa-ter Line (GMWL) (Fig. 3). The samples from the Omusati region cover a wide isotopic range from depleted to highly enriched values while in Ohangwena there are two distinct groups. One group represents samples from deep wells that are depleted inδ18O andδ2H values, and the second group comprises samples from shallow wells which are enriched in
δ18O andδ2H values. Spatial distribution ofδ18O shows that
the deep wells are more depleted than the open shallow wells (Fig. 4).
In Ohangwena the deep wells plot of on regression line with equationδ2H=5.2δ18O−13.80 while shallow wells plot of regression line with equation δ2H = 5.0 δ18O −
-70 -60 -50 -40 -30 -20 -10 0 M a r 1 4 M a y 1 4 J u l 1 4 S e p 1 4 N o v 1 4 J a n 1 5 M a r 1 5 M a y 1 5 J u l 1 5 S e p 1 5 N o v 1 5 J a n 1 6 M a r 1 6 M a y 1 6 J u l 1 6 S e p 1 6 10 3 δ 2H V S M O W 1 10 100 1000 M a r 1 4 M a y 1 4 J u l 1 4 S e p 1 4 N o v 1 4 J a n 1 5 M a r 1 5 M a y 1 5 J u l 1 5 S e p 1 5 N o v 1 5 J a n 1 6 M a r 1 6 M a y 1 6 J u l 1 6 S e p 1 6 C h l o r i d e ( m g L -1) Time (month-year) 1 10 100 1000 J u n 1 4 A u g 1 4 O c t 1 4 D e c 1 4 F e b 1 5 A p r 1 5 J u n 1 5 A u g 1 5 O c t 1 5 D e c 1 5 F e b 1 6 A p r 1 6 J u n 1 6 A u g 1 6 O c t 1 6 C h l o r i d e ( m g L -1) Time (month-year) 1 10 100 1000 10 000 M a r 1 4 M a y 1 4 J u l 1 4 S e p 1 4 N o v 1 4 J a n 1 5 M a r 1 5 M a y 1 5 J u l 1 5 S e p 1 5 N o v 1 5 J a n 1 6 M a r 1 6 M a y 1 6 J u l 1 6 S e p 1 6 T D S ( m g L -1) Ohangwena region Ohameva I Omboloka Pan Oshana-shiwa Epumbalondjaba Omulonga I Oshikunde I 1 10 100 1000 10 000 J u n 1 4 A u g 1 4 O c t 1 4 D e c 1 4 F e b 1 5 A p r 1 5 J u n 1 5 A u g 1 5 O c t 1 5 D e c 1 5 F e b 1 6 A p r 1 6 J u n 1 6 A u g 1 6 O c t 1 6 T D S ( m g L -1) Omusati region Olumpelengwa I Olumpelengwa II Otongo I Uusathima I -70 -60 -50 -40 -30 -20 -10 0 J u n 1 4 A u g 1 4 O c t 1 4 D e c 1 4 F e b 1 5 A p r 1 5 J u n 1 5 A u g 1 5 O c t 1 5 D e c 1 5 F e b 1 6 A p r 1 6 J u n 1 6 A u g 1 6 O c t 1 6 10 3 δ 2H V S M O W
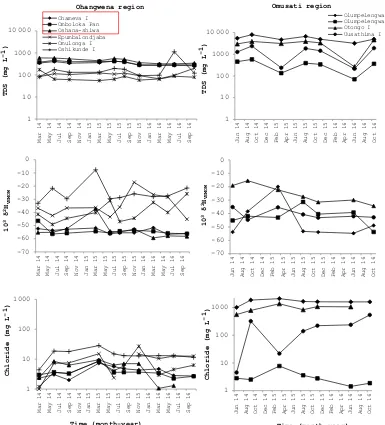
Figure 5.Temporal variation of TDS,δ2H and chloride concentrations of shallow groundwater in Ohangwena and Omusati regions. The villages in the red box represent deep wells from the pan/depression.
4.2 Temporal variations in Cl, TDS andδ2H
Temporal patterns were observed for Cl, TDS andδ2H for ten hand-dug wells. In Ohangwena region, the change in isotope values and chloride concentration follows a similar trend, during rainy season (e.g. March to June in 2015 and 2016) chloride decline and isotope values become depleted while during dry season, isotopes become enriched and chloride concentration increases (Fig. 5). In the Omusati region TDS increases during dry seasons and reduces during rainy sea-son. A change in Cl content is observed between the different years of sampling, however no trend could be identified.
5 Discussions
This study reveals a clear distinction between the shallow groundwater in the two regions Omusati and Ohangwena. This is documented by the TDS values, hydrochemical wa-ter types as well as the isotopic compositions of wawa-ter. TDS is generally higher in Omusati than in Ohangwena. The spa-tial heterogeneity is controlled mainly by their location in the landscape, depth to water table, the type of well infrastruc-ture, lithological and climatic factors. The main water types (CaSO4, NaSO4, and CaNaSO4) in Omusati region typically
rather than recharge zone. Furthermore, Omusati region is close Etosha pan as seen in Fig. 1 which is the discharge area for the whole basin. On the other hand, pans in Ohang-wena are characterized by CaMgHCO3and NaHCO3water
types. CaMgHCO3are common in recharge zones and
nor-mally infer fast infiltration through preferential paths or can result from dissolution of calcite and dolomite when they re-act with CO2rich water (Freeze and Cherry, 1979). NaHCO3
are commonly formed as result of silicate weathering and cation exchange while mixed water type in the ephemeral river could indicate mixed water sources.
Since all the collected samples are plotting close to the LMWL and within the range of modern local precipita-tion, this implies that these aquifers in both regions were recharged under climatic conditions similar to modern cli-mate. The water in the deep wells in Ohangwena and in Omusati wells have a slightly depleted source water (−8.7,
−58.2) and (−8.6,−57.5) respectively. This could indicate that recharge to the aquifers which these wells are tapping from is limited to larger amount events while for the shallow wells also small amount events are contributing as the mean parent water source is slightly enriched (−7.8,−51.8). In ad-dition, the deep wells are plotting closer to the LMLW this indicates that the component from recharge without signifi-cant evaporation is larger than for the shallow wells. Samples from the shallow (open funnel-shaped) hand-dug wells are enriched inδ18O andδ2H irrespective of their latitude or lon-gitude and they are strongly affected by evaporation due to exposure to the atmosphere. Bittner (2006) highlighted that high evaporation rates in the CEB causes the drying up of pans and ephemeral rivers resulting in the precipitation of salt and increased salinity of the shallow aquifers, in partic-ular in waterlogged areas and areas comprising a low per-meable lithology. It was also established that hand-dug wells in Omusati are tapping from both the perched aquifer and the regional aquifer and it is sometimes difficult to deter-mine from which aquifer each well is tapping as the regional aquifer has a relatively shallow water table.
Temporal variations within each region are different for both regions. In Ohangwena temporal patterns were mainly observed in chloride and isotopes. The decrease in chloride content and isotopes during rainy season indicate recharge events and visibly they occur at different times depending on the rainfall. It is interesting to notice that the recharge events occur in the same period even though the aquifers have differ-ent depths to water table. If one assumes they are recharged by same rainfall events and same mechanisms, it would be expected that recharge will be delayed for the deep wells be-cause of the percolation distance of the water to reach the aquifer in comparison to the shallow wells. Therefore, the re-sults that the shallow wells and deep wells in Ohangwena are recharged through different mechanisms, whereby the deep wells are recharged through fast preferential paths and shal-low wells by diffuse recharge. In Omusati the change is in Chloride and isotopes is observed but not following a
par-ticular pattern, however TDS increases during dry season. This indicates dissolution of evaporites and evaporation as the dominant process that influences the change. It should be noted that the in both regions, the sampled wells are used for water abstraction, but there are no estimation of how much is extracted and thus this could have an impact on accounting for temporal variations.
6 Conclusions
In the present study, it could be shown that it is indeed pos-sible to clarify the hydrogeological complexities of hetero-geneous perched aquifers using isotopic and hydrochemi-cal tracers at different spatial and temporal shydrochemi-cales. A dis-tinct spatial difference between samples from Omusati and Ohangwena regions. The spatial heterogeneity as shown by the TDS, hydrochemical water types and chloride can be attributed to lithological and climatic factors. Deep wells are recharged by fast infiltration through preferential flow paths during large rainfall events while shallow wells can be recharged even by lighter events. The hydrochemical water types implies that pans in Ohangwena are recharge zones while in Omusati they are discharge zones. There are no piezometers and boreholes in these perched aquifers so far and thus the water level fluctuation data is missing. There-fore it’s recommended, to establish monitoring stations for both water levels and water quality. This will also enable cal-culation of the current the abstraction rates from the perched aquifer.
Data availability. Individual data are available from the author(s) on request.
Author contributions. All authors were involved in the field work, interpretation of data and reviewing of the manuscript. PK was leading the hydrochemical analysis while HW analysed the sta-ble isotopes. JTH prepared the manuscript with contributions from all co-authors.
Competing interests. The authors declare that they have no con-flict of interest.
Special issue statement. This article is part of the special is-sue “Understanding spatio-temporal variability of water resources and the implications for IWRM in semi-arid eastern and southern Africa”. It is a result of the IAHS Scientific Assembly 2017, Port Elizabeth, South Africa, 10–14 July 2017.
within the SASSCAL project (Southern African Science Service Centre for Climate Change and Adaptive Land Management) under contract number 01LG1201. The work also benefited from the National Commission of Research Science and technology (NCRST) grant under project code ncrst/phd/012. We thank the local communities’ for access to sample their wells. We thank UNAM staff and local authorities who assisted in fieldwork. We kindly thank the staff at the BGR hydrochemical laboratory for analysing samples. Benjamin Mapani, your proof reading is highly appreciated.
Edited by: Hodson Makurira
Reviewed by: Richard Owen and one anonymous referee
References
Bittner, A.: Desk study report: Cuvelai-Etosha groundwater investi-gation. Windhoek, retrieved from: http://www.the-eis.com/data/ literature/CuvelaiDeskStudyReport_Version1.1.pdf (last access: March 2018), 2006.
Freeze, R. A. and Cherry, J. A.: Groundwater, Prentice-Hall, Engle-wood Cliffs, USA, 1979.
Hamutoko, J. T., Wanke, H., and Voigt, H. J.: Estima-tion of groundwater vulnerability to pollution based on DRASTIC in the Niipele sub-basin of the Cuvelai Etosha Basin, Namibia, Phys. Chem. Earth, 93, 46–54, https://doi.org/10.1016/j.pce.2015.12.007, 2016.
Hamutoko, J. T., Wanke, H., Koeniger, P., Beyer, M., and Gaj, M.: Hydrogeochemical and isotope study of perched aquifers in the Cuvelai-Etosha Basin, Namibia, Isotopes Environ. Health Stud., 53, 382–399, https://doi.org/10.1080/10256016.2016.1273913, 2017.
Ledesma-Ruiz, R., Pasten-Zapata, E., Parra, R., Harter, T., and Mahlknecht, J.: Investigation of the geochemical evo-lution of groundwater under agricultural land: A case study in north-eastern Mexico, J. Hydrol., 521, 410–423, https://doi.org/10.1016/j.jhydrol.2014.12.026, 2015.
Lindenmaier, F., Miller, R., Fenner, J., Christelis, G., Dill, H. G., Himmelsbach, T., and van Wyk, B.: Structure and gen-esis of the Cubango Megafan in northern Namibia: im-plications for its hydrogeology, Hydro. J., 22, 1307–1328, https://doi.org/10.1007/s10040-014-1141-1, 2014.
Mendelsohn, J. M., Jarvis, A., and Robertson, T.: A profile and At-las of the Cuvelai-Etosha basin: RAISON & Gondwana collec-tion, Windhoek, Namibia, 2013.