R E S E A R C H
Open Access
TIGAR cooperated with glycolysis to inhibit
the apoptosis of leukemia cells and
associated with poor prognosis in patients
with cytogenetically normal acute myeloid
leukemia
Sixuan Qian
†, Jianyong Li, Ming Hong, Yu Zhu, Huihui Zhao, Yue Xie, Jiayu Huang, Yun Lian, Yanru Li, Shuai Wang,
Jianping Mao and Yaoyu Chen
*†Abstract
Background:Cancer cells show increased glycolysis and take advantage of this metabolic pathway to generate
ATP. The TP53-induced glycolysis and apoptosis regulator (TIGAR) inhibits aerobic glycolysis and protects tumor cells from intracellular reactive oxygen species (ROS)-associated apoptosis. However, the function of TIGAR in glycolysis and survival of acute myeloid leukemia cells remains unclear.
Methods:We analyzed TIGAR expression in cytogenetically normal (CN-) AML patients and the correlations
with clinical and biological parameters. In vivo and in vitro, we tested whether glycolysis may induce TIGAR expression and evaluated the combination effect of glycolysis inhibitor andTIGARknockdown on human leukemia cell proliferation.
Results:High TIGAR expression was an independent predictor of poor survival and high incidence of relapse in adult patients with CN-AML. TIGAR also showed high expression in multiple human leukemia cell lines and knockdown of
TIGARactivated glycolysis through PFKFB3 upregulation in human leukemia cells. Knockdown ofTIGARinhibited the proliferation of human leukemia cells and sensitized leukemia cells to glycolysis inhibitor both in vitro and in vivo. Furthermore,TIGARknockdown in combination with glycolysis inhibitor 2-DG led leukemia cells to apoptosis. In addition, the p53 activator Nutlin-3αshowed a significant combinational effect withTIGARknockdown in leukemia cells. However, TIGAR expression and its anti-apoptotic effects were uncoupled from overexpression of exogenous p53 in leukemia cells.
Conclusions:TIGAR might be a predictor of poor survival and high incidence of relapse in AML patients, and the combination of TIGAR inhibitors with anti-glycolytic agents may be novel therapies for the future clinical use in AML patients.
Keywords:TIGAR, Glycolysis, Acute myeloid leukemia, Apoptosis, Survival
* Correspondence:Yaoyu.chen@njmu.edu.cn †Equal contributors
Department of Hematology, The First Affiliated Hospital of Nanjing Medical University, Jiangsu Province Hospital, 300 Guangzhou Road, Nanjing 210029, China
Background
“Warburg effect” is a fundamental metabolic change during malignant transformation in human cancer [1–3]. Under this condition, most cancer cells predomin-antly produced energy by a high rate of glycolysis and showed an elevated fructose-2, 6-bisphosphate (Fru-2,6-P2) levels [1, 2]. These metabolic pathways underpinning the abnormal growth, proliferation, and survival of cancer cells were modulated by a couple of glycolytic enzymes [4, 5]. As well as solid tumors, human leukemia cells also exhibited the increased rating of aerobic glycolysis and generated ATP as the main en-ergy source [5, 6].
Many oncogenes and tumor suppressors regulated the expression of glycolytic enzymes [7]. TIGAR, a p53-inducible glycolysis and apoptosis regulator, has a func-tional sequence similar to the bisphosphatase domain (FBPase-2) of 6-phosphofructo-2-kinase (PFK-2/FBPase) [8]. The functions of TIGAR were potentially relevant to cancer initiation and progression [8]. On the one hand, high expression of TIGAR in human cancer may protect cancer cells from cell death [9]. On the other hand, TIGAR inhibited glycolysis through Fru-2,6-P2 degrad-ation, directing metabolism into the pentose phosphate pathway (PPP) to produce NADPH and glutathione (GSH) as anti-oxidants, and ribose-5-phosphate for nu-cleotide synthesis [10]. TIGAR also showed high expres-sion among several cancer types, including human colon tumors [4], breast cancer [11, 12], and glioblastoma [13– 15], which suggesting that upregulated TIGAR expres-sion may support, rather than inhibit, cancer develop-ment [1]. High TIGAR expression correlated with the increased tumor survival/burden, while TIGAR depletion promoted the apoptosis rate of cancer cells [12, 16–18]. TIGAR depletion also enhanced the epirubicin-induced activation of autophagy [19]. In addition, knockdown of TIGAR gene increased Fru-2,6-P2 and reactive oxygen species (ROS) levels and decreased GSH levels in glio-blastoma cells [14].
However, the function of TIGAR in human chronic or acute leukemia remains unknown. In this study, we showed that the expression of TIGAR in patients with cy-togenetically normal acute myeloid leukemia (CN-AML) correlated with the clinical features and outcomes. The high TIGAR expression in AML might be an in-dependent prognostic factor for survival in patients with CN-AML. Knockdown of TIGAR inhibited the proliferation of human leukemia cells and sensitized leukemia cells to glycolysis inhibitor 2-deoxy-D-glucose (2-DG) both in vitro and in vivo, which may be due to increased apoptosis rate of leukemia cells. Our results suggested that TIGAR might be a predictor of poor survival and a novel therapeutic target for hu-man AML.
Methods
Patients and samples
One hundred sixteen patients, aged≥14 years, with pre-viously untreated CN-AML attended this study. All pa-tients were diagnosed for AML. All those papa-tients had complete clinical data available, and enough cryopre-served bone marrow (BM) samples taken at diagnosis, for analysis. Twenty health donors attended the study as the control. Among 116 patients, 109 patients were treated and followed up (until death or for a period of up to 53 months, between October 2007 and February 2013) at the Hematology Department of the First Affiliated Hospital of Nanjing Medical University (Nanjing, People’s Republic of China). All 109 patients received cytarabine-based intensive induction and consolidation chemotherapy. This study was approved by the institu-tional review board of the First Affiliated Hospital of Nanjing Medical University and carried out in accord-ance with the Declaration of Helsinki. All patients and normal donors provided written informed consent for this study.
Cytogenetic and mutation analyses
BM cells were harvested directly or after 1–3 days of un-stimulated culture, as described previously [1]. Meta-phase cells were banded via an improved heat treatment and Giemsa R-banding method. The diagnosis of a nor-mal karyotype was based on conventional cytogenetic examination of at least 20 metaphases. Genomic DNA was isolated from BM specimens. Mutation analysis of five relevant molecular marker genes (NPM1, CEBPA, FLT3-ITD, KIT, and p53) was carried out as described previously [20, 21].
Outcome measures
The primary endpoints were overall survival (OS; dur-ation from diagnosis to death from any cause), disease-free survival (DFS; time from achievement of complete remission (CR) until relapse or death), and morphologic leukemia relapse (hematologic and/or extramedullary). For analyses of DFS, failure was considered to be clinical or hematologic relapse or death from any cause; patients alive and in CR were censored at last follow-up. For ana-lyses of OS, failure was considered to be death from any cause; patients alive were censored at the date of last contact.
Western blot
membrane (Invitrogen). Membranes were blocked in PBS and 0.1% (vol/vol) Tween-20 (PBS-T) and 4% (wt/vol) nonfat dry milk (Bio-Rad) for 1 h on a shaker at room temperature. Primary antibodies were added to the block-ing solution at 1:500 (TIGAR; Abcam, 37910), 1:500 (GSH; Abcam, 19534), 1:500 (PFKFB3; Abcam, 96699), and 1:1000 (Actin; Abcam, 3280) dilutions and incubated overnight and a rocker at 4 °C. Immunoblottings were washed three times, 5 min each with PBS-T, and second-ary antibody was added at 1:10,000 dilution into PBS-T milk for 1 h on a shaker at room temperature. After several washes, enhanced chemiluminescence (ECL) reac-tions were performed according to the manufacturer’s recommendations (SuperSignal West Dura Extended Duration Substrate; Thermo Scientific).
Quantitative real-time reverse transcription PCR
The relative TIGAR mRNA expression was determined by comparing theTIGARexpression relative to GAPDH. TheTIGAR expression was compared among other 116 AML patients by using the real-time quantitative PCR and the 2−ΔΔCt method. The ΔCt of health donor was used as a control value for each AML patient. Patients with TIGAR expression values above the median of all patients were defined as having high TIGAR expression (TIGARhigh), while all other patients were considered to have lowTIGARexpression (TIGARlow).
Cell lines
HL-60, K562, Jurkat, and NB-4 cells (ATCC, USA) were cultured in RPMI1640 (GIBCO, USA), 10% fetal bovine serum, 2 mM L-glutamine, 50 U/ml penicillin, and 50μg/ml streptomycin. All these cell lines were authen-ticated and tested for mycoplasma contamination. Cells were treated with 400 μM cobalt chloride (CoCl2)
(Amresco, USA) for 48 h to induce glycolysis, or with 1 mg/ml 2-deoxy-D-glucose (2-DG) (Sigma-Aldrich, USA) for 48 h to suppress glycolysis.
Short hairpin RNA and gene overexpression constructs To inhibit TIGAR mRNA expression, small interfering RNAs (siRNA) matching nucleotide region 565–583 (TTAGCAGCCAGTGTCTTAG, TIGAR siRNA) of the human TIGAR cDNA sequence were synthesized as an antisense, and a scramble sequence (TTACCG AGACCGTACGTAT) was synthesized as a control. The TIGAR and scramble sequence were further cloned into the pSRL-SIH1-H1-Puro lentivirus vector. TIGAR and p53 cDNA was ordered and cloned into pcDNA3 vector.
Lentivirus and infection
Lentiviral supernatants were generated according to the established protocol. A medium was replaced and after
24 h. The scramble shRNA orTIGAR shRNA lentivirus transduced leukemia cells were selected by puromycin for 48 h and used.
Measurement of apoptosis and cell death
HL-60 cells and NB-4 with scramble or shRNA-TIGAR were treated with CoCl2or 2-DG for 48 h. After
treat-ment, aliquots were removed and counted by trypan blue (Sigma-Aldrich) exclusion in duplicate. Apoptosis was quantified by phosphatidylserine externalization. Briefly, the samples were stained with Annexin V-FITC and propidium iodide (PI) or 7AAD according to the manufacturer’s recommendations. Flow cytometry (FACS Calibur; BD Biosciences) enabled the distinction of viable cells (Annexin V-FITC−, PI−) from those in apoptosis (Annexin V-FITC+, PI−) [22]. Annexin V-FITC−, PI+ population was defined as dead/necrosis cells. Except where documented, all results were shown as a mean plus or minus SD.
Measurement of intracellular ROS
Human leukemia cells in 24-well plates were incubated at 37 °C for 30 min with 500μl of 10μmol/L DCFH-DA probe (S0033; Beyotime Institute of Biotechnology, Haimen, China), with shaking every 5 min. The cells were then washed with PBS (three times, 5 min each) to remove any remaining extracellular DCFH-DA probe [23]. The fluorescence intensity, representing cellular ROS levels, was detected using a Gemini XPS fluori-metric microplate reader (MolecularDevices, Shanghai, China), with excitation and emission wavelengths of 488 and 525 nm, respectively.
Measurement of intracellular F2,6BP
HL-60 cells were centrifuged at 200×g, resuspended in 20 volumes of 0.05 N NaOH and then one volume of 0.1 N NaOH to obtain a pH >11, vortexed for 10 s, incu-bated at 80 °C for 5 min and cooled in an ice bath. Cell extracts were neutralized to pH 7.2 with ice-cold acetic acid in the presence of 20 mM HEPES. Samples were in-cubated at 25 °C for 2 min in the following assay mix-ture: 50 mM Tris, 2 mM Mg2+, 1 mM F6P, 0.15 mM NAD, 10 u/l PPi-dependent PFK1, 0.45 kU/l aldolase, 5 kU/l triosephosphate isomerase, and 1.7 kU/l glycerol-3-phoshate dehydrogenase (Sigma). 0.5 mM pyrophos-phate was added and the rate of change in absorbance (OD = 339 nm) per min was followed for 5 min. F2,6BP was calculated based on a calibration curve produced by measuring 0.1 to 1 pmol of F2,6BP (Sigma) and normal-ized to total cellular protein.
Tumor xenografts
Committee protocols and regulations. HL-60 cells with scramble shRNA or shRNA against TIGAR were cultured in RPMI1640 supplemented with 10% FBS. BALB/c (nu/nu) nude female mice (6–8 weeks old, n= 10) were inoculated with 1 × 10⁶ cells through i.p. injection. The human leukemia cells were measured by FACS. Drug treatment started 7 days after implant. Those animals were assigned randomly to different groups. Animals received ve-hicle (5% dextrose, 10 ml/kg, orally, once a day) or 2-DG (2 g/kg, orally, once a day) for the duration of the study. Data were shown as mean ± SD, and differences are considered statistically significant at p< 0.05 by Student’sttest.
Statistical analyses
Data were analyzed using SPSS version 16.0 (IBM, USA). Statistical significance was considered at P< 0.05. Pos-sible differences between continuous variables were analyzed using Student’s t test. Data are represented as mean with SD as error bars unless otherwise men-tioned. No power analysis was used to pre-determine sample size. Chi-square or Fisher’s exact tests were performed to compare incidences. The Kaplan-Meier method was employed to estimate survival prob-abilities, and the log-rank test for univariate com-parisons. The probabilities of relapse were calculated by cumulative incidence curves. The associations be-tween TIGAR expression or other characteristics and OS were studied using a Cox’s proportional hazards regression model.
Results
TIGAR upregulation is associated with poor prognosis in AML patients
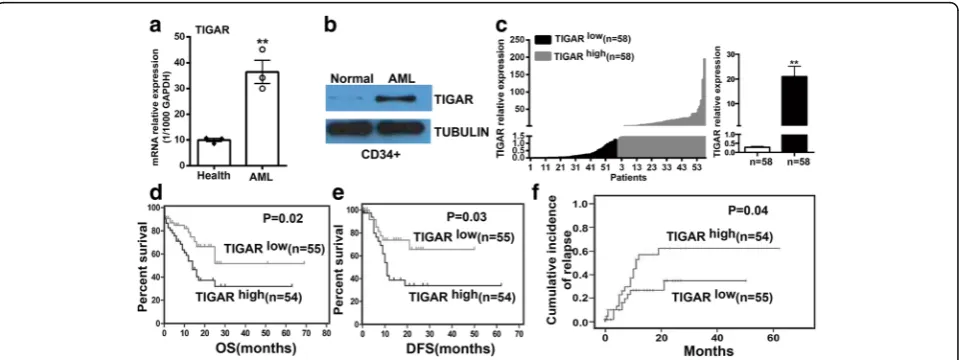
The expression of TIGAR was evaluated in healthy donor and primary AML samples by real-time PCR. TIGAR was significantly upregulated in primary AML blood cells in comparison with healthy human blood cells (Fig. 1a). The upregulation of TIGAR was also shown in CD34+ BM cells from healthy donor or AML patients by western blotting (Fig. 1b). To understand the expression of TIGAR in the population of AML patients, we collected 116 AML patients and measured the TIGAR expression in BM cells from AML patients by real-time PCR. Those patients from TIGARhigh group showed a robust upregulation of TIGAR gene in BM cells in comparison with patients fromTIGARlow group (Fig. 1c).
To investigate whether upregulation of TIGAR was associated with prognosis in AML patients, we further analyzed the association ofTIGARexpression with prog-nosis in those AML patients with median age 48 years (range, 12–86 years). Eighty-two (70.7%) patients were aged <60 years (“younger patients”), and 34 (29.3%) pa-tients were aged≥60 years (“older patients”). The clinical characteristics of these patients were shown in Table 1. There was no significant difference between the two groups for most clinical characteristics, including white blood cell count, hemoglobin level, platelet count, % per-ipheral blood (PB) blasts, and % BM blasts. In addition, no association was found between TIGAR expression and mutations in the NPM1, FLT3-ITD, c-KIT, or P53
genes; however, the patients fromTIGARlowgroup were more prone to have highCEBPAexpression (P= 0.0453). The median survival of the entire cohort was 25 months (2–69 months). The 109 patients from TIGARhigh
and TIGARlow
groups had a similar rate of complete re-sponse (CR) (74.5 vs. 72.7%). However, the 55 patients from TIGARlow group showed a significantly longer OS (P= 0.021) (Fig. 1d) and disease-free survival (DFS) (P= 0.028) (Fig. 1e) and a lower cumulative incidence of re-lapse (P= 0.044) (Fig. 1f ) than patients fromTIGARhigh group. The 54 patients from TIGARhigh group also showed a trend towards a higher relapse rate than those from TIGARlow group (29.1 vs. 18.2%), although statis-tical significance was not reached.
A multivariate analysis was conducted to determine the prognostic significance of TIGAR expression with consideration of other known risk factors, including age, white blood cell count (WBC), and different chemother-apy regimens (Table 2). We found that low TIGAR expression was associated with a reduction in the risk of death (P= 0.023; Table 3). Younger age was also associ-ated with longer survival (P= 0.025, Table 3). In addition, a high proportion of BM blasts (P= 0.058, Table 3) and chemotherapy (P= 0.078, Table 3) may be also involved into longer survival of AML patients.
TIGAR showed a high expression in human leukemia cell lines and glycolysis induced the expression of TIGAR Because p53 null or mutant human tumor cell lines showed a significant high basal level of TIGAR protein expression regulated by p53-independent mechanisms [8], we decided to test the expression of TIGAR in sev-eral established human p53 null or mutant acute leukemia cell lines to identify the leukemia cell line with
high expression of TIGAR. Four different acute leukemia cell lines: HL-60, K562, Jurkat, and NB-4 were tested. HL-60 and Jurkat were p53 null leukemia cell lines while K562 and NB-4 were p53-mutant leukemia cell lines. Among them, HL-60 and NB-4 were acute promyelocy-tic leukemia cell lines (the M3 subtype of AML). The K562 was derived from a CML patient in blast crisis. Jurkat was acute lymphoblastic leukemia cell line. Con-sistent with the previous study in human tumor cell lines, TIGAR was highly expressed in those p53 null or mutant leukemia cell lines than in normal cells, particu-larly for HL-60 cells (Fig. 2a, b). Therefore, HL-60 and NB-4 acute promyelocytic leukemia cell lines were se-lected for subsequent in vitro or in vivo experiments. The K562 with a relative low expression of TIGAR was also tested.
Table 1Clinical characteristics of the patients with CN-AML according to their TIGAR expression levels
TIGARhigh TIGARlow P
Age (years), median (range) 49 (15–80) 47 (12–86) 0.798
Gender, male/female 29/29 28/30 1.000
WBC, median (range) (×109/L) 26 (0.6–291) 34 (1.3–299) 0.995
Hb, median (range) (g/L) 79 (39–154) 87 (39–148) 0.398
PLT, median (range) (×109/L) 42 (10–190) 37 (2–295) 0.190
PB blasts (%), median (range) 66 (0–98) 65 (0–96) 0.525
BM blasts (%), median (range) 75 (11.6–96.2) 72 (24–93.6) 0.870
NPM1 (+) 25.0% (12/48) 22.0% (11/50) 0.726
CEBPA (+) 14.6% (7/48) 31.9% (15/47) 0.045
FLT3-ITD (+) 12.5% (6/48) 15.7% (8/51) 0.649
C-KIT (+) 6.3 (3/48) 6.3% (3/48) 1.000
p53 mutation 2.1% (1/48) 2.0%(1/51) 1.000
BMbone marrow,Hbhemoglobin,PBperipheral blood,PLTplatelets,
WBCwhite blood cells
Table 2Chemotherapy regimens of AML patients
Induction Consolidation Case numbers
Dosage of anthracyclines (each course)
IA Intermediate dose cytarabine
74 Idarubicin 12 mg/m2/day, IV, day 1 to 3
CAG CAG 12 Aclarubicin 10 mg/day, IV,
day 1 to 8
DCAG DCAG 23 Aclarubicin 10 mg/day, IV,
day 3 to 6
IA: idarubucin 12 mg/m2
once daily intravenous (IV) from day 1 to 3 combined with cytarabine 100 mg/m2
continuous intravenous (CIV) from day 1 to 7. CAG: granulocyte colony-stimulating factor (G-CSF) of 300μg/day (day 0–14) subcutaneous injection (SQ) for priming combined with cytarabine of 10 mg/m2 SQ q12h for 14 days (day 1–14), aclarubicin of 10 mg/day IV for 8 days (day 1–8). The G-CSF priming was discontinued if white blood count (WBC) was >20 × 109
/L. DCAG: decitabine of 15 mg/m2
IV for 5 days (day 1–5) and G-CSF of 300μg/day (day 0–9) SQ for priming combined with cytarabine of 10 mg/m2SQ q12h for 7 days (day 3–9), aclarubicin of 10 mg/day IV for 4 days (day 3–6). The G-CSF priming was discontinued if WBC was >20 × 109
/L
Table 3Multivariate analysis of factors associated with OS in patients with CN-AML
B SE Wald P Exp (B) 95% CI
Age 0.039 0.017 5.017 0.025 1.040 1.005 to 1.076
WBC −0.004 0.004 1.250 0.264 0.996 0.989 to 1.003
Hb 0.008 0.009 0.769 0.381 1.008 0.990 to 1.027
PLT 0.003 0.003 1.242 0.265 1.003 0.997 to 1.009
PB blasts −0.006 0.011 0.326 0.568 0.994 0.972 to 1.016
BM blasts 0.029 0.015 3.584 0.058 1.030 0.999 to 1.061
Allo-SCT 0.323 0.614 0.277 0.599 0.724 0.217 to 2.411
NPM1 −0.197 0.432 0.209 0.648 0.821 0.352 to 1.914
CEBPA −0.880 0.543 2.620 0.106 0.415 0.143 to 1.204
FLT3-ITD −0.980 0.804 1.484 0.223 0.375 0.078 to 1.816
C-KIT −12.589 644.378 0.000 0.984 0.000
TIGAR 0.868 0.381 5.200 0.023 2.383 1.130 to 5.025
Chemotherapy 0.587 0.333 3.114 0.078 1.799 0.937 to 3.455
Allo-SCTallogeneic hematopoietic stem cell transplantation,BMbone marrow,
Next, we tested whether glycolysis may induce TIGAR expression in human acute leukemia cells. CoCl2 was
used to stimulate glycolysis, and the glycolytic inhibitor 2-DG was used to block the glycolysis in leukemia cells [24, 25]. We showed that CoCl2 increased the F2,6BP
while 2-DG reduced the F2,6BP in HL-60 cells (Additional file 1: Figure S1). The effects of CoCl2and
2-DG on the expression of TIGAR were also tested in HL-60 and NB-4 cells. CoCl2 significantly increased
mRNA expression of TIGAR in both HL-60 and NB-4 cells (Fig. 2c). In contrast, the glycolytic inhibitor 2-DG did not affect the expression ofTIGARin leukemia cells (Fig. 2c). In addition, we validated that the expression of TIGAR was induced by CoCl2 but not 2-DG, and the
CoCl2-induced expression of TIGAR was reversed by
TIGAR knockdown in HL-60 cells (Fig. 2d). We also overexpressed TIGAR in K562 cells (TIGAR low expressed acute leukemia cell line) and found that 2-DG but not CoCl2 induced the expression of TIGAR in
K562 cells slightly (Fig. 2e). Neither 2-DG nor CoCl2
further increased the expression of TIGAR in TIGAR -overexpressed K562 cells (Fig. 2e). Those results sug-gested that some human acute leukemia cells showed a high expression of TIGAR, and glycolysis may induce the TIGAR expression in human leukemia cells.
TIGAR regulated the glycolysis through PFKFB3 in human acute leukemia cells
in leukemia cells. PFKFB3 was an important glycolytic ac-tivator and active PFKFB3 induced PFK1 activity and led to glycolysis in cancer cells (Additional file 2: Figure S2a). Therefore, we determined to test whether TIGAR affected the expression of PFKFB in leukemia cells. Knockdown of TIGAR robustly increased the expression of PFKFB3 in HL-60 cells while overexpression of TIGAR reduced the expression of PFKFB3 in K562 cells (Additional file 2: Figure S2b). Furthermore, we found that the AML drug decitabine, hypomethylating DNA by inhibiting DNA methyltransferase, significantly reduced the expression of TIGAR while induced the expression of PFKFB3 in HL-60 cells (Additional file 2: Figure S2c). In addition, Cocl2
induced the TIGAR and reduced PFKFB3 while 2-DG induced PFKFB3 in decitabine treated HL-60 cells (Additional file 2: Figure S2c). Similarly, Cocl2
in-duced TIGAR and rein-duced PFKFB3 in NB-4 cells (Additional file 2: Figure S2d). Those results sug-gested that PFKFB3 might also be a potential mechanism of TIGAR regulating glycolysis in human leukemia cells.
TIGARknockdown inhibited the proliferation of leukemia cells and sensitized leukemia cells to glycolysis inhibition in vitro
As TIGAR showed a high expression in primary AML cells and human acute leukemia cell lines, we next tested whetherTIGAR knockdown may affect the proliferation of acute leukemia cells. BecauseTIGARknockdown acti-vated the glycolysis in leukemia cells, we also tested whether the glycolysis inhibitor may show a combin-ational effect with TIGAR knockdown. TIGAR shRNA
constructs by targeting distinct TIGAR sequence was stably introduced into two different leukemia cell lines: HL-60 and NB-4. We next tested whether TIGAR knockdown affected the proliferation of HL-60 and NB-4 cells. Knockdown of TIGARsignificantly inhibited the growth of both HL-60 and NB-4 cells (Fig. 4a, b). As we showed that glycolysis inhibitor 2-DG did not affect the expression of TIGAR, it suggested that 2-DG and TIGAR may affect the leukemia glycolysis through differ-ent mechanisms. Therefore, we tested whether TIGAR knockdown had a combinational effect with glycolysis in-hibitor: 2-DG. TIGAR shRNA but not NTC shRNA showed a dramatically combination effect with 2-DG in both HL-60 and NB-4 cells (Fig. 4a, b). In contrast,TIGAR knockdown did not show any combinational effect with CoCl2(Fig. 4a, b). Next, we determined to understand the
potential mechanism of the combination effect of 2-DG andTIGARknockdown. Under normal conditions, HL-60 and NB-4 cells showed a high TIGAR protein expres-sion and a low level of apoptosis. Knockdown ofTIGAR significantly increased leukemia cell apoptosis in both HL-60 and NB-4 cell lines (Fig. 4c), indicating a potential anti-apoptotic effect of TIGAR. CoCl2, inducting cell
percentage of cell death/necrosis in 2-DG-treated leukemia cells (Additional file 3: Figure S3). These re-sults suggested that TIGAR knockdown inhibited the proliferation of HL-60 and NB-4 cells, and 2-DG-caused glycolysis inhibition showed a synergistic effect with TIGAR knockdown in inhibiting leukemia cell proliferation.
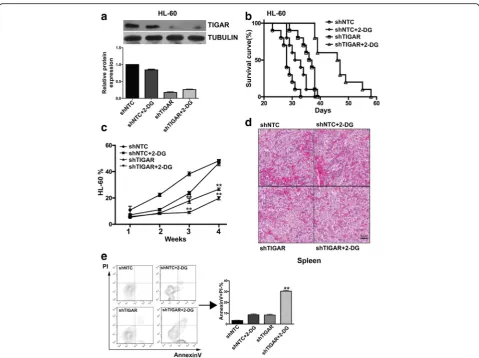
TIGARknockdown sensitizes HL-60 leukemia cells to glycolysis inhibition in vivo
To further validate the effect of TIGAR knockdown on leukemia cell proliferation, the effect of TIGAR knock-down and TIGAR knockdown in combination with 2-DG were tested in HL-60 xenograft mouse model. TIGAR shRNA alone inhibited HL-60 cells growth by around 45%, and the survival of AML mice was ex-tended, and knockdown was confirmed (Fig. 5a–c). 2-DG alone at tolerated dosage (10 mg/kg PO, qd) did not inhibit HL-60 leukemia cell growth at the endpoint but extended survival of AML mice mildly (Fig. 5a–c). More strikingly, TIGAR knockdown and 2-DG combination inhibited HL-60 cells growth by 59% and extended the survival of HL-60 cells xenograft mice significantly (Fig. 5a–c). TIGAR knockdown and 2-DG combination also significantly reduced leukemia cells in the spleens from HL-60 cells xenograft mice (Fig. 5d). We also measured the apoptosis rates among different groups. As expected, the combination of 2-DG and TIGAR
knockdown significantly increased the leukemia cell apoptosis (Fig. 5e). These results suggest that TIGAR is important for glycolysis of leukemia cells, and TIGAR knockdown sensitizes human leukemia cells to glycolysis inhibition both in vitro and in vivo.
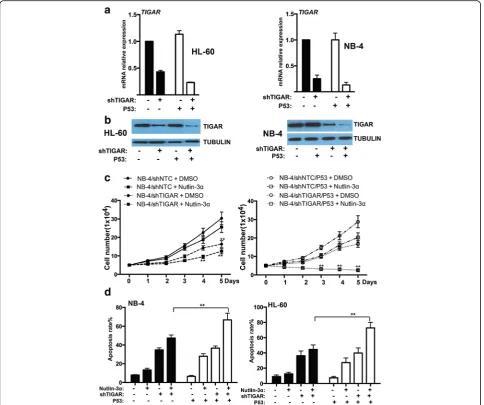
The expression and functional effect of TIGAR were uncoupled from p53 in HL-60 and NB-4 cells
p53 is disabled in HL-60 and NB-4 cell lines by either deletion (HL-60) or missense mutation (NB-4) of the p53 gene. As TIGAR was induced by p53 and protected cancer cell from death, we next investigated whether the expression or function of TIGAR may be affected by overexpression p53 in leukemia cells. We stably trans-fected with wild type p53 into leukemia cells and the overexpression of p53 was confirmed by western blot (Additional file 4: Figure S4). We found that TIGAR ex-pression was mildly enhanced by p53 in both HL-60 and NB-4 cells stably transfected with p53 (Fig. 6a, b). In addition,TIGAR shRNA showed a better knockdown ef-fect on leukemia cells transef-fected with p53. Those results implied that TIGAR expression might be uncoupled from p53 in leukemia cells.
significant combinational effect withTIGAR knockdown in NB-4 leukemia cells. TIGAR knockdown/Nutlin-3α/ p53 overexpression showed a best effect on inhibiting leukemia cell proliferation (Fig. 6c). Consistent with leukemia cell proliferation, leukemia cell apoptosis was robustly increased by the combination of p53 overexpres-sion, TIGAR knockdown, and Nutlin-3α in both HL-60 and NB-4 leukemia cells (Fig. 6d). In addition, the inhibition of cell proliferation may be due to cell death/ necrosis. We also measured the cell death/necrosis and showed that the cell death/necrosis rate was relatively low among the different groups (Additional file 5: Figure S5). These results suggested that overexpression of p53 only
slightly affected TIGAR expression in human leukemia cells, and p53 activation had a combinational effect on inhibiting leukemia cell proliferation and promoting leukemia cell apoptosis.
Discussion
irrespective of age, WBC count, karyotype, and other gen-etic markers. Chemotherapy regimen was also an important factor to affect the outcome of AML patients. In our study, three chemotherapy regimens were used among AML pa-tients with high or low TIGAR expression. The multivariate analysis showed that these chemotherapy regimens (P= 0.078) as well as BM blast (P= 0.058) may also affect the outcome of patients with CN-AML. Furthermore, high ex-pression of TIGAR showed an anti-apoptotic effect on hu-man leukemia cells, which may contribute to the poor OS and higher cumulative incidence of relapse in patients with CN-AML treated with chemotherapy. The relation-ship between TIGAR expression and prognosis in patients with solid cancers was also shown in multiple studies [11,
TIGAR affects the response of leukemia cells to chemo-therapy or targeted chemo-therapy.
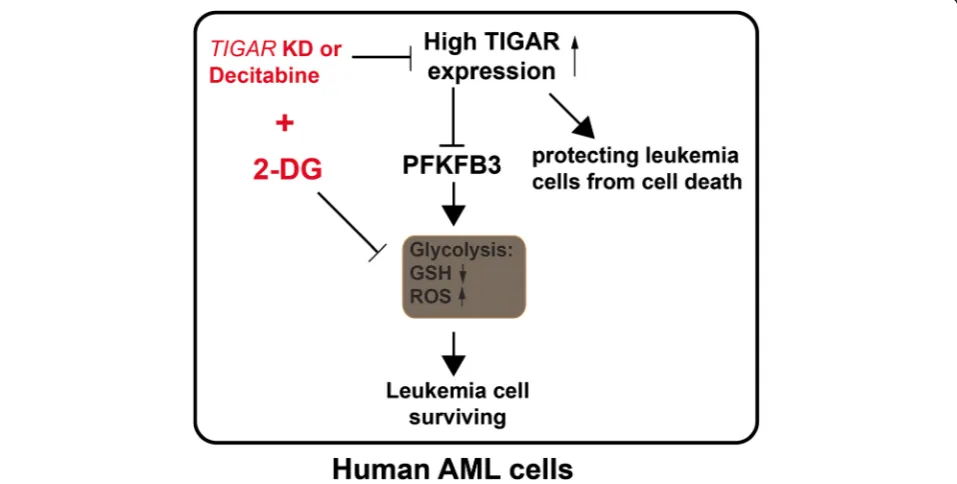
TIGAR might have a dual effect on the proliferation of leukemia cell (Fig. 7). On the one hand, TIGAR inhibited glycolysis through PFKFB3 in leukemia cells [29]. TIGAR inhibited glycolysis, decreased ROS, and in-creased GSH levels. Knockdown of TIGAR induced while overexpression of TIGAR reduced the expression of glycolysis activator PFKB3 in leukemia cells. High levels of glycolysis in cancer cells have been linked to poor prognosis and chemotherapy resistance [30, 31]. Highly glycolytic AML blasts are more resistant to com-bined all-trans retinoic acid and arsenic trioxide treat-ment than moderately glycolytic blasts [31]. Therefore, high expression of TIGAR inhibited the glycolysis of leukemia cells and led leukemia cells to sensitive to chemotherapy. On the other hand, our results also showed that TIGAR protected leukemia cells from cell death. Knockdown ofTIGARled a significant increase of cell apoptosis in human leukemia cells. In contrast, TIGAR knockdown also promoted the glycolysis in leukemia cells. Our studies showed that TIGAR related anti-apoptosis and lower glycolysis might maintain a steady-state. Our results also showed that glycolysis in-hibition or TIGAR knockdown alone only caused the limited apoptosis of leukemia cells. In contrast, a robust leukemia cell apoptosis was observed when leukemia cells with simultaneous impairment of TIGAR expres-sion and glycolysis. In addition, TIGAR knockdown in
combined with 2-DG also mildly enhanced cell death/ necrosis of leukemia cells. The mechanism of TIGAR regulating the cell apoptosis or necrosis and glycolysis of leukemia cells was still not clear. More studies should be done to illustrate the underlying process.
TIGAR might be a novel target for treating human acute leukemia. Knockdown ofTIGARinhibited the pro-liferation of human leukemia cells and sensitized leukemia cells to glycolysis inhibitor 2-DG both in vitro and in vivo. In addition,TIGAR knockdown in combin-ation with 2-DG led leukemia cells to apoptosis. As sup-pressing glycolysis with inhibitors was not effective at killing tumor cells, its combination with other tumor-specific metabolic inhibitors may be necessary for thera-peutic intervention [32]. SilencingTIGAR also enhanced the radiosensitivity of U87MC and glioma cells [13]. Our findings suggest that combining glycolytic inhibitors with a potential TIGAR inhibitor and current standard chemotherapy may be a powerful and effective treatment for not only human leukemia but also other cancer types. More efforts are needed to develop the potent and specific small molecule compound for TIGAR.
However, TIGAR expression and its anti-apoptotic ef-fect were uncoupled from p53 in human leukemia cells. In normal cells, TIGAR transcription was rapidly acti-vated by p53 in response to low levels of cellular stress. In human tumor cells, the expression of TIGAR was regulated by p53 dependent or p53-independent mecha-nisms [8]. In wild-type p53 tumor cell line, the basal
expression of TIGAR was relatively low and the induc-tion of p53 led to an increased expression of TIGAR protein [8]. However, p53 null or mutant human tumor cell lines including H1299, U2OS, and RKO showed a significant basal level of TIGAR protein expression, which indicated the existence of p53-independent mech-anisms to regulate TIGAR expression in human cancer cells [8]. In human p53 null or mutant leukemia cells, overexpression of p53 did not significantly induce the expression of TIGAR. Our observation was also sup-ported by other studies, which also showed thatTIGAR expression was regulated by other non-p53 mechanisms in human cancer cell line [8, 33, 34].
Conclusions
In summary, our study showed that highTIGAR expres-sion was associated with poor survival and a high inci-dence of relapse in adult patients with CN-AML, even after adjustment for known clinical and common molecu-lar risk factors. Moreover, sustained TIGAR activation, uncoupled from p53, may support AML cell growth and survival. TIGAR in cooperation with glycolysis had a strong anti-apoptotic effect in AML cells. Therefore, the combination of TIGAR inhibitors with anti-glycolytic agents may be powerful novel therapies for the future clin-ical use in AML patients.
Additional files
Additional file 1: Figure S1.F2,6BP level was affected by Cocl2or 2-DG in HL-60 cells. (JPEG 860 kb)
Additional file 2: Figure S2.a. PFKFB3 regulated glycolysis in cancer cells. b. Western blotting showed the expression of PFKFB3 in HL-60 cells withTIGARknockdown and in K562 cells withTIGARoverexpression. c. Western blotting showed the expression of TIGAR and PFKFB3 in HL-60 cells treated with decitabine in combination with Cocl2or 2-DG. d. Western blotting showed the expression of TIGAR and PFKFB3 in NB-4 cells treated with Cocl2or 2-DG. (JPEG 1536 kb)
Additional file 3: Figure S3.The cell death/necrosis rate was determined by FACS in both 2-DG treated HL-60 and NB-4 cells with or withoutTIGARknockdown. (JPEG 851 kb)
Additional file 4: Figure S4.Overexpression of p53 in NB-4 or HL-60 cells. (JPEG 1341 kb)
Additional file 5: Figure S5.TIGARknockdown in combination with p53 overexpression or/and MDM2 inhibitor Nutlin-3αdid not affect the cell death/necrosis of NB-4 cells in vitro.NB-4 cells with or without TIGAR knockdown in combination with p53 overexpression or/and MDM2 inhibitor Nutlin-3αwere collected on day 2 post Nutlin-3αtreatment, and the death cells were determined by FACS. (JPEG 943 kb)
Abbreviations
2-DG:2-Deoxy-D-glucose; AML: Acute myeloid leukemia; CN-: Cytogenetically normal; CoCl2: Cobalt chloride; CR: Complete remission; DFS: Disease-free survival; FBPase-2: Bisphosphatase domain; Fru-2: 6-P2, fructose-2, bisphosphate; GSH: Glutathione; OS: Overall survival; PFK-2/FBPase: 6-phosphofructo-2-kinase; PI: Propidium iodide; PPP: Pentose phosphate pathway; ROS: Reactive oxygen species; WBC: White blood cell count; WT: Wild-type
Acknowledgements
We are very grateful to Chun Qiao for the excellent technical assistance.
Funding
This work was supported by the National Natural Science Foundation of the People’s Republic of China (No. 81070437, 81270614, 81300379, 81570134, 81570141, 81522001, 81200362), National Public Health Grand Research Foundation (No.201202017), A Project Funded by the Priority Academic Program Development of Jiangsu Higher Education Institute (No. JX10231801), and Key Project of Jiangsu Province Health Agency (K201107).
Authors’contributions
SQ and YC designed the experiments, performed the experiments, wrote the manuscript, and analyzed the data. JL, MH, and YZ analyzed and interpreted data and wrote the manuscript. HZ, YX, JH, YL, YL, SW, and JM have contributed to data preparation, providing clinical data, and revising the manuscripts. All authors read and approved the final manuscript.
Availability of data and materials
The datasets during and/or analyzed during the current study available from the corresponding author on reasonable request.
Competing interests
The authors declare that they have no competing interests.
Consent for publication Not applicable.
Ethics approval and consent to participate
This study was approved by the institutional review board of the First Affiliated Hospital of Nanjing Medical University and carried out in accordance with the Declaration of Helsinki. All patients and normal donors provided written informed consent.
Received: 13 July 2016 Accepted: 17 November 2016
References
1. A J, Qian S, Wang G, Yan B, Zhang S, Huang Q, et al. Chronic myeloid leukemia patients sensitive and resistant to imatinib treatment show different metabolic responses. PloS one. 2010;5:e13186.
2. Herst PM, Howman RA, Neeson PJ, Berridge MV, Ritchie DS. The level of glycolytic metabolism in acute myeloid leukemia blasts at diagnosis is prognostic for clinical outcome. J Leukoc Biol. 2011;89:51–5. 3. Zhao K, Zhou Y, Qiao C, Ni T, Li Z, Wang X, et al. Oroxylin A promotes
PTEN-mediated negative regulation of MDM2 transcription via SIRT3-mediated deacetylation to stabilize p53 and inhibit glycolysis in wt-p53 cancer cells. J Hematol Oncol. 2015;8:41.
4. Cheung EC, Athineos D, Lee P, Ridgway RA, Lambie W, Nixon C, et al. TIGAR is required for efficient intestinal regeneration and tumorigenesis. Dev Cell. 2013;25:463–77.
5. Vander Heiden MG, Cantley LC, Thompson CB. Understanding the Warburg effect: the metabolic requirements of cell proliferation. Science. 2009;324:1029–33.
6. Jang M, Kim SS, Lee J. Cancer cell metabolism: implications for therapeutic targets. Exp Mol Med. 2013;45:e45.
7. Dang CV. Links between metabolism and cancer. Genes Dev. 2012;26:877–90. 8. Bensaad K, Tsuruta A, Selak MA, Vidal MN, Nakano K, Bartrons R, et al. TIGAR,
a p53-inducible regulator of glycolysis and apoptosis. Cell. 2006;126:107–20. 9. Lee P, Vousden KH, Cheung EC. TIGAR, TIGAR, burning bright. Cancer
Metab. 2014;2:1.
10. Ros S, Schulze A. Balancing glycolytic flux: the role of 6-phosphofructo-2-kinase/fructose 2,6-bisphosphatases in cancer metabolism. Cancer Metab. 2013;1:8.
11. Won KY, Lim SJ, Kim GY, Kim YW, Han SA, Song JY, et al. Regulatory role of p53 in cancer metabolism via SCO2 and TIGAR in human breast cancer. Hum Pathol. 2012;43:221–8.
13. Sinha S, Ghildiyal R, Mehta VS, Sen E. ATM-NFkappaB axis-driven TIGAR regulates sensitivity of glioma cells to radiomimetics in the presence of TNFalpha. Cell Death Dis. 2013;4:e615.
14. Pena-Rico MA, Calvo-Vidal MN, Villalonga-Planells R, Martinez-Soler F, Gimenez-Bonafe P, Navarro-Sabate A, et al. TP53 induced glycolysis and apoptosis regulator (TIGAR) knockdown results in radiosensitization of glioma cells. Radiother Oncol. 2011;101:132–9.
15. Wanka C, Steinbach JP, Rieger J. Tp53-induced glycolysis and apoptosis regulator (TIGAR) protects glioma cells from starvation-induced cell death by up-regulating respiration and improving cellular redox homeostasis. J Biol Chem. 2012;287:33436–46.
16. Lui VW, Lau CP, Cheung CS, Ho K, Ng MH, Cheng SH, et al. An RNA-directed nucleoside anti-metabolite, 1-(3-C-ethynyl-beta-d-ribo-pentofuranosyl)cytosine (ECyd), elicits antitumor effect via TP53-induced glycolysis and apoptosis regulator (TIGAR) downregulation. Biochem Pharmacol. 2010;79:1772–80. 17. Lui VW, Wong EY, Ho K, Ng PK, Lau CP, Tsui SK, et al. Inhibition of c-Met
downregulates TIGAR expression and reduces NADPH production leading to cell death. Oncogene. 2011;30:1127–34.
18. Yin L, Kosugi M, Kufe D. Inhibition of the MUC1-C oncoprotein induces multiple myeloma cell death by down-regulating TIGAR expression and depleting NADPH. Blood. 2012;119:810–6.
19. Xie JM, Li B, Yu HP, Gao QG, Li W, Wu HR, et al. TIGAR has a dual role in cancer cell survival through regulating apoptosis and autophagy. Cancer Res. 2014;74:5127–38.
20. Fu Y, Zhu H, Wu W, Xu J, Chen T, Xu B, et al. Clinical significance of lymphoid enhancer-binding factor 1 expression in acute myeloid leukemia. Leuk Lymphoma. 2014;55:371–7.
21. Qiao C, Zhang R, Hong M, Wang L, Zhang JF, Wu YJ, et al. Heterogeneous leukemic clones identified by NPM1 mutation analysis in patient with acute monocytic leukemia. Leuk Lymphoma. 2012;53:886–90.
22. Heaney NB, Pellicano F, Zhang B, Crawford L, Chu S, Kazmi SM, et al. Bortezomib induces apoptosis in primitive chronic myeloid leukemia cells including LTC-IC and NOD/SCID repopulating cells. Blood. 2010;115:2241–50. 23. Rastogi RP, Singh SP, Hader DP, Sinha RP. Detection of reactive oxygen
species (ROS) by the oxidant-sensing probe 2′,7′-dichlorodihydrofluorescein diacetate in the cyanobacterium Anabaena variabilis PCC 7937. Biochem Biophys Res Commun. 2010;397:603–7.
24. Hulleman E, Kazemier KM, Holleman A, VanderWeele DJ, Rudin CM, Broekhuis MJ, et al. Inhibition of glycolysis modulates prednisolone resistance in acute lymphoblastic leukemia cells. Blood. 2009;113:2014–21. 25. Huang Y, Du KM, Xue ZH, Yan H, Li D, Liu W, et al. Cobalt chloride and
low oxygen tension trigger differentiation of acute myeloid leukemic cells: possible mediation of hypoxia-inducible factor-1alpha. Leukemia. 2003;17:2065–73.
26. Parikh K, Cang S, Sekhri A, Liu D. Selective inhibitors of nuclear export (SINE)—a novel class of anti-cancer agents. J Hematol Oncol. 2014;7:78. 27. Smith AD, Roda D, Yap TA. Strategies for modern biomarker and drug
development in oncology. J Hematol Oncol. 2014;7:70.
28. Kwee JK. A paradoxical chemoresistance and tumor suppressive role of antioxidant in solid cancer cells: a strange case of Dr Jekyll and Mr Hyde. BioMed Res Int. 2014;2014:209845.
29. Telang S, Clem BF, Klarer AC, Clem AL, Trent JO, Bucala R, et al. Small molecule inhibition of 6-phosphofructo-2-kinase suppresses t cell activation. J Transl Med. 2012;10:95.
30. Beesley AH, Firth MJ, Ford J, Weller RE, Freitas JR, Perera KU, et al. Glucocorticoid resistance in T-lineage acute lymphoblastic leukaemia is associated with a proliferative metabolism. Br J Cancer. 2009;100:1926–36. 31. Herst PM, Hesketh EL, Ritchie DS, Berridge MV. Glycolytic metabolism
confers resistance to combined all-trans retinoic acid and arsenic trioxide-induced apoptosis in HL60rho0 cells. Leuk Res. 2008;32:327–33. 32. Vuyyuri SB, Rinkinen J, Worden E, Shim H, Lee S, Davis KR. Ascorbic acid
and a cytostatic inhibitor of glycolysis synergistically induce apoptosis in non-small cell lung cancer cells. PLoS One. 2013;8:e67081.
33. Madan E, Gogna R, Bhatt M, Pati U, Kuppusamy P, Mahdi AA. Regulation of glucose metabolism by p53: emerging new roles for the tumor suppressor. Oncotarget. 2011;2:948–57.
34. Ok CY, Patel KP, Garcia-Manero G, Routbort MJ, Peng J, Tang G, Goswami M, et al. TP53 mutation characteristics in therapy-related myelodysplastic syndromes and acute myeloid leukemia is similar to de novo diseases. J Hematol Oncol. 2015;8:45.
• We accept pre-submission inquiries
• Our selector tool helps you to find the most relevant journal • We provide round the clock customer support
• Convenient online submission • Thorough peer review
• Inclusion in PubMed and all major indexing services • Maximum visibility for your research
Submit your manuscript at www.biomedcentral.com/submit