TRAVEL INDUSTRY
WARRENLIEBERMAN Veritec Solutions Belmont,
California
Yield Management1could easily turn out to be the most important pricing breakthrough of the 20thCentury—Professor James Makens, Wake Forest University [1]
. . .look to yield management at the airlines as the model for future pricing in fields as diverse as health care, telecommunications, consumer financial services, insurance, hotels and government services. Yield management techniques will rewrite the
supply-and-demand equations that determine service availability and price [2]
[Yield Management] promises to spearhead a revolution in pricing strategies during this decade [3]
Yield Management is the single most important technical development in
transportation management since we entered the era of airline deregulation in 1979—Bob Crandall, former CEO and President of AMR and American Airlines [4]2
We estimate that yield management has generated $1.4 billion in incremental revenue in the last three year years [for American Airlines]. . .We expect yield management to generate at least $500 million annually for the foreseeable future—Bob Crandall [4]
. . .our competitors used. . .Yield Management in every one of our markets, and they pushed
1As the practice of yield management spread beyond the airline industry, the term changed to revenue management. Except for providing back-ground on the term’s evolution, and in keeping with the title of this article, we generally refer to the discipline of forecasting customer demand and available supply in real-time and using that information to control product availability and dynamically set prices so as to maximize profits, as revenue management.
2This quote has become well known and is often cited; see, for example, Refs 8, 41.
Wiley Encyclopedia of Operations Research and Management Science, edited by James J. Cochran Copyright2010 John Wiley & Sons, Inc.
we go wrong?. . .we didn’t get our hands around the Yield Management—Don Burr, former CEO of People Express Airlines [5–8] If I were in charge of the antitrust division, I would damn well see if I could build a case that yield management is predatory
pricing—Alfred Kahn, former Chairman of the Civil Aeronautics Board under President Carter and known as the father of airline deregulation [9]
Yield management as it applies to airlines is the control and management of reservations inventory in way that increases (maximizes, if possible). . .profitability,given the flight schedule and fare structure. [emphasis added] [4]
Revenue Management is the art and science of predicting real-time customer demand at the micromarket level and optimizing the price and availability of products [8].
INTRODUCTION
The methods and information used by firms in the travel industry that govern the range of products they offer for sale, the number of sales they make, and the prices they charge have undergone dramatic change in the past 30 years. As noted in the above quotes, these changes have revolutionized the travel indus-try and are penetrating other industries as well.
Whereas some of these decisions were once based on intelligent ‘‘rules-of-thumb,’’ they now draw on sophisticated mathemat-ical models. In some cases, the advances in decision support tools in combination with advances in electronic distribution and management of inventory have enabled travel firms to offer and manage products that would not otherwise have been possible. Further, the financial gains made possible by these developments, initially known as yield management (YM) and later as revenue management (RM), have been extraordinary. This article provides an historical overv-iew of why and how this transformation occurred. Much of the discussion on the
early stages of yield management is oriented towards the airline industry, as it provided the initial setting for the early innovations— innovations that soon spread to other industries. As yield management evolved into other industries and became known as
revenue management, the discipline broad-ened from optimizing capacity controls (e.g., the maximum number of sales that were allowed at previously established prices) to include pricing optimization (e.g., deter-mining what prices should be). The latter portions of this article are oriented around the expanding practice of the discipline and its adoption by other segments of the travel industry.
Often misunderstood, yield or revenue management has now attained a promi-nent position among the strategies and tactics travel companies use to obtain a competitive advantage over their rivals. As might be gleaned from the quotes above, it is a relatively new way of doing business and many believe it to be an extraordinarily powerful technology. CEOs of companies that invested in it have extolled its virtues as well as its importance for achieving better financial returns. This article provides an overview of what revenue management is, how it evolved in the travel industry, and why it attracts strong interest.
FROM YIELD TO REVENUE: A HISTORICAL OVERVIEW
It is frequently suggested that the science, if not the practice of yield management orig-inated in the US airline industry in the early 1980s, shortly after it was deregulated in 1978. In fact, the early stages of yield management date back quite a bit further, probably to the 1960s. Until 1985, however, the practice attracted limited attention, was narrow in scope, and remained within the airline industry.
For many years, it would not be unusual for 15% or more of those who purchased airline tickets to fail to show up for their flights. In part, this occurred because unused
tickets were fully refundable.3 For flights in high demand, more tickets would be sold than there were seats on the plane. Known as overbooking, this practice was routinely carried out by the airlines but it did not attract widespread attention until Allegheny Airlines did not allow Ralph Nader to board his flight in 1972. Nader sued Allegheny and the lawsuit eventually went to the US Supreme Court in 1976 [10]. Overbooking decisions based on mathematical models that seek to maximize financial returns subject to customer service constraints constitute a core element of many airline revenue management programs. Indeed, the first phase of revenue management essentially consisted solely of overbooking.
Until 2000 or perhaps even later, most air-line yield management departments did not set prices, but rather focused on controlling the availability of reservation or seat inven-tory at different prices with the objective of maximizing net revenue. The actual prices at which tickets could be sold were deter-mined by Pricing Departments. Although Yield Management had no responsibility for setting prices, it determined which fares and how many tickets at each fare could be pur-chased on each flight. In part, this resulted from the organizational structure of most airlines, whereby the Pricing Department and the Inventory Control or Yield Manage-ment DepartManage-ment, were separate.4 Indeed, in 1985 when American Airlines launched its Ultimate Super Savers fares—discounts of up to 70% with restrictions such as 30-days advance purchase, 7-day minimum stay, and only partially refundable—enabling the airlines to compete for passengers in radically new ways, its yield management department was not made aware of the new fares until they were announced to the public. This organizational decision resulted
3Today, the frequency with which passengers fail to show up for their flights is much less, as many of the tickets sold are nonrefundable.
4During the late 1990s, some airlines began to restructure their organizations, consolidating pric-ing and inventory functions or havpric-ing these staff work in a more coordinated manner.
in significant revenue dilution. The fares stimulated so much demand, so quickly, even for flights 6–12 months in the future, that American’s yield managers could not react fast enough to reset fare and booking controls on all flights to limit the sale of Ultimate Super Saver fares to appropriate levels. Seats that could have been sold to business travelers who were willing to purchase tickets at higher fares, but would not do so until closer to the date of their flight’s departure, were instead occupied by those who purchased fares for up to 70% less. Many flights generated less revenue and profit than they otherwise might have.
Prior to the late 1980s and the adoption of revenue management by travel firms other than airlines, yield management decisions were essentially limited to two decisions:
• the number of reservations to accept for a flight;
• the fares, previously established by the pricing department, that should be offered for purchase to potential customers for a flight at various times prior to departure (the actual setting of fares was thus done outside of yield management; yield management only controlled which of the fares were available for purchase).
As we will soon discuss, one of the most innovative as well as revenue enhancing ele-ments of airline yield management programs was that by introducing purchase restrictions on airline tickets—often termed fences—a
single product could be sold, simultaneously, at multiple prices.
Yieldhad a specific meaning in the airline industry, being related to revenue in two ways:
1. Revenue per available seat-mile or revenue per available seat-kilometer (RASM and RASK) provided a mea-sure of revenue per unit of capacity. 2. Revenue per passenger-mile or
rev-enue per passenger-kilometer (RPM or RPK) offered a normalized measure of fares paid.
Because the two types of reservation con-trols noted above had clear and direct impacts on both measures of yield, the term yield managementseemed apt.
In the late 1980s and early 1990s, as the practice of yield management spread to hotels, car rental firms, passenger railroads, cruise lines, and other segments of the travel industry, the phrase ‘‘yield management’’ was often viewed as airline jargon. Other compa-nies typically focused on revenue and profit, not yield. The term became increasingly troversial. Even as they embraced its con-cepts, many sought a different label for the practice of revenue maximization through inventory allocation controls.
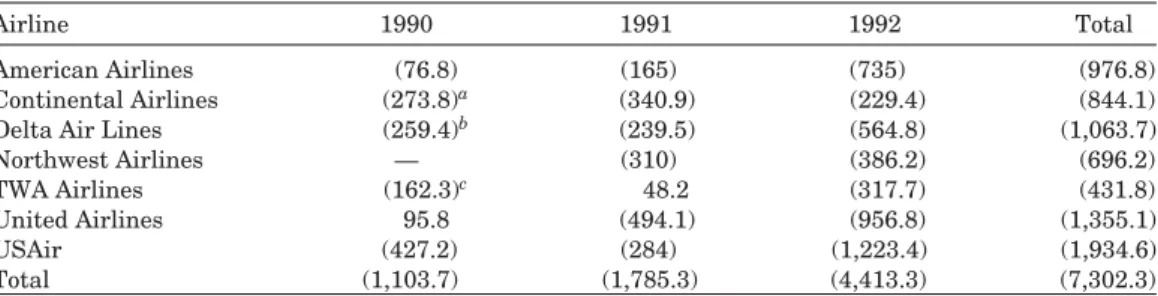
The search for a new label may well have been accelerated by the airline industry’s financial difficulties in 1990, 1991, and 1992. Table 1 highlights the financial difficulties experienced by the largest seven US airlines during these years. With some exceptions,
Table 1. Net Earnings of the Seven Largest US Airlines, 1990–1992 ($000,000)
Airline 1990 1991 1992 Total
American Airlines (76.8) (165) (735) (976.8)
Continental Airlines (273.8)a (340.9) (229.4) (844.1)
Delta Air Lines (259.4)b (239.5) (564.8) (1,063.7)
Northwest Airlines — (310) (386.2) (696.2) TWA Airlines (162.3)c 48.2 (317.7) (431.8) United Airlines 95.8 (494.1) (956.8) (1,355.1) USAir (427.2) (284) (1,223.4) (1,934.6) Total (1,103.7) (1,785.3) (4,413.3) (7,302.3) aOperating loss.
bFor the six months ending December 31, 1990. cOperating loss.
the airlines generally lost at least several hundred million dollars each year and some-times much more than that [11,12]. The seven airlines combined for a loss of more than $7 billion during these three years.
Revenue management, a name far more industry neutral, began to gain favor. Refer-ences to revenue enhancement and revenue management replacing yield management can be found as early as 1990 and began to proliferate thereafter [13–14].
For many, the desire to ‘‘rebrand’’ yield management dovetailed nicely with the desire to broaden its scope to include a wider array of reservation inventory controls than used by airlines, explicit recognition of vari-able costs, and price optimization (that is, the determination of the best prices to offer). For example, cruise ships might offer 8–12 cabin categories; cruise line yield management inventory controls explicitly considered the financial impacts of alternative upgrading (and upselling) policies when taking reser-vations, such as allowing some customers to make a reservation for a less expensive cabin category but guaranteeing them accommodation in a more expensive cabin category. Yield management also led cruise lines to reevaluate and modify the price dif-ferentials between cabin categories, as supply and demand imbalances at the cabin category level were analyzed with greater precision. The wider array of variable costs associated with hotel stays led hotel yield management efforts to consider profit, rather than revenue. Yield management thus expanded to include practices beyond those adopted by airlines.
By 1993, revenue management was well on its way to replacing yield management. Presentations at multiindustry conferences on this topic included sessions in which speakers differentiated revenue manage-ment from yield managemanage-ment. Perhaps as testament to the strength of this con-version, the annual International Air Transport Association (IATA) Conference on Yield Management, initiated in 1988, was rebranded as the IATA Conference on Revenue Management in 1993; in 2001 it experienced further rebranding, becoming the IATA Revenue Management and Pricing Conference. There now seems to be growing
support for relabeling revenue management as revenue and pricing optimization (RPO).
Firms in virtually every segment of the travel industry now possess revenue man-agement programs. And each year, these programs improve. But let us not get ahead of ourselves. Every story has its beginning and this is certainly true of revenue management. To tell it, we begin with the airline industry.
YIELD MANAGEMENT BEGINS
The total number of reservations that can be accepted for a flight is generally greater than the number of seats on a plane. It is known as the overbooking level, although there was a time, probably short-lived, when airline staff preferred the term ‘‘revenue coor-dination’’ due to the negative connotations of overbooking [15]. Airlines generally overbook a flight in anticipation of reservations being cancelled, passengers with reservations who fail to show up for their flights (no-shows), and other reasons. While overbooking has been a standard airline practice for over 50 years, the science of overbooking took a dra-matic step forward in the mid-1960s. In that respect, this might well mark the beginning of yield management in the travel industry.5 As noted by Rothstein, ‘‘[w]hen our Amer-ican Airlines O[perations] R[esearch] Group initiated its research in 1964, the scant lit-erature on overbooking yielded no models or methods that had been implemented.’’ A year or two later, however, a newly devel-oped overbooking program was implemented at American, dramatically improving the air-line’s ability to forecast oversales (customers with tickets that show up for a flight but for whom no seats are available) and set overbooking levels that allowed the airline to achieve higher load factors on high demand flights, without increasing the number of pas-sengers who were denied boarding [15].
While working in the airline industry in the 1980s, it was the author’s experience that
5Our decision to use the developments in the 1960s as the starting point for yield management reflects our emphasis on the science, not simply the prac-tice, of the discipline.
the overbooking models used by some airlines remained relatively rudimentary while those of others had evolved considerably since the 1960s. At American Airlines, the overbook-ing model developed by Rothstein and his colleagues in the operations research group was replaced in 1976 by one which recog-nized the revenues and costs associated with overbooking levels and attempted to maxi-mize profitability. This model was further enhanced in 1987 [4].
The science of overbooking involves as many as five forecasts:
1. the probability of reservation cancel-lations prior to departure;
2. the probability of passengers with reservations failing to show up for their flight;
3. incremental demand when cancella-tions occur before departure;
4. the cost of oversales (this may not be linear for a flight and also, it varies based on a variety of flight charac-teristics and the ability of the airline to retain the passenger on a different flight that it operates);
5. the incremental revenue obtained from additional reservations.
For operational reasons, it may be desir-able to limit the number of oversales on a flight to a value less than what would be financially optimal. Such constraints have been incorporated into overbooking models.
Forecasting incremental demand (addi-tional demand up to a flight’s departure) allows implementing better overbooking lev-els prior to a flight’s departure. The overbook-ing levels for an optimally managed flight will generally decrease over time; that is, as the number of days before a flight’s depar-ture decreases, so too will its overbooking level. The more likely it is that incremental demand will back-fill cancellations, the lower the levels of pre-departure overbooking. If all goes well, the number of reservations hold-ing at departure will be equal to the desired departure-time booking level.
The financial benefits of overbooking were substantial for airlines, as it probably
allowed some of them to increase their load factors on high demand flights by as much as 10 percentage points (e.g., from 85%–95%), and possibly more. An airline with 750 flights per day, an average fare of $175 per passen-ger per flight, average flight capacity of 120 seats and an annual load factor of 61% would have annual revenues of approximately $3.5 billion. If 10–15% of its flights sold out, sell-ing just one additional seat on these flights increases annual revenue by approximately $4.8–7.2 million. Increasing the load factor of these flights by 10 percentage points could mean an annual increase of $57–86 million. Putting this into context, in 1981 and 1982, on passenger revenues of approximately $3.4 billion, American Airlines had operating income of $44 million in 1981 and lost $18 million in 1982 [16]. To say that an airline’s revenue management capabilities, in terms of the accuracy of its overbooking levels could be the difference between an annual loss or profit, is not much of a stretch.
While the substantial financial benefits to the airlines from overbooking are clear, less visible is the consumer benefit, which can also be substantial. When done well, overbooking allows more consumers the ability to pur-chase and use their product of choice. When advance notice is given that a flight, hotel, or other service is sold out, but actualized demand turns out to be less than capacity, some consumers will have been deprived of their ability to use that service and will have had to choose something less desirable. They will have been inconvenienced unnecessarily. Without a doubt, airline overbooking would not yield nearly the benefits it does had the airlines not adopted a business process they initially heavily resisted. On heavily booked flights, it is relatively common for passengers to inquire whether volunteers are needed to give up their seat on the flight in exchange for some form of compensation and a seat on a later flight. Many show clear disappointment when the airline’s Gate Agent responds that all passengers with reservations can be accommodated on the flight and no such volunteers are needed.
This was not always the case. Prior to 1978, not only did airlines not seek volun-teers, airline executives did not believe that
asking for volunteers would work when more passengers with reservations showed up for a flight than there were seats on the plane. Each airline developed its own rules and pro-cedures for determining who would fly and who would not.
In 1966 and 1967, Professor Julian Simon contacted airlines with an idea for how they could obtain volunteers in exchange for an agreed upon level of compensation. None of the airlines thought much of his proposal, some even being derisive in their replies to him. Rather than let the concept die, he per-sisted in his efforts to obtain support for it [17]. More than 10 years later, his ideas finally took hold when economist Alfred Kahn became head of the Civil Aeronautics Board. The CAB mandated that airlines adopt a plan for obtaining voluntary oversales [18].
Airlines varied in the types of compensa-tion they offered, some giving travel vouchers for use on future trips while others gave free tickets for a future flight.6 The success of each program varied, but overall, the volunteer program enabled airlines to try more aggressively to fill each seat. Between 1978 and 1991, the number of involuntary oversales fell from 6.4 per 10,000 passengers boarded to 1.1 per 10,000, while the number of voluntary oversales during that same period increased from approximately 1 to 15 per 10,000 passengers boarded. As you might imagine, the frequency with which passengers complained about being denied boarding also dropped dramatically [18].
Although the practice of overbooking in the airlines certainly continues, the intro-duction and proliferation of nonrefundable fares has significantly decreased its benefits. The need for overbooking has also declined as cancellation and no-show rates have declined dramatically.
6Offering a credit for future travel may increase an airline’s revenue as it can stimulate trips that would not have been taken and the cost of the trip may be for more than the voucher. Compensating passengers with a free trip does not allow for this. Travel credits are now more typical.
YIELD MANAGEMENT EXPANDS
Prior to the mid-1970s, airline fares were highly regulated. Restriction-based discounted fares, so familiar today, were not available. The discounted fares that were available tended to be oriented to specific groups such as children, stand-by passen-gers, senior citizens, and other class-based categories. The availabilities of these fares were based solely on eligibility.
When the US airline industry was deregulated in 1978, the proponents and the detractors of deregulation envisioned major industry changes. It is safe to say, however, that of the changes that were made possible by deregulation, the fare-related impacts of revenue management were far from anyone’s expectations.
In 1977, just prior to deregulation, Amer-ican Airlines introduced discounted fares known as Super Savers on transcontinental flights and then throughout their system in 1978. These fares were developed in response to an alarming development that began dur-ing the summer of 1976. Businesses had sprung up that organized group charters, buying large blocks of seats from airlines at significant discounts and then re-selling them for prices that were lower than the regular fare. Discussing the situation with his staff, Bob Crandall, who was to become president of American Airlines, but was then head of marketing, said, ‘‘We’re already selling 40 percent of our seats at regular fares, so why can’t we figure out a way to sell the other 60 percent at a fare cheaper than what a charter operator can get?’’ [19].
Super Savers were American’s response and other airlines followed American’s lead. Super Savers required advance purchase and had a 14-day minimum-stay requirement (a round-trip purchase was thus required). Rec-ognizing that business travelers were willing and able to pay higher fares, the restrictions were designed to prevent business travelers from purchasing them. In addition, on many flights the number of Super Saver tickets that could be purchased was controlled (i.e., only a limited number of sales were permitted) to avoid displacing demand from later-booking business travelers who were willing to pay
higher fares. For the most part, the airlines relied on various ‘‘rules-of-thumb’’ and the judgment and intuition of inventory control staff to set and manage discount allocations. Revenue management was expanding from overbooking to discount allocation control, although controlling the number of discount fares sold so as to maximize flight revenue was not carried out with the accuracy or mathematical support that was soon to come. Nonetheless, the introduction of Super Savers was truly a watershed event in the history of revenue management. It was a unique concept. Not only did it allow the same product to be offered for sale at mul-tiple prices simultaneously, but consumers of the products, not the firms that were offering them, were empowered to trade-off purchase and usage restrictions versus price and decide which product to purchase. The number of Super Savers that could be sold on any flight, however, was up to the discretion of the airline.
At this point, it is useful to examine two key points in more detail:
1. Large financial benefits are possible when a seemingly homogeneous prod-uct is sold for multiple prices.
2. The extent to which these gains are achieved depends on how well these sales are controlled.
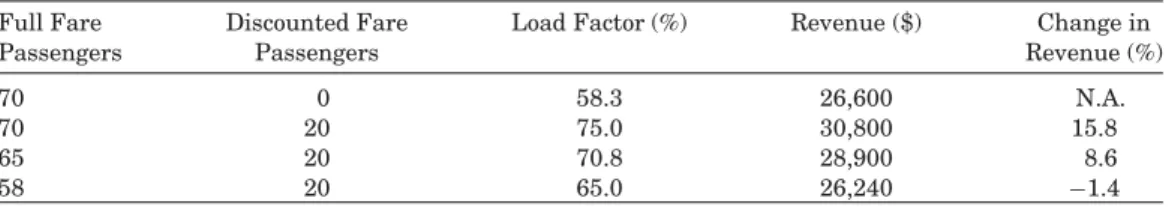
Suppose a flight has a seating capacity of 120, the full fare is $380 and the dis-counted fare is $210, a 45% discount from full fare. As shown in Table 2, if offering discounted fares leads to incremental pas-sengers without reducing the number of full fare passengers, the incremental revenues can be significant. If, in addition to sell-ing 70 full fare tickets, 20 discounted fares can be sold, the flight’s revenue increases by
more than 15%. But if some of these dis-counted fares are sold to those who would have purchased a full fare, the gains are quickly eroded. Even worse, revenue may decline.If 5 of the 20 discounted fare tickets are purchased by passengers who would have purchased a full fare ticket, the incremental revenue is only 8.6%. If the discounted fares are sold to 12 of these passengers, revenue actually declines by more than one percent, although the flight’s load factor, the percent-age of seats occupied, increases by more than 11%. Had the discounted fare been $125, a 67% reduction, revenue declines when only 5 of the 20 discounted fares are sold to those who would have purchased a full fare. As we shall discuss, this was soon to be a real sce-nario. Profit levels erode even faster when the variable costs of transporting and servicing passengers are included.
The potential value of optimally managing discount fare sales may be appreciated more easily by analyzing the potential impacts of ‘‘small mistakes.’’ In the example above, the incremental revenue drops by approximately 9% for each passenger that purchases a dis-counted fare rather than the full fare (i.e., a flight with 69 full fare passengers and 20 discounted fare passengers earns 9% less rev-enue than a flight with 70 full fare passengers and 20 discounted fare passengers). Taken from that perspective, the financial impact of one less full fare sale on a flight, let alone sev-eral, is sufficiently great as to merit careful management.
Now, consider those flights for which demand is sufficiently high to fill every seat. Further, suppose that none of the passengers willing to pay full fare purchases a discount fare. What is the financial impact of displacing a potential full fare passenger by a passenger purchasing a discounted fare? That is, how much less incremental revenue
Table 2. Potential Revenue Impacts of Offering Two Fares
Full Fare Discounted Fare Load Factor (%) Revenue ($) Change in
Passengers Passengers Revenue (%)
70 0 58.3 26,600 N.A.
70 20 75.0 30,800 15.8
65 20 70.8 28,900 8.6
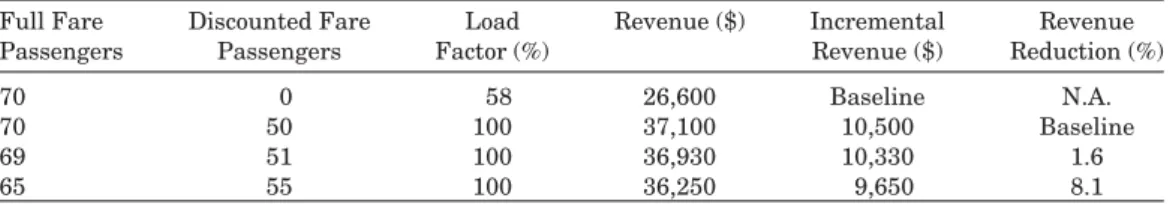
Table 3. Potential Revenue Impact of Displacing Full Fare Passengers
Full Fare Discounted Fare Load Revenue ($) Incremental Revenue Passengers Passengers Factor (%) Revenue ($) Reduction (%)
70 0 58 26,600 Baseline N.A.
70 50 100 37,100 10,500 Baseline
69 51 100 36,930 10,330 1.6
65 55 100 36,250 9,650 8.1
is earned if there are 69 full fare passengers and 51 discount fare passengers on the flight, rather than 70 full fare passengers and 50 discount fare passengers?
As shown in Table 3, the flight’s incremen-tal revenue decreases by approximately 1.6% for each full fare passenger that is displaced by a discount fare passenger. Perhaps, this does not seem like much. After all, is not 98.4% of perfect still pretty good? Is it really worth the effort to pursue an extra 1.6%? If this airline has 1000 flights per day and 15% of its flights sell out, this ‘‘allocation error’’ results in $9.3 million less revenue than the airline could have earned. Allocation errors of only several seats per flight on sold out flights lowers its annual revenues by tens of mil-lions of dollars. And while these numbers are only illustrative, they are sufficiently accu-rate to demonstaccu-rate that the financial differ-ence between optimally managing discount allocations and only managing them well is extraordinary. This is why travel companies have been willing to invest heavily in achiev-ing marginal improvements in their revenue management programs. It was a lesson that was quickly learned and acted upon by some, but not all, airlines in the early 1980s.
Although Super Savers provided the needed innovation in the pricing structure, a few more years and an impending financial crisis would be required before the airlines fully recognized and embraced the practice of offering multiple prices with a variety of pur-chase restrictions to obtain incremental sales and profits. Indeed, it was not just the pricing structure, but also the ability to expertly manage the discount allocations that was also needed; but this was not yet in place.
Fortunately, the work to do this had already begun. Although not aware of how important it would ultimately be, in 1972 the Operational Research Branch of British
Overseas Airways Corporation (BOAC) laid out the underlying theory and insights for using operations research techniques to set discount control allocations to maximize flight revenue when multiple fares are sold. The ideas were presented by Kenneth Little-wood, a member of the team, at a meeting of the Airline Group of the International Feder-ation of OperFeder-ations Research Societies (AGI-FORS). At the end of a paper that was written primarily to document BOAC’s efforts to implement mathematical and statistical methods to set overbooking levels to max-imize revenue, Littlewood also described a method for using demand forecasts and opti-mality conditions to set limits on the number of discounted fares that should be sold for a flight to maximize flight revenues. According to Littlewood, the ideas on discount allocation were ‘‘still in its infancy,’’ but the introduc-tion of new low fares by Skytrain for regular London–New York service highlighted the need to control the allocation of low yield fares [20,21]7. He could not have envisioned that this method, eventually termedLittlewood’s Rule, was to become the basis for discount allocation algorithms employed in revenue management systems at many airlines.
Littlewood’s key observation (somewhat simplified here) was that to maximize a flight’s revenue when two fares are offered (e.g., letYbe the full fare andDthe discount fare), the discounted fares should be sold so
7The paper was entitled ‘‘Forecasting and con-trol of passenger bookings’’ and was published in the AGIFORS 12th Annual Symposium Pro-ceedings, October 1972, pp. 95–117. Fortunately, this ground-breaking and quite readable paper has been reprinted and the reference listed at the end of this article is far easier to access.
long as
D≥P×Yor, equivalently, P≤D/Y where P is the probability that selling an additional discounted fare will result in one less full fare ticket sale.
This implies that discounted fares should be sold so long as the ratio between the discount fare and the full fare (D/Y) is at least as great as the likelihood that the overbooking limit will be reached if no more discounted fares are sold. Essentially, it is a comparison between the revenue received from a discounted ticket and the expected marginal revenue resulting from not selling the discounted fare in anticipation of selling a full fare in its place. It is interesting to observe that the decision as to whether or not to accept an additional reservation for a discount fare does not depend on the demand distribution for discount fares, but it does depend on the demand distribution for full fares.
In 1980, Bill Swan, a member of the American Airlines Operations Research Department, modified and extended Lit-tlewood’s methodology for implementation at American Airlines. Such a system was implemented in 1982 [4]. American was probably the first US airline to implement such an advanced method for determining discount allocations. This method was extended to multiple fare classes and has come to be known as the expected marginal seat revenue (EMSR) approach. The earliest published work on this method, including extensions and modifications of the approach can be found in Refs 22–25.
Discount allocation controls were designed to work within airline reservation system control structures. The mechanisms by which reservation systems controlled fare availabil-ity differed from that of many other indus-tries. Each fare would be mapped into one of perhaps five or eight fare classes for a flight, depending on the reservation system. Fare classes were designated by letter codes. For example, F, C, and Y were commonly used for first class, business class, and full coach fares, respectively. Discounted coach fare classes included letter codes M, B, V, H, and Q. When
a fare class was available, all fares that were mapped into it could be sold.8 When a fare class was closed, none of the fares mapped into that fare class could be sold. Typically, many fares were assigned to each fare class [4,22]. Over time, the number of fare classes has increased considerably. A flight may now have as many as 16 different fare classes.
Consequently, yield management assu-med an indirect responsibility for price setting. While others determined the actual fares thatcouldbe offered to the public, yield management controlled when and which fares were actually offered by determining when fare classes were open for sale and when they were closed. Fare classes opened and closed multiple times during the booking period reflecting bookings, cancellations, and revisions to discount allocation decisions based on changes in incremental demand forecasts.
As you might imagine, demand forecasts play a critical role in setting inventory allo-cations. Demand was forecast at the fare class level. Time series models, such as expo-nential smoothing and booking profiles that provided estimates of how many reserva-tions were typically received during various time periods prior to departure, were com-monly relied upon to forecast demand by fare class. Consequently, the forecasts of future or incremental demand were independent of potential yield management or pricing actions (except to the extent that analysts implemented manual overrides). Even with such simplifications, the forecast models per-formed well.
With a pricing structure in place that allowed airlines to target fares at multiple market segments and the ability to control the availability of these fares based on science rather than human intuition and judgment, the airline industry, or perhaps more specif-ically American Airlines, was prepared to
8In some cases, fare-specific restrictions prevented a fare from being sold when its fare class was available. For example, if a fare with a 21-day advance purchase restriction was one of the fares that was mapped into the V fare class, that fare could not be sold 18 days prior to the flight, even if the V fare class was still open.
demonstrate that revenue management could transform the competitive landscape in ways that no one had previously imagined. All that was needed was the catalyst for action.
That catalyst came in the form of People Express, a low-cost airline that had begun operations in 1981 by offering low-fare short-haul service between cities that had lim-ited air service. For $23, you could fly from Newark, New Jersey to Buffalo, New York; for $35 you could fly from Newark to Norfolk; these fares were 50–80% lower than those offered by other carriers. Over time, however, People Express expanded its route struc-ture and by 1984 was competing on the same routes that were flown by major car-riers such as American Airlines. Faced with such competition, the major carriers faced a dilemma: matching the fares offered by Peo-ple Express would enable them to keep their customer base but not allow them to cover their costs, whereas not matching the low fares would result in the loss of too many passengers [26].
American’s competitive response came in January 1985, in the form of its Ultimate Super Savers, restricted fares that were dis-counted as much as 70% so as to be compet-itive with those of People Express. The fares provided far greater discounts than Super Savers. Also, new restrictions such as limited refundability levels were included. Although discount allocation controls in the reservation system were now automated and benefit-ted from data feeds from decision support systems, American’s initial ability to opti-mally manage the discount allocation levels left much to be desired simply because its historical passenger demand data did not reflect the level of demand for the new fares. With each passing month, however, Amer-ican’s ability to maximize its revenues by controlling and managing the availability of these fares would improve. Other airlines would also ramp up their investments in methods and systems to better control dis-count fare availability. The stage was set for the introduction of a wide variety of dis-counted, restricted fares whose availability would seem to appear and disappear as if by magic and for no valid reason. With that, the
discipline known as yield management would soon enter the public lexicon.
The business community did not yet understand the potential benefits of the new pricing structure. As reported by Time, ‘‘To Wall Street, American’s move looked like an attempt to get out in front of the competition by jumping off a cliff. Many airlines are already losing money, and discount fares may mean bigger losses. Stock prices of all the large airlines that joined in last week’s fare war fell sharply’’ [27]. In fact, however, American enjoyed great financial success during the next few years; revenue management was only one of the reasons for this, but it was an important factor.
Although it had a more gradual impact on revenue management, the Airline Dereg-ulation Act of 1978 also transformed airline routes. Given much greater flexibility in determining their routes and schedules, major airlines developed the hub-and-spoke system in the 1980s. Major airlines reduced their frequency of nonstop service between small and mid-sized cities (sometimes drop-ping these routes), forcing more passengers to take connecting flights. For example, whereas about 10% of American’s passengers took connecting flights in 1980, by the mid-1980s about two-thirds of the passengers going into a hub airport were connecting to another flight [4]. By the late 1980s, airlines began to make fare allocation decisions that reflected passenger itineraries: this aspect of revenue management is known astraffic management.
For airlines that experienced significant increases in their volume of connecting passengers, the traffic management aspect of revenue management was significant. When most passengers fly point-to-point, airlines that attempt to maximize their revenues/profits by setting discount allo-cation levels on a flight-by-flight basis perform rather well. As connecting traffic increases, however, this practice becomes more problematic. Indeed, as we shall soon see, in some industries such network-related issues can dominate revenue management decisions. Traffic management, that is the practice of setting allocation levels (and not necessarily only discounted fare allocations)
that reflect the incremental value of a passenger’s revenue to the airline’s flight network, became increasingly important and eventually became incorporated into airline revenue management systems.
The importance of traffic management can be seen in the following example. Consider a person wanting to fly from Austin, Texas to London, England on a discounted fare of $329. As there is no nonstop service from Austin to London, this passenger might fly from Austin, Texas to Dallas/Forth Worth, and then from Dallas/Fort Worth to London. Suppose someone else wants to fly from Austin to Dallas/Fort Worth (DFW) on the same flight and is willing to pay the Austin to DFW full fare of $189. Further, suppose there is only one seat still available for sale on the flight from Austin to DFW. Which reservation should the airline accept if it wants to maximize its revenues?
Excluding variable costs and the likeli-hood of either passenger booking a different flight on the same airline, the answer is, it depends.9Specifically, if the flight from DFW to London becomes full and demand must be turned away, it is highly likely that the airline earns greater revenue by transport-ing the passenger flytransport-ing from Austin to DFW and turning down the passenger flying from Austin to London. If, however, the flight from DFW to London departs with empty seats, the airline is likely to earn greater revenues by transporting the passenger flying from Austin to London.
Compared to overbooking and discount allocations, traffic management is sig-nificantly more difficult to address and generates more modest incremental revenue (although certainly significant) than setting flight-independent discount allocation levels. Although the benefit of overbooking has declined in recent years as nonrefundable fares have become more prevalent, in the
9Such factors should, and are likely to, be consid-ered in an airline’s revenue management system although it was more likely than not for such fac-tors to be ignored or only marginally considered in the initial revenue management systems imple-mented by the airlines.
1980s and 1990s, approximately 40–50% of the potential benefits of revenue manage-ment could be attributed to overbooking, 30–40% to discount allocation, and 10–20% to traffic management.10 While 10% of a $500 million annual benefit is certainly significant, it made sense for many airlines to initially focus on overbooking and discount fare allocation, the more valuable areas, prior to traffic management. For other industries, however, this was not the case.
FROM YM TO RM: BEYOND THE AIRLINE INDUSTRY
As revenue management spread to the hotel industry and then elsewhere, its focus remained on inventory control. Prices continued to be set independently of revenue management. Marriott began investing in revenue management as early as 1985 [28] and other hotel companies soon followed. According to Sheraton’s Director of Market-ing Geoff Ballotti, Sheraton began imple-menting a hotel revenue management system offered by Control Data Corporation (CDC) in 1987, implementing the system at 28 of its hotels [5–7]. Hilton also implemented a rev-enue management system in the late 1980s.
Some hotel chains began to experiment with offering discount rates with restrictions such as advance purchase requirements, but for the most part, it would take several more years until hotels integrated advance purchase requirements and refundability restrictions into their pricing structures. Rather, discounted rates were targeted to specific dates (e.g., weekends, holidays) or groups (e.g., children, travel agents, senior citizens) or were unrestricted rates off the full rate. The discounted rates were tied to the full rate (known as the rack rate) by some pre-determined percentage or value. Conse-quently, the early hotel revenue management systems served a slightly different function than airline systems, as they were used to
10Personal communication with Barry Smith, for-mer Chief Science Officer for SABRE and also the author’s experience.
control which of several rate tiers should be offered, rather than controlling discount allo-cations. Each rate tier included a set of rates. The revenue management systems mea-sured demand pressure for each check-in date using four primary criteria: reservations on the books, time until check-in date, a fore-cast of incremental demand for that date, and a forecast of remaining rooms. As the magnitude of the demand pressure increased, these systems would recommend raising the rate tier offered. Consequently, many of the various rates offered by the hotel to the general public would increase, or decrease, simultaneously, by pre-determined amounts. Some discounted rates would not be included in a rate tier, so these rates would not be available when that rate tier was offered.
The initial application of revenue man-agement in the hotel industry suffered from missteps that concerned some hotel exec-utives sufficiently to delay their adoption of revenue management systems. Borrowing from the airline industry’s revenue manage-ment ‘‘playbook,’’ perhaps a little too much, some of the initial hotel revenue manage-ment systems incorporated a design simpli-fication that served the airlines well; they essentially ignored traffic management, the network aspect of revenue management.11 Revenue managing a flight independently of others is similar to revenue managing arrival dates at a hotel independently of other dates. Unfortunately, this simplification was apt to yield poor rate recommendations during peak periods for hotels with a high proportion of multiple night stays. When guest stays span multiple dates, managing dates inde-pendently is apt to lead to pricing mistakes.
As it turns out, compared to increasing rates on dates that ultimately sell out, hotels generally earn far greater revenues and prof-its by limiting the number of shorter stays so that they can accept a greater number of longer stays that span these nights. This is
11Nor were overbooking recommendations incorpo-rated into these systems, although this was more likely for business process reasons. Hotel execu-tives tend to be very cautious about systematically overbooking.
typically referred to as optimizing by length-of-stay(length-of-rent in the car rental indus-try). It is far more profitable to earn $149 per night for four nights than $229 for a one-night stay. Recommendations to close the lower rate tiers for a peak night to all guests, regardless of whether they wanted to stay for one, four or seven nights, could easily discour-age those guests who wanted to stay several nights or longer. Unfortunately, the early hotel revenue management systems were not designed to analyze demand patterns across dates and address this issue. Nor were many hotel reservation systems designed with the controls needed to implement such decisions. The systems were not designed to control room inventory in ways that would stimu-late or accept demand from guests wanting longer-stays, while simultaneously limiting the number of shorter-stays on peak nights.
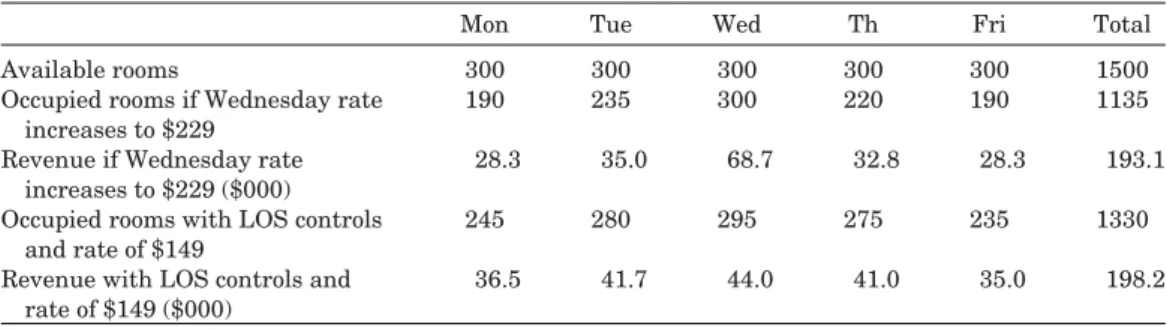
A simplified example illustrates this trade-off. Consider a hotel with a rate of $149/night, for which there is sufficient demand to sell-out on Wednesday night, even if the rate increases to $229/night. As shown in Table 4, increasing the rate from $149 to $229 on Wednesday, an increase of more than 50%, results in 1135 occupied rooms during the week and the weekly revenue exceeds $193,000. Further, every room is occupied on Wednesday night.
Conversely, if the hotel implements length of stay (LOS) controls so that more of the reservations it accepts that span Wednes-day night include the surrounding Wednes-days, and does not increase its average rate on Wednes-day, the number of rooms occupied during the week increases by 195. The weekly rev-enue for the hotel increases to $198,000, about a 2.6% revenue increase. In this sce-nario, not all of the hotel rooms are occupied on Wednesday night, reflecting the uncer-tainty associated with holding back rooms for longer stay reservation requests. In actual implementation of length of stay controls, some hotels have claimed revenue increases of 8–10% or even more when compared to increasing rates on peak nights [29]. Indeed, in the above example, if the Wednesday rate had only increased to $189, an increase of approximately 25%, the hotel would earn
Table 4. Comparison of Impacts from LOS Controls versus Increasing Price
Mon Tue Wed Th Fri Total
Available rooms 300 300 300 300 300 1500
Occupied rooms if Wednesday rate
increases to $229 190 235 300 220 190 1135
Revenue if Wednesday rate
increases to $229 ($000) 28.3 35.0 68.7 32.8 28.3 193.1 Occupied rooms with LOS controls
and rate of $149 245 280 295 275 235 1330
Revenue with LOS controls and
rate of $149 ($000) 36.5 41.7 44.0 41.0 35.0 198.2
9.4% more revenue by using length-of-stay controls rather than increasing its rate.
In practice, combining a rate increase for shorter stays while allowing longer guest stays to access lower rates is generally the most profitable pricing strategy for hotels during peak periods. The benefits of this strategy are recognized within the hotel industry. Hotel systems and practices have been redesigned to enable this strategy to be effectively implemented: no longer can guests make a reservation for a longer stay to obtain a lower rate and then cancel some of the days in the reservation or simply check-out early.
Aggressively increasing rate tiers on peak nights also had a negative unintended side effect. Able to provide hotels with high volumes of demand over the year, many corporations negotiated fixed rates with hotels that were significantly lower than the unrestricted rates. The corporate negotiated rates were not affected by the hotel’s pricing actions. Raising the hotel’s rates on peak nights might reduce hotel profitability as it could result in accepting more guests with lower corporate rates; because the rate increase slowed down the pace of bookings for publically available rates, it enabled corporations with the lower negotiated rates to access more rooms on peak nights, which was exactly the opposite of what the hotels wanted.
By 1990 these shortcomings were recognized and soon thereafter, addressed. Marriott’s first generation yield management system with length-of-stay optimization was implemented in 1991. Prior to this, Marriott’s yield management systems had gone through two generations. A test of the system at the Munich Marriott during a high demand
week helped the hotel obtain a 12.3% year-over-year revenue increase, despite an 11.7% reduction in average daily rate [5–7].
The adoption of yield management by the hotel industry in the late 1980s and early 1990s is well documented. Less information is available about the passenger railroad and cruise line initiatives at this time. Given permission to provide consulting and sys-tem development expertise to other firms, the American Airlines Operations Research Group began developing a yield management system for Amtrak in 1987 and a year later was doing the same for Royal Caribbean Cruises Ltd. (RCCL). Focused on enhanc-ing the inventory control capabilities of these firms, these systems did not provide any pric-ing recommendations.
Among the first areas to be addressed by the RCCL effort was improving the accuracy of pre-departure cancellation rate estimates for individual and group reservations [30]. At the time, cruise lines typically estimated can-cellation rates based on fixed projection rates that reflected how much money had been received by the cruise line and possibly one or two other factors. Known as a handicapping formula, the methods generally provided reasonable average estimates over the course of the year, but were subject to ‘‘catastrophic’’ breakdowns on individual sailings, leading to undesirable pricing actions. Over-forecasting cancellations could lead to selling cabins at highly discounted rates close to departure date. Under-forecasting cancellations could require upgrading passengers into much more expensive cabins, or even worse, fully or partially refunding their purchases while also moving them to other departures. Segmenting reservations based on a variety
of attributes (e.g., travel agency, itinerary, and type of group), and containing updating mechanisms to capture trend and seasonal-ity, the new method provided more accurate cancellation rate estimates [31]. Having more accurate estimates of the number of additional cabins that needed to be sold on a departure enabled RCCL to make more profitable pricing decisions for each cruise.
Other elements of the RCCL yield man-agement initiative included a group evalua-tor model and a variety of forward-looking reports directing analyst attention to those departures most in need of oversight and action. While the scope of RCCL’s initial yield management system might be consid-ered rather modest, it was a key factor in enabling RCCL to better manage and price its inventory, including implementing a vari-ety of pricing innovations. In 1992, Brian Rice, then RCCL’s director of revenue plan-ning and analysis, and now CFO, conser-vatively estimated the incremental revenue from these efforts at over $20 million/year, or about 2–3% of RCCL’s annual revenue [5–7]. Approximately two years after Amtrak had initiated its revenue management effort, SNCF, the French national railway, did the same [32,33]. By 1989, revenue management efforts were also initiated at Avis, a rental car company. By the early 1990s all of the major car rental firms had implemented rev-enue management systems or were preparing to do so. The ability to evaluate and con-trol reservations based on length-of-rent was included in all the first generation car rental revenue management systems. The revenue management system implemented at Hertz also included fleet planning and fleet deploy-ment capabilities enabling Hertz to better determine where and when it was financially advantageous to transfer cars between rental car locations due to projected supply and demand imbalances [34]. Doing so probably made Hertz the first company to integrate revenue management with operational deci-sionmaking.
Revenue management continued to spread to other segments of the travel industry, including tour operators, time-share exchange, theme parks, and even yacht rentals as well as industries other
than travel. Within a few years, additional revenue enhancement techniques were included in revenue management initiatives. Perhaps the most critical development was the inclusion of price optimization capabilities; no longer would revenue man-agement simply control the availability of previously set prices. Instead, revenue management efforts would include deter-mining the best price levels. In some cases, dynamically re-pricing a product to maximize profits based on current and forecast supply and demand extended the underlying mathematical models to include demand elasticity estimates: forecasts of how demand would change in response to offering alternative prices. Some (i.e., published) accounts of revenue management systems that incorporated dynamic pricing capabil-ities include National Car Rental [35], The Moorings [36], and Princess Cruises [37].
The revenue management initiative for Princess Cruises, begun in 1997, was imple-mented in 2000. While the system included typical inventory controls, it also included a pricing analytics engine providing insights on the extent to which promotional prices were needed to stimulate sales on a depar-ture. Of all the capabilities of the revenue management system, Princess staff believed this capability to be the most beneficial.12
Price optimization continues to be of great interest to many travel industry firms. Only a relatively few, however, have invested significant resources. At least for some of these firms, however, the returns have been extraordinary, easily eclipsing the 4% to 7% returns typically ascribed to the inventory allocation controls of revenue management. Anecdotally, price optimization capabilities appear to be capable of generating revenue increases of 10–15%.13
For many years, pricing has been treated as mostly art and very little science. For the most part, the science of pricing focused on
12Personal communication with Princess Cruises staff.
13These estimates reflect the author’s experience as well as personal communication with Barry Smith.
estimating the costs of production and build-ing in a reasonable profit margin. The prod-uct’s price was simply the result. While many firms continue to engage in that practice, it occurs less often as the principles of revenue management obtain a greater foothold. The systematic integration of supply and demand forecasting with product design and mar-ket segmentation concepts has proven suc-cessful, although there have certainly been instances of failure and setbacks along the way. As was the case when revenue man-agement was initially applied to the hotel industry, many of these failed efforts resulted when techniques that proved successful in one industry were used in another, without sufficient regard for the differences in the way business was conducted.
Over the past 20 years, the financial benefits of value-based pricing have become more widely accepted and communicated. The science of revenue management pro-vides a powerful mechanism that enables value-based pricing to succeed. Indeed, with restriction-free pricing becoming more and more prevalent in the airline industry, the traditional discount allocation controls of revenue management are now giving way to an increasingly strong focus on maximizing revenue via dynamic pricing to achieve pricing optimality.
At the heart of any dynamic pricing optimization system is forecasting demand at alternative prices and then estimating the prices that will maximize profit. From a practical perspective, forecasting demand at different prices can be both complex as well as data intensive, as demand is affected by a number of factors other than price. While many companies have attempted to incor-porate such variables into regression-based forecasts, such efforts often produce less than satisfactory results. Data sparsity and the inability to model many key relation-ships among the variables are some of the reasons that price–demand relationships are less robust or accurate than desired. Manual overrides and factors designed to prevent forecasts and recommendations from being too extreme are often integral to such systems. While some of these methods have proven useful, others have produced
sufficiently unreliable recommendations that firms stopped using the systems.
More recently, however, alternative mod-eling approaches such as disjunctive mapping are being developed to address these issues [38,39]. The widespread use of robotic pricing tools that capture competitor prices enables price-sensitive demand forecasts to explicitly reflect different competitive situations and support what-if analyses, as historical data has become available to estimate the likelihood of alternative competitor reactions. Indeed, one of the challenges of price-elasticity modeling is that in practice, demand curves may not be static; they depend on the directional shift of price and possibly other factors. For example, when price increases fromA toB, the magnitude of the change in demand level may not be equivalent to the magnitude of the change in demand when price decreases from Bto A. Such modeling and estimation complexities are more easily addressed when competitor prices are retained. Given the potential benefits of dynamic pricing, and the recent availability of data to support demand fore-cast modeling, we anticipate that dynamic pricing will be a strong focus of travel companies during the next decade or two.
CONCLUSION
Written for academics and experienced practitioners of revenue management as a ‘‘single-source reference for the major theory and application issues,’’ a comprehensive treatment of revenue management was published in 2004 by Kalyan Talluri and Garrett Van Ryzin. The book is intended for those who have advanced degrees in mathematically-oriented disciplines such as operations research, statistics, or eco-nomics, although portions of the book are accessible to those without such skills and are interested in obtaining a more detailed understanding of the theory underlying revenue management [40].
From a relatively obscure business prac-tice only 50 years ago, revenue manage-ment has come a long way. Dominated by practitioners until 1990 and perhaps longer,
the number of academic researchers may now surpass the number of practitioners. Indeed, the subject now boasts two dedicated journals: The Journal of Revenue and Pric-ing Management was initiated in 2002 and was joined by the International Journal of Revenue Management in 2007. In addition, articles on revenue management appear in a wide variety of journals and books.
Will the term revenue management be retained? Will it be replaced by pricing and revenue optimization or something else? What is your forecast?
Acknowledgments
I greatly appreciate the time given to me by both Kenneth Littlewood and Barry Smith to discuss some of the ideas in this article. They were able to provide me with key pieces of information that filled in gaps in the histor-ical record and allowed me to better under-stand the motivation behind industry devel-opments. As my mentor in revenue man-agement at American Airlines, I am deeply indebted to Barry for both, the time he has given to me and value the friendship we have developed. I also owe a large debt of grati-tude to Tom Cook, who headed the American Airlines Operations Research Department in 1984. Without his support and trust, I would never have had the opportunities in revenue management that have captivated me for more than 25 years.
REFERENCES
1. Orkin EB. Yield management. Hotel & Cater-ing Technology; 1988. (Reprinted by Hotel Information Systems Ltd., Heathrow, Houn-slow, England.)
2. Schrage M. New corporate pricing tool could be costly to consumers. California (CA): Los Angeles Times. 1991 Dec 5: D1.
3. Lieberman WH. Yield management: the pric-ing revolution that goes beyond the travel industry. Presentation at the 4th Annual US Pricing Conference, The Pricing Institute, a division of The Institute for International Research; 1991 April 10–12. New York: The Grand Hyatt Hotel; 1991. p. 3.
4. Smith BC, John L, Ross D., Yield Man-agement at American Airlines. Interfaces 1992;22(1):8–31.
5. Scorecard. Marriott’s Millions. Atlanta (GA): Aeronomics Incorporated; Premier Issue, Sec-ond Quarter. 1992a. pp. 3–6.
6. Scorecard. Royal Caribbean breaks through. Atlanta (GA): Aeronomics Incorporated; Third Quarter. 1992b. pp. 5, 11.
7. Scorecard. Sheraton’s technological evolu-tion. Atlanta (GA): Aeronomics Incorporated; Fourth Quarter. 1992c. pp. 3–5.
8. Cross RB. Revenue management: hard-core tactics for market domination. New York: Broadway Books; 1997. p. 276.
9. Uchitelle L. Airlines off course. New York: New York Times Magazine; 1991. p. 612. 10. Time. The law: a big bump for bumping.
1976. Available at http://www.time.com/time/ magazine/article/0,9171,918209,00.html. Accessed 1976 June 21.
11. Gowen MJ. Airline and cargo industry update. Murray Hill (NJ): DUNS Analytical Services, Dun & Bradstreet, Inc.; 1991. p. 33.
12. Business Travel News. Airlines. 1993. pp. 40, 42.
13. Lieberman WH. A revolution is brewing in pricing. Los Angeles: Los Angeles Times; 1990. (Looking Ahead), June 6, 1990.
14. Cross RG, Lieberman WH. Yield manage-ment. Futurescope, management and society. Cambridge (MA): Decision Resources Inc.; 1991. pp. IV–1–IV–4.
15. Rothstein M. OR and the airline overbooking problem. Oper Res 1985;33(2):237–248. 16. AMR Corporation. 1984 Annual Report. 1985.
p. 44.
17. Simon JL. An almost-practical solution to air-line overbooking. J Trans Econ Policy 1968;2 (2):201–202.
18. Simon JL. The airline oversales auction plan: the results. J Trans Econ Policy 1994;28(3): 319–323.
19. Sterling R. Eagle: The Story of American Air-lines. New York: St. Martin’s Press; 1985, p. 482.
20. Littlewood K. Forecasting and control of pas-senger bookings. J Revenue Pricing Manage 2005;4(2):111–123.
21. Littlewood K. Personal communications. 2010;
22. Belobaba P. Air travel demand and airline seat inventory management [Doctoral dis-sertation]. Flight Transportation Laboratory. Report R87-7. Cambridge (MA): MIT; 1987; p. 214.
23. Belobaba PP. Survey paper – airline yield management: an overview of seat inventory control. Trans Sci 1987b;21(2):63–73. 24. Belobaba PP. Application of a probabilistic
decision model to airline seat inventory con-trol. Oper Res 1989;37(2):183–197.
25. Curry RE. Optimal airline seat allocation with fare classes nesting by origins and destina-tions. Trans Sci 1990;24(2):193–204. 26. Phillips RL. Pricing and revenue optimization.
Stanford (CA): Stanford University Press; 2005. p. 355.
27. Time. Sky wars: airfares take a dive. 1985. Available at http://www.time.com/time/ magazine/article/0,9171,959288,00.html. Accessed 1985 Jan 28.
28. Hsu CH, Powers TF. Marketing hospitality. New York: John Wiley & Sons, Inc.; 2002. p. 360.
29. Aeronomics. A conversation with Don Burr. Fourth Quarter. Atlanta (GA): Scorecard; 1992. pp. 6–7.
30. Fisher J, Mongalo Marco. Integrating deci-sion support. SAS Users Groups Interna-tional Conference. New York; 1993. pp. 619–623.
31. Lieberman WH. Pricing tactics and strategies in the cruise industry. Handbook of pricing management. Oxford University Press; 2010. In press.
32. Daudel S, Georges V. Le yield management: la face encore cach´ee du marketing des services. InterEditions. Paris: 1989.
33. Mitev NN. The globalisation of transport? Computerised reservation systems at Amer-ican Airlines and French Railways. In: Lynch P, Trischler H, Lyth J,et al. editors. Wiring
Prometheus: globalization, history and tech-nology. Denmark: Aarhus University Press; 2004. pp. 193–216.
34. Carroll WJ, Grimes RC. Evolutionary change in product management: experiences in the car rental industry. Interfaces 1995;25(5): 84–104.
35. Geraghty MK, Johnson E. Revenue manage-ment saves national car rental. Interfaces 1997;27(1):107–127.
36. Bermudez R, Dieck T, Lieberman W. Revenue management basics in the charter boat indus-try. Revenue management and pricing: case studies and applications. London: Thomson; 2004. pp. 1–8, 184–188.
37. Scorecard. Making history. Mountain View (CA): Talus Solutions; 2000. pp. 5–8. 38. Raskin M, Lieberman W, Mullin J. Disjunctive
mapping: changing the way we understand and predict customer behavior (part one). J Revenue Pricing Manage 2010. In press. 39. Raskin M, Lieberman W, Mullin J.
Disjunc-tive mapping: changing the way we under-stand and predict customer behavior (part two). J Revenue Pricing Manage 2010b. In press.
40. Talluri KT, Van Ryzin GJ. The theory and practice of revenue management. Boston (MA): Kluwer Academic Publishers; 2004. p. 712.
41. Cowan AL, Gargan EA. Mirage of discount air fares is frustrating to many fliers. New York: New York Times; 1991. pp. A1, C3.
42. Simon J. Origins of the airline oversales auction system. Cato Rev Bus Gov. Avail-able at http://www.cato.org/pubs/regulation/ regv17n2/reg17n2-simon.html.