ISSN: 2252-8938, DOI: 10.11591/ijai.v8.i4.pp367-374 367
Predictive analytics of university student intake using
supervised methods
Muhammad Yunus Iqbal Basheer1, Sofianita Mutalib2, Nurzeatul Hamimah Abdul Hamid3,
Shuzlina Abdul-Rahman4, Ariff Md Ab Malik5
1,2,3,4Faculty of Computer and Mathematical Sciences, Universiti Teknologi MARA, Shah Alam, Selangor, Malaysia 2,3,4,5Research Initiative Group of Intelligent Systems, Universiti Teknologi MARA, Shah Alam, Selangor, Malaysia
5Faculty of Business and Management, Universiti Teknologi MARA, Puncak Alam, Selangor, Malaysia
Article Info ABSTRACT
Article history: Received Jul 12, 2019 Revised Sep 20, 2019 Accepted Oct 4, 2019
Predictive analytics extract important factors and patterns from historical data to predict future outcomes. This paper presents predictive analytics of university student intake using supervised methods. Every year, universities face a lot of academic offer rejection by the applicants. Hence, this research aims to predict student acceptance and rejection towards academic offer given by a university using supervised methods subject to past student intake data. To solve this problem, a lot of past studies had been reviewed starting from nineties era till now. From the analysis, two algorithms had been selected namely Decision Tree and k Nearest Neighbor. The dataset of past student intake was obtained with fifteen attributes, which are applicants’ gender, applicants studied stream during Sijil Peperiksaan Malaysia (SPM), university campuses, applicants’ hometown, disability, campus visit, course choice order in application form, applicant’s six SPM subjects result, orphan and status of acceptance. Several experiments were implemented to find the best model to predict the student’s offer acceptance by evaluating the model accuracy. Both models yield best accuracy at 66 percent with the selected attributes. This research gives a huge impact in selecting which applicants is suitable to be offered as well as adapting the university’s academic offering process in much intelligence way in the future.
Keywords: Higher education Predictive analytics Student intake Supervised University
Copyright © 2019 Institute of Advanced Engineering and Science. All rights reserved. Corresponding Author:
Sofianita Mutalib,
Faculty of Computer and Mathematical Sciences, Universiti Teknologi MARA,
40450 Shah Alam, Selangor, Malaysia. Email: [email protected]
1. INTRODUCTION
Nowadays, the streams of big data come from various sources and could produce in mass volume of data. These data are valuable for organizations to gain an advantage edge if it is use in a useful manner [1]. In the context of higher education institutions (HEI), current and potential students are the data sources which can be analysed to gain insights on many areas including the future of human resources. It is stated that every academic institute has various types of student data [2]. The target number of enrolment for Malaysian private HEIs is about 867,000 students and 764,000 students for public universities that could improve the education enrolment rates from 48% currently to 78% [3]. Applicants of university’s programs may have different backgrounds and have a lot of program choices that varies from public higher education institutions to private higher education institutions. Consequently, this condition has increased the competition among the HEIs to enroll more students. Day by day, each university is in a war to grab attention of potential students to choose their organization to further their studies. Despite the intake window challenges, in every intake session, universities have to make the best selection from huge number of applicants [4]. Based on this
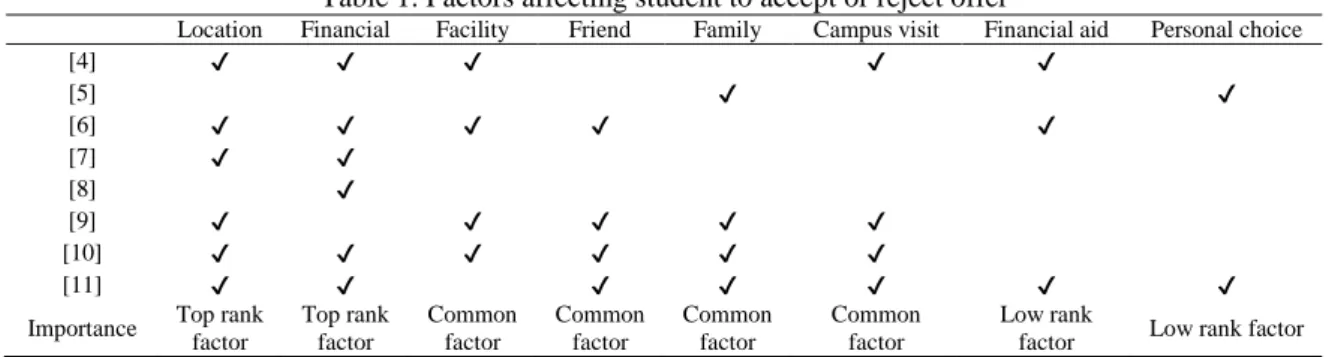
scenario, most of the universities are struggling to offer to any potential applicants and to ensure these applicants to choose their organization. Furthermore, universities may also face a lot of possible rejections from these applicants. Therefore, the findings raise a question, why do these applicants reject the offers. The rejection could be caused by certain reasons [4-8] and universities need to find a way to focus only to the applicants who will potentially accept their offer [7, 9-10]. This research contains three objectives; which are first to identify suitable attributes to predict an acceptance or rejection of a university’s offered programme. The second objective is to develop a prediction model of acceptance or rejection of the offered course. The final objective is to develop a dashboard to visualize the data related to acceptance or rejection prediction model. In identifying suitable attributes to predict an acceptance or rejection of the offered program, several articles had been analyzed from 1990s till recent years. There are eight factors influencing the university choice among the applicants, as shown in Table 1.
Table 1. Factors affecting student to accept or reject offer
Location Financial Facility Friend Family Campus visit Financial aid Personal choice
[4] ✔ ✔ ✔ ✔ ✔
[5] ✔ ✔
[6] ✔ ✔ ✔ ✔ ✔
[7] ✔ ✔
[8] ✔
[9] ✔ ✔ ✔ ✔ ✔
[10] ✔ ✔ ✔ ✔ ✔ ✔
[11] ✔ ✔ ✔ ✔ ✔ ✔ ✔
Importance Top rank factor
Top rank factor
Common factor
Common factor
Common factor
Common factor
Low rank
factor Low rank factor
Based on Table 1, the applicants’ location and financial are considered as the most affecting factors towards the offered university program. In [11] stated that the applicants prefer to choose the university that is near to their home, which is aligned with [4, 6, 7, 9-11]’s findings. This preference is to ensure that the applicants would to be closer to their family and friends. In financial issue, some applicants are from the category of poor family or lower income family [4, 6-8, 10-11]. As a result, they are hardly to pursue or continue their studies. Although financial aid, for example Perbadanan Pendidikan Tinggi Nasional, (PTPTN) and Pinjaman Pelajaran Majlis Amanah Raya (MARA) scholarship are offered by the government to help many unfortunate students to study at higher education level, yet these applicants need to enroll the studies first. Besides the mentioned factors, campus visit, facility availability in university [4, 6, 9-10], friend and family influences [5, 6, 9-11] may also affect the applicants’ choices. Campus visit, which is one of the approaches that have been conducted by many Malaysian universities in gaining more potential students through roadshow and meeting [4, 9-11]. Meanwhile facility availability is one of the elements of dream place of study; including academic fascilities such as computer or science lab and, also sports and recreational fascilities. Friend and family influences is also a significant factor with high possibility that the applicants may choose the same university as their friends and families. In addition, personel choice factor can also influence the applicant to choose their preferred course subject to their desired job [5, 11-13]. In Malaysia, the applicant can select their preferred courses in any public university via Unit Pengurusan University, (UPU) portal. Through this portal, the applicants will be allowed to rank their preferred courses from any university that they want to study the most. That is why, a study is needed to determine other influence factors that specifically in local perspective.
Every year, the applicants and enrolment numbers has directly established vast databases of universities. These databases would be able to provide analytics and insights why these successful applicants rejected their offers. Analytics would help in identifying the major attributes (factors) that may correlate to the rejection and this analytics process can be done through data mining model [1, 9-12]. Predictive analytics can be developed using supervised methods or unsupervised methods. The supervised methods gain advantage in learning the patterns through historical data; meanwhile unsupervised methods would be more appropriate when the prior knowledge of the domain is uncertain. Therefore, with the established databases and information of enrolled or rejected offer by the applicants, supervised methods can be further explored. Furthermore, the supervised methods can be evaluated by experienced staff and existing cases [14-15]. However, the university selection factors could be dissimilar with regards of locality [18, 19, 21-22]. The study on prediction of acceptance offer using machine learning (ML) algorithms or supervised methods are hardly found in Malaysia
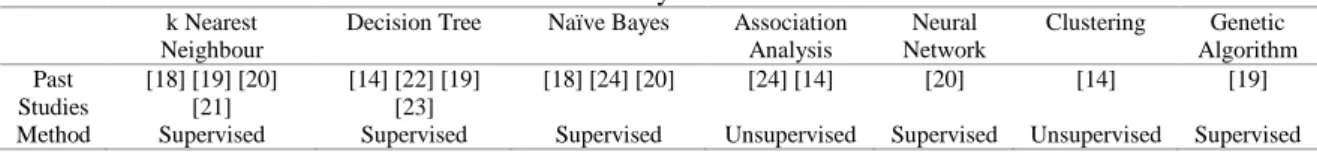
among best algorithms in the scope of higher education problem. Table 2 tabulates the models applied in previous studies, such as k Nearest Neighbour (kNN), Decision Tree (DT), Naïve Bayes (NB), Association analysis, Neural Network (NN), clustering and Genetic Algorithm (GA). Subject to the findings, DT and kNN are the most preferable and popular methods used by previous researchers. This may happen because of DT is easy to understand [14]. Moreover, it can also process the erroneous datasets [15]. Besides, Genetic Algorithm also usually uses for optimization [16], while Neural Network model is frequently used in heath care domain [17]. On the other hand, kNN is widely used to predict about something unknown by using similarity as the distance function to relate the variables to the class labels in the dataset. Our study elaborates the exploration of kNN and DT as the predictive models to classify the applicants by referring accepted and rejected offers.
Table 2. Model Used by Previous Researchers k Nearest
Neighbour
Decision Tree Naïve Bayes Association Analysis
Neural Network
Clustering Genetic Algorithm Past
Studies
[18] [19] [20] [21]
[14] [22] [19] [23]
[18] [24] [20] [24] [14] [20] [14] [19] Method Supervised Supervised Supervised Unsupervised Supervised Unsupervised Supervised
In [18] conducted a data mining approach to guide students through the enrollment process based on academic performance using kNN, DT (C4.5) and NB for student performance recommender system. kNN technique also can be used to predict student performance [19-21]. DT previously had been applied in finding and predicting student profiles (with clustering method) [14], student graduating grade [22], and student intake [23]. Next, in [24] used NB and association analysis to predict student enrolment. As DT and kNN are considered among the best models in producing high accuracy rate in prediction. This paper presents an exploration study for predictive analytics using supervised methods, kNN and DT for university student intake. Afterall, this research is presenting data analytics and it is very important for Information Technology (IT) business around the world [25]. Nevertheless, analytics is not being widely implemented in universities, especially Malaysia and the implementation is expected to increase efficiency in enrolment process and gain knowledge from historical data [26]. Hence, the analytics is believed can help the university to achieve its goal to be a primary choice of potential applicants that is believed to accept the offer.
2. RESEARCH METHODOLOGY
Overall, the methodoglogy of this research consists of three mainphases, which is data understanding and preprocessing, predictive model development and finally dashboard development. Figure 1 shows the overall research process from preprocessing, modeling and dashboard development. Data firstly was collected from respective department and the attributes were analyzed based on their importance as suggested in literatures. Data understanding and preprocessing of 2017 student intake dataset started by analyzing the importance of the attributes. The list of 16 selected attributes in this research is shown in Table 3, including the class label.
Table 3. Attributes Profile
No. Attributes Description Value 1 GENDER Gender of the applicants. L (Male), P (Female) 2 UPU CATEGORY Applicants stream during SPM. BA1 (sastera 2016), BA2 (sastera 2015),
BS1 (sains 2016), BS2 (sains 2015) 3 CAMPUS Campus Johor, Kedah, Kelantan, Melaka,
N Sembilan, Pahang, Perak, Perlis, Pulau Pinang, Sabah, Sarawak, Selangor, Terengganu, WP Kuala Lumpur, WP Labuan
WP Putrajaya 4 STATE ADDRESS Applicant address
5 DISTANCE Distance between applicants’ hometown and campus Near, Medium, Far, Very Far 6 CACAT Applicants disability 0,1,2
7 PROGRAM AKTIF Campus Visit 0,1 8 CHOICE ORDER Course selection order in UPU portal. 0 – 11 9 BM SPM Applicants’ SPM result for Malay Language subject A, B, C, D 10 BI SPM Applicants’ SPM result for English Language subject
A, B, C, D, E 11 MAT SPM Applicants’ SPM result for Mathematics Subject
12 MAT T SPM SPM result Additional Mathematics Subject
13 FIZ Applicants’ SPM result for Physics subject A, B, C, D, E, G 14 TEK Applicants’ SPM result for Information and
Communication Technology
A, B, C, D, G 15 ORPHAN Applicants’ parent availability 0, 1 16 STATUS (Class label) Offer Aceptance accept, reject
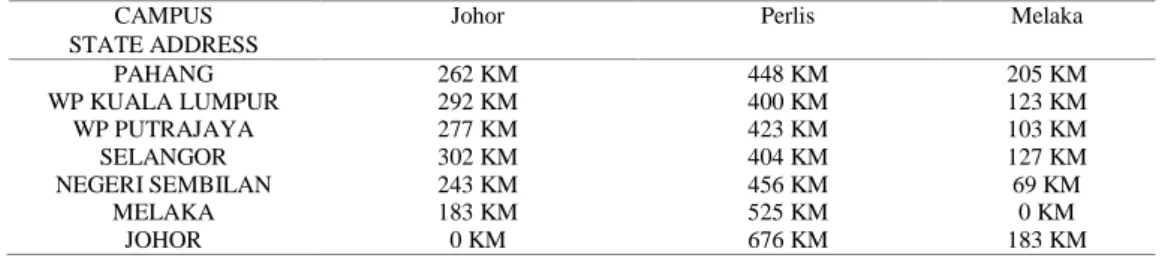
Data preprocessing is important to reduce the high dimensionality of attribute [27]. Microsoft Excel and Waikato Environment for Knowledge Analysis (WEKA) tools were used for the data preprocessing phase. Distance is an attribute constructed and estimated based on the state name in the address and the campus offered [14] which extracted from Google Map information. Table 4 shows some of distance values between state of the address and campus state. Next, the distance in kilometer (km) was classified within four ranges, which are ‘near’ for distance range [0-199], ‘medium’ for range [200-399], ‘far’ for range [400-699] and ‘very far’ for range [700-2000].
Table 4. Distance in Kilometer (KM) of STATE and NEGERI ALAMAT CAMPUS Johor Perlis Melaka STATE ADDRESS
PAHANG 262 KM 448 KM 205 KM WP KUALA LUMPUR 292 KM 400 KM 123 KM WP PUTRAJAYA 277 KM 423 KM 103 KM SELANGOR 302 KM 404 KM 127 KM NEGERI SEMBILAN 243 KM 456 KM 69 KM
MELAKA 183 KM 525 KM 0 KM JOHOR 0 KM 676 KM 183 KM
After data is transformed, the research enters the second phase; i.e. predictive model development by employing training and testing datasets with supervised algorithms. The predictive models are developed using a data mining tool, called Waikato Environment for Knowledge Analysis (WEKA) [29] and library called Machine Learning Library for Hypertext Preprocessor, and also a package for php (PHP-ML) was used. Two algorithms were employed which are J48 for DT and kNN. During training and testing, J48 is modelled using WEKA. J48 is an C4.5 algorithm used to generate a decision tree by using informatin gain (Info(D), InfoA(D)) and gain (A) as a statistical classifier [31], using (1), (2) and (3).
𝐼𝑛𝑓𝑜 (𝐷) = ∑𝑚𝑖=1𝑝𝑖𝑙𝑜𝑔2(𝑝𝑖) (1)
𝐼𝑛𝑓𝑜𝐴 (𝐷) = ∑ |𝐷𝑗|
|𝐷| × 𝐼𝑛𝑓𝑜(𝐷𝑗) 𝑉
𝑗=1 (2)
𝐺𝑎𝑖𝑛 (𝐴) = ∑𝑚𝑖=1𝐼𝑛𝑓𝑜(𝐷) − 𝐼𝑛𝑓𝑜𝐴(𝐷) (3)
While PHP-ML package is used for kNN with cross validation (stratified random split percentage along with number of neighbors) [31] and Euclidean distance of two objects; p and q, with i attributes as in (4). In kNN
with the object being assigned to the class most common among its k nearest neighbors, which k is a positive integer and typically small [32].
𝐸𝑢𝑐𝑙𝑖𝑑𝑒𝑎𝑛 𝑑𝑖𝑠𝑡𝑎𝑛𝑐𝑒 (𝑑) = √(𝑝1− 𝑞1)2+ (𝑝2− 𝑞2)2+ ⋯ + (𝑝𝑖− 𝑞𝑖)2 (4)
The experiment of modelling is further discussed in the result section in finding the best performance of each model build. The J48 result from WEKA is turned into if-else form in hypertext preprocessor (PHP). J48 and kNN were tested until the best accuracy is obtained. The models are then integrated in an interface or dashboard. This is where the research enters the last phase which is involved Web development and programming. The design of Web pages is coded using hypertext markup language (HTML) with Javascript which turning dataset into analytics graph and PHP is to run the prediction model. The dashboard gives two sets of output which is predicted result and analytics graph. At the same time, it also visualizes about descriptive analytics on training dataset. It means the access of analytics can be provided though it is depends on algorithms [28] and machine performances and the visualization provides much easier way to the user in making further decision about student intake in university.
3. RESULTS AND DISCUSSION
This section presents the result and dashboard development. In training and testing, the dataset is modelled and tune until the highest accuracy is obtained. Dashboard result is about visualization of the dashboard and how it delivers information to the end user.
3.1. Modeling using J48
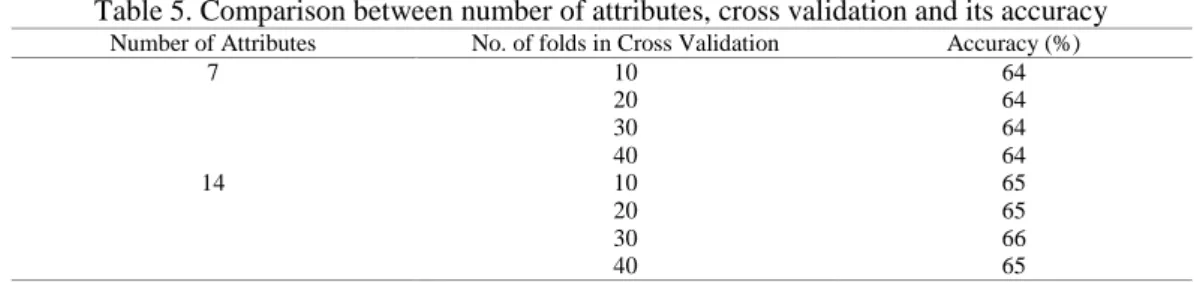
Total amount of data involved in this experiment is approximately 7000 instances. Two sets of attributes were used for the modeling, which are seven attributes and fourteen attributes. The seven attributes are Jantina, Kategori UPU, Distance, Cacat, Program Aktif UiTM, Choice Order and Status. While the fourteen attributes are Jantina, Kategori UPU, Distance, Cacat, Program Aktif UiTM, Choice Order, BM SPM, BI SPM, MAT SPM, MAT T SPM, FIZ, TEK, Orphan and Status. This two sets of attributes are then model sepperately to find which set of attributes produce the best model to be integrated with the system. Table 5 shows the comparison between number of attributes, cross validation and its accuracy for J48 model. Based on the result, fourteen attributes give better accuracy with 66% through cross validation at 30 folds, with 2380 as true positive and 2130 as true negative from a total of 7117 instances.
Table 5. Comparison between number of attributes, cross validation and its accuracy Number of Attributes No. of folds in Cross Validation Accuracy (%)
7 10 64
20 64
30 64
40 64
14 10 65
20 65
30 66
40 65
3.2. Modeling using kNN
kNN with Euclidean distance is tuned using ML hypertext preprocessor library (PHP-ML). The tuning process involved stratified random split and number of attributes is either seven or fourteen. At the same time, kNN has additional setting for number of neighbors and seed. The result for each setting is presented in Table 6. Based on Table 6, seven attributes give the best accuracy, 66 percent, with stratified random split by ten percent, seed set to 1000 and 500 neighbors. It is quite consistent with best J48 accuracy, but in the different number of attributes used by both to make prediction.
Table 6. Tuning process or comparison within Euclidean distance setting Number of Attributes Cross Validation (%) Neighbor Accuracy (%)
7 10 500 66 1000 63 20 500 63 1000 61 30 500 62 1000 60 40 500 62 1000 63 14 10 500 62 1000 61 20 500 61 1000 61 30 500 60 1000 60 40 500 59 1000 59
3.3. Comparison Between kNN and J48 Performance
Based on experiments done previously on both algorithms used which is namely J48 and kNN or Euclidean distance, it can be concluded that both algorithms give different values in term of performances to predict student acceptance and rejection of UiTM offer, as shown in Table 7. Table 7 shows the performance information that measure the ability of each algorithm participated in this research. The reason why J48 is chosen 14 attributes followed by kNN seven attributes is because of its accuracy. From Table 7, we can understand that J48 collect 66% of accuracy same as the kNN but with 14 and 7 number of attributes respectively. The different is the precision and sensitivity which J48 collect 64% of precision more than KNN which is 63%. But sensitivity for kNN is more than J48 which kNN collect 78% of accuracy followed by J48 which is 73% with difference of five percent. kNN used small number of attributes which help in the future if other seven attributes can not be found. But if other seven attributes are there for the prediction, it is recommended that used J48. This is because J48 performance in predicting student acceptance and rejection of the university offer higher than KNN.
Table 7. Comparison of Algorithms’ Performance J48 KNN
Cross Validation 30 folds 10% (stratified random split) Number of Attributes 14 7 14 7
Accuracy 66% 64% 62% 66% Precision 64% 63% 59% 63% Sensitivity 73% 72% 83% 78%
3.4. Dashboard Development
Dashboard represents interface as the interface plays an important role to connect between predictive engine and the user. It is where the communication between the end user and the model initiates. Firstly, the the charts are generated for descriptive analysis with single attribute, such distance. It is found that the applicants’ acceptance is mostly affected by the distance of the campuses and the hometown, and the second attribute is the stream during SPM. It is also found that majority of applicants that reject the offer were from science stream, compared to the art stream applicants. It could be an important information for decision maker to give offer more to arts stream applicants or otherwise. Descriptive analytics helps decision maker what is happening in specific year of student intake, and also who to give offer in the future. The same goes to predictive analytics which will assist decision maker to know which applicants will accept or reject university programme offer through set of selected attributes. The prediction output of the model is then to be visualized in the charts, as shown in Figure 2. The bar graph for example may explain about how many students are accepting university programme offer. Besides that, it also explains how many male and female students are predicted to be accepting the university programme. Predicitve analytics visualization will help decision maker to see the patterns clearer for more efficient decision in giving university offer. As a result, number of rejected university programme offer may reduce and causing university to gain offer acceptance more then offer rejection by applicants.
Figure 2. Predictive Analytics Visualization
4. CONCLUSION
This paper presents the predictive analytics inisiative of university student intake using supervised methods. The problem of university student intake triggers three different objectives. These three objectives explained before had been achieved in the end of this research and ready to launch in real world for student intake purpose. To achieve first objective, articles and reports had been reviewed thoroughly to identify suitable attributes in determining students accept or reject academic offer by the university. It is found that the applied fourteen attributes are the best to be developed as a prediction model of acceptance or rejection of the offered course. For the second objective, it is found that Decision Tree J48 and Euclidean distance in k Nearest Neighbor or kNN models are the best algorithms for this research. Once the algorithms had been selected, the algorithm testing was done for the highest prediction ability with two set of attributes, seven and fourteen. The prediction accuracy of J48 is 66% with fourteen attributes used, while kNN is also gained 66% with only seven attributes. It shows that both algorithms produced similar accuracy, though kNN consider smaller number of attributes. The dashboard was built to display all the information generated from the model of J48 and kNN in an understandable way to the end user. The Web based interfaces can be upgraded more in context user friendly interface. It enables them to communicate with the model in much easier way. These models can increase the capability of decision makers to offer to the potential applicants in the most efficient way. It is able for the management to give offer only to the applicants that is predicted by this system that will accept the offer. This research also provides the analysis of each data provided by the management as it could help the decision makers to analyze the possibility of program acceptance distribution of each campuses. In the future, more algorithms can be used to test on different intake datasets subject to multiple academic programs.
ACKNOWLEDGEMENTS
The authors would like to thank Research Management Centre (RMC) and Center of Strategic Planning and Information (CSPI) of Universiti Teknologi MARA in supporting the research.
REFERENCES
[1] S. L. Valle, E. Lesser, R. Shockley, M.S.. Hopkins and N. Kruschwitz, “Big Data, Analytics and the Path from Insights to Value,” Winter 2011 MIT Sloan Management Review, vol. 52, no. 2, pp. 21-31, 2011.
[2] A.K. Tiwari, G. Ramakrishna, L.K Sharma and S.K. Kashyap “Academic performance prediction algorithm based on fuzzy,” IAES International Journal of Artificial Intelligence (IJ-AI), vol. 8, no. 1, pp. 26-32, 2019.
[3] Ministry of Education Malaysia, “Executive Summary Malaysia Education Blueprint 2015-2025”, 2013.
[4] J. S. K. Ming, “Institutional Factors Influencing Students’ College Choice Decision in Malaysia: A Conceptual Framework,” International Journal of Business and Social Science, vol. 1, no. 3, pp. 53-58, 2010.
[5] K. Khoo, T.K. Ban, C.Y. Neng, B.K. Hooi and C.Y. Joan, “Student choices of choosing colleges and course of study in Penang,” Abc Research Alert, vol. 3, no. 1, pp. 1-7, 2015.
[6] S. Md. Sidin, S.R. Hussin and T.H. Soon, “An Exploratory Study of Factors Influencing the College Choice Decision of Undergraduate Students in Malaysia,” Asia Pacific Management Review, vol. 8, no 3, pp. 259-280, 2003.
[7] R. E. Kallio, “Factors Influencing The College Choice Decisions Of Graduate Students,” Research in Higher Education, vol. 36, no. 1, pp. 109-110, 1995.
[8] F. Angulo-Ruiz, A. Pergelova and R. Josep, “A Market Segment Approach for Higher Education Based On Rational and Emotional Factors,” Journal of Marketing for Higher Education, vol. 20, no. 1, pp. 1-17, 2010.
[9] J.B. Ford, M. Joseph and B Joseph, “Importance-Performance Analysis As A Strategic Tool For Service Marketers: The Case Of Service Quality Perceptions Of Business Students In New Zealand And The USA,” The Journal Of Services Marketing, vol. 13, no. 2, pp. 171-186, 1999.
[10] B. J. Mathew Joseph, “Indonesian students' perceptions of choice criteria in the selection of a tertiary institution: strategic implications,” International Journal of Educational Management, vol. 14, no 1, pp. 40-44, 2000.
[11] J. B. Don Hossler, “Understanding Student College Choice,” Higher Education: Handbook of Theory and Research, vol. 5, pp. 231-288, 1989.
[12] S. Bhardwa, “Why do students go to university and how do they choose which one?,” Times Higher Education (THE), pp. 1-17, 2017.
[13] J. M. Beggs, J.H. Bantham and S Taylor, “Distinguishing The Factors Influencing College Students' Choice Of Major,” College Student Journal, vol. 42, no. 2, pp.381-394, 2008.
[14] D.L. Red Martinez and C.E.P. Gomez, “Data Mining To Find Profiles Of Students,” European Scientific Journal, vol. 10, no. 30, pp. 23-43, 2014.
[15] N. B. Girja Sharma, R. Bhargava and M. Mathuria, “Decision Tree Analysis on J48 Algorithm for Data Mining,” International Journal of Advanced Research in Computer Science and Software Engineering, vol. 3, no6, pp. 1114-1119, 2013.
[16] S. Mafoud and G. Mani, “Financial Forecasting Using Genetic Algorithms,” Applied Artificial Intelligence, vol. 10, no. 6, pp. 543-566, 1996.
[17] H. Karim, S.R. Niakan and R. Safdari, “Comparison of Neural Network Training Algorithms for,” IAES International Journal of Artificial Intelligence (IJ-AI), vol. 7, no 4, pp. 185-189, 2018.
[18] C. Vialardi, J. Chue, J.P. Peche, G. Alvarado, B. Vinatea, J. Estrella and Á. Ortigosa, “A data mining approach to guide students through the enrollment process based on academic performance,” Springer Science Business Media B.V, vol. 21, pp. 217-218, 2011.
[19] B. Minaei-Bidgoli, D. A. Kashy, G. Kortemeyer and W. F. Punch, “Predicting Student Performance: An Application of Data Mining Methods with an Educational Web-Based System”, 33rd Annual Frontiers in Education, 2003. FIE 2003. 2003.
[20] A.M. Shahiri, W. Husaina and N.A. Rashid, “A Review on Predicting Student’s Performance using Data Mining Techniques,” Procedia Computer Science, vol. 72, pp. 414-422, 2015.
[21] S Alfere and A.Y. A. Maghari, “Prediction of Student's Performance Using Modified KNN Classifiers,” 1st International Conference on Engineering & Future Technology (ICEFT 2018), pp. 143-150, 2018.
[22] A. O. Ogunde and D. A. Ajibade, “A Data Mining System for Predicting University Students' Graduation Grades Using ID3 Decision Tree Algorithm,” Journal of Computer Science and Information Technology, vol. 2, no. 1, pp. 21-46, 2014.
[23] M. R. A. Razman. Predictive Analytics of University Student Intake Using Data Mining, Universiti Teknologi MARA, 2018.
[24] H. Sabnani, M. More, P. Kudale, P. S. Janrao, T. E. College and N. Mumbai, “Prediction of Student Enrolment Using Data Mining Techniques”, International Research Journal of Engineering and Technology, vol 5(4), pp. 4–7., 2018. [25] B. Manoj, K.V.K. Sasikanth, M.V. Subbarao and V.J. Prakash, "Analysis of Data Science with the use of Big Data,"
International Journal of Advanced Trends in Computer Science and Engineering, vol. 7, no. 6, pp. 87-90, 2018. [26] M. A. Al-Hagery, "Extracting Hidden Patterns from Dates' Product Data Using a Machine," IAES International
Journal of Artificial Intelligence (IJ-AI), vol. 8, no. 3, pp. 31-41, 2019.
[27] S. Abdul-Rahman, S. Mutalib and N. A. Khanafi; A. Mohd Ali "Exploring Feature Selection and Support Vector," 2013IEEE 16th International Conference on Computational Science and Engineering, 2013.
[28] A.E. Karrar and M.F.I. Fadl, "Security Protocol for Data Transmission in Cloud Computing," International Journal of Advanced Trends in Computer Science and Engineering, vol. 7, no. 1, pp. 1-5, 2018.
[29] E. Frank, M. A. Hall and I. A. Witten, “The WEKA Workbench. Online Appendix for "Data Mining: Practical Machine Learning Tools and Techniques", Morgan Kaufmann, Fourth Edition, 2016.
[30] A. Kondas. “PHP-ML-Machine Learning library for PHP”. Retrieved from https://php-ml.readthedocs.io/en/latest/, July 2019.
[31] J. Han and M. Kamber, “Data Mining: Concepts and Techniques,” Morgan Kauffman, Third Edition, 2006. [32] N. S. Altman, "An Introduction to Kernel and Nearest-Neighbor Nonparametric Regression". The American