Research Note
Performance Evaluation of a Hierarchical
Rate Allocation Algorithm in the
Presence of Background VBR Trac
P. Goudarzi
and F. Sheikholeslam
1The proportional fairness criterion, which was rst proposed by F.P. Kelly and his colleagues, has a number of properties in allocating user rates. For example, it resembles the AIMD in the TCP-Vegas [1] in rate allocation to users and there exists a well-established stability analysis in Kelly's work relating to the stability of the rate allocation algorithm. Another outstanding feature is that Kelly et al. try to solve the optimization problem of maximizing the aggregate utility of users in a distributed manner, by decomposing the overall system problem into two subproblems. These subproblems can be solved by the network and individual users by introducing a pricing scheme [2]. In the current work, a new high-speed second-order rate allocation algorithm has been proposed, which is based on the Jacobi method. The performance of the algorithm, under user arrival and departure and background variable bit-rate trac, is evaluated, in comparison with the conventional Kelly's algorithm. Simulation results show that the proposed method outperforms that of Kelly in convergence speed. For short-time users, the proposed algorithm assigns more rates than that of Kelly.
INTRODUCTION
Congestion control is accomplished by data networks in two dierent methods. These methods are rate-based and window-rate-based methods. In window-rate-based methods, the number of outstanding packets in the network is regulated by adjusting the size of a so-called congestion window to some reference value [3]. In rate-based methods, the network and user trac are considered as uid ows and some rates are allocated to users, based on some algorithms, such as the Kelly method [4], in order to achieve some fairness criteria in rate allocation. There are plenty of fairness criteria, such as max-min, proportional and minimum potential delay fairness in [5]. Selecting a fairness criterion depends on the network's designer strategy. For example, in the max-min criterion, the attention is strictly on users with lowest rates, whereas, in the proportional criterion, the objective is maximizing the
*. Corresponding Author, IT Faculty, Multimedia Research Group, Iran Telecom. Research Center, P.O. Box 1439955471, Tehran, I.R. Iran.
1. Department of Electrical Engineering, Isfahan University of Technology, Isfahan, I.R. Iran.
overall throughput, less attention is paid to lower rate users and users who use long routes in the network are more penalized. In the minimum potential delay criterion, L. Massoulie et al. dene a delay measure in terms of user throughput and try to minimize that delay [5].
In this paper, it is assumed that the network trac can adapt itself to network conditions. In other words, the term `elastic' is used for the trac, which was introduced by S. Shenker in [6]. As well-known examples of such a trac type, one can mention TCP trac on the current Internet and ABR trac in ATM networks.
For increasing the convergence speed of Kelly's rst order algorithm, one can use the benets of the well-known second-order algorithms, such as Jacobi or Newton [7].
On the other hand, the impression of using a hierarchical model for reducing the communication overhead in rate allocation is thoroughly discussed in [8] and references therein. So, in the current work, a second-order hierarchical model is built up to increase convergence speed and reduce communication overhead simultaneously.
following section, some related works are reviewed, spe-cially the work of F.P. Kelly, in designing a distributed optimal rate allocation model. Then, the developed high-speed method is more closely described. After that, simulation results are presented and, nally, the paper oers conclusion.
BACKGROUND
Consider a network with a set,J, of resources or links
and a set, R, of users and let c
j denote the nite
capacity of link j 2 J. Each user, r, has a xed
route,R
r, which is a nonempty subset of
J. When the
allocated rate to the user,r, isx r, user
rreceives utility U
r( x
r). The utility, U
r( x
r), is an increasing, strictly
concave and continuously dierentiable function of x r
over the range, x r
0. Furthermore, assume that
the utilities are additive, so that the aggregate utility of rate allocation = (x
r
;r 2 R) is: r2R
U r(
x r).
This is a reasonable assumption, since these utilities are those of independent network users. Assume that user utilities are logarithmic. Kelly's formulation for the proportionally fair rate allocation is [4]:
x r[ n+1]= 8 < : x r[ n]+k
r : 0 @ ! r x r[ n]:
X j2R r j[ n] 1 A 9 = ; + ; (1) where: j[
n] =p j
0 @
X s:j2R s x s[ n] 1 A
; fxg+,max(0;x):
(2) Parameter k
r controls the speed of convergence in
Equation 1. p j(
y) is the amount with which link j
penalizes its aggregate trac,y. It is a non-negative,
continuous increasing function and tends to innity as aggregate rate,y, tends to link capacity c
j. Given
r,
user,r, selects an amount that it is willing to pay per
unit time,!
r, and receives a rate, x r= ! r = r.
One of the interpretations is that, by using Equation 1, the system tries to equalize !
r with x
r[ n]:
P j2Rr
j[
n] by adjusting the x r[
n] value.
Sys-tems 1 and 2 show that the unique equilibrium,x r, is
the solution of the following equation:
! r= x r : X j2Rr p j( X s:j2Rs
x s)
; r2R: (3)
HIGH-SPEEDALGORITHM
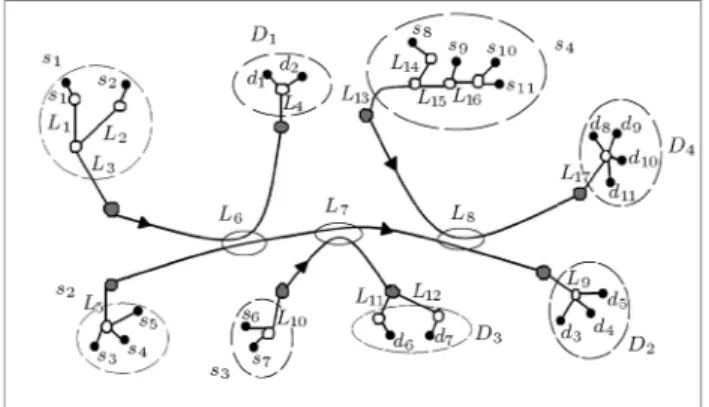
The high-speed algorithm is composed of a two-level hierarchical structure [8]. First, consider Figure 1. Let one assume that the network consists of 11 elastic sources. These sources are partitioned in four dierent groups. The aggregate trac associated with members
Figure1. A network with two levels of hierarchy.
of a group traverses some common links in the network. Such a group of users, with the same aggregate trac path through the network, is called a virtual user [8]. In Figure 1, dotted lines show the boundaries of the virtual users and thick lines show the trajectory of each virtual user's trac that is traversing through the common links (these links are denoted by letters L6, L7 and L8). Each source (destination) of information
is denoted by s (d) and, as mentioned before, the
rate associated with each (source, destination) pair is denoted byx. Links are unidirectional.
As Kelly has shown in [4], optimal rates of users are: x r= ! r = r
; r2R;
where: r = X j2R r p j 0 @ X u:j2R u x u 1 A :
Since it is assumed that congestion may only occur in the common links, it may be assumed that
r is only
aected by common links and is approximated by:
r = X j2Rr
&j2Common-links p
j 0 @
X u:j2Ru
x u 1 A : (4)
For example, for userss1ands2in Figure 1, one would
have:
x
1= !1
1; x
2=!2
2: (5)
Dene:
1,p6
X u:L62Ru
x u ! ; where
1is the aggregate penalty of userss1ands2(
1
and
at the equilibrium point, the aggregate rate of virtual user 1 is:
x
1+x
2= !1 1 + !2 2
=!1+!2
1 : (6)
In other words, virtual user 1 might be regarded as a user with logarithmic utility function (1log(1)), in
which:
1=!1+!2:
If one denotes the aggregate rate of virtual user 1 with
1, at the equilibrium point, one has:
1= !1+!2
1 : (7)
By considering Equations 5 and 7 and the assumption that
1=
1, one has:
x
1= !1
1:
1: (8)
Now, in mathematical terms [8], let S , fS i
ji =
1;2;;Qg and D , fD i
ji = 1;2;;Qg be the
sets that represent the virtual sources and virtual destinations, whereQrepresents the number of virtual
sources (destinations). For example, in Figure 1, one hasQ= 4 andS3=fs6;s7g,D3=fd6;d7g.
If the rate associated with virtual user i at
iterationnis denoted by i[
n] and the rate of end users
(as mentioned before) is denoted by a small letter x,
the algorithm behaves in the following manner. At the beginning, the algorithm works at the rst level of hierarchy and allocates rates to the virtual sources using some high-speed algorithm (such as the Jacobi method). Then, each virtual user assigns some proportions of its rate to each end-user within the virtual user. Afterwards, by dening a temporary variable, w, each user updates its corresponding w
parameter and when these new parameters are sent back to the virtual users, the rst-level algorithm repeats its computations.
If the assumption in Equation 4 is true, when the system is in the vicinity of the point of equilibrium, users' rates are close to the optimal ones. It has been shown in [9] that, by repeating this procedure, the rates will converge to the optimal ones. It must be emphasized here that the w parameters, which are
updated in the algorithm by end-users, are not an interpretation of users' willingness to pay (in contrast with what is discussed in [4] about !) and are merely
temporary variables. The rate assignment by virtual useri to a user, u, located within virtual user i is, as
follows:
x u[
n+ 1] = i[
n]: w u[ n] W i[ n]
; n= 0;1;2;;
i= 1;2;;Q; u2i; (9)
where notation u 2 i means that user u is located
within virtual useriand: W
i[ n],
X u2i
w u[
n]: (10)
Updating i[
n] in Equation 9 is as the Jacobi
itera-tion [7] (i= 1;2;;Q):
i[ n+ 1]
=
(
i[ n] +K
i : W i[ n] i[
n]: i[
n]
i[ n] +
i[ n]:
@ @i(t)
i( t)j
t=n )+
;
(11) where
i[0] = "
= 0,8iand, also,
i[ n],
X j2RS i
&j2Common-links p
j 0 @
X u:j2Ru
u[ n] 1 A :
Each w parameter is updated in a time scale which
is much larger than that of x's, using the following
relation:
w u[
n+ 1] = 8 > < > : w u[ n]+ u : !u u [n] w u [n] i [n] !u u [n] +
forn= 0;N;2N; w
u[
n] otherwise
i= 1;2;;Q; u2i; (12)
wherew u[0] =
w
u(the user-logarithmic utility function
parameter),u2i,i= 1;2;;QandN is some large
positive integer.
u is some positive constant (0 <
u <
u,
8i;u2i) that controls the convergence speed
in Equation 12 and u
>0 is an upper bound for u[9].
Equation 11 is, in fact, a form of the projected Jacobi method, as Bertsekas et al. have dened in [7]. The idea behind Equation 12 is that users should try to adjust their nal rates, which are assigned to them by a rst level algorithm, i.e. (w
u[ n]=
i[
n]) to the Kelly's
rate, i.e. (! u
= u[
n]), by changing their w parameters.
At the equilibrium point of the iteration (Relation 12), one has: w u= ! u u : i
; 8i; 8u2i: (13)
Also, at equilibrium, from Equations 9 and 11, one has:
x u = i : w u W i ; W i = i : i
; 8i; 8u2i: (14)
From Equations 13 and 14, it can be concluded that
x u : u = ! u,
8u, i.e. eventually, the user rates reach
The stability property of this algorithm is discussed, in detail, in [9].
As discussed in [8], one of the main advantages of the proposed hierarchical method is in reducing the number of communication overheads between the network elements.
But, as a rule of thumb, if one wants to compare the complexity of the proposed method with that of Kelly, it has been shown in the sequel that the two algorithms benet, approximately, from the same order of complexity. As known, the proposed method uses the Jacobi method in the rst level of hierarchy. It can be inferred from Equation 11 that this method needs approximately twice as many computations as in the Gradient descent method in Kelly's algorithm in Equation 1. But, if one even assumes in an extreme case, that each virtual user consists of two end-users, the total number of required computations is one-half that of Kelly at this level of hierarchy. Also, if one assumes that `N' is large, the computation in
Equation 12 does not impose any important burden on the order of computations. So, the complexity of the two methods is approximately of the same order. It must be mentioned that, if the number of existing users in each virtual user increases, the required number of computations can be reduced even more eectively.
SIMULATION RESULTS
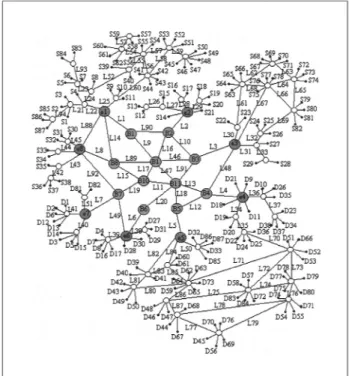
Consider the network topology of Figure 2, which is composed of 87 elastic users and 94 links. Gray nodes
Figure2. Simulated network topology.
are the network's backbone boundary. Simulation results are composed of two parts.
Part One
In part one, one assumes that odd-numbered users (for example, user 1;3;5;) arrive in the system with a
Poisson distribution and their existences persist with an exponential distribution and it is assumed that even-numbered users persist all over the simulation time. In this part, it is assumed that links 11, 15, 17, 47, 48, 49 and 91 are bottlenecks and their capacities are listed in Table 1. Other link capacities are selected much larger than the bottleneck links, such that they cannot impose any important eect on the rate assignment algorithm. In Kelly's method, k
r = 0
:00005, r 2 <
have been selected and, in the proposed method,K i=
0:00005,i = 1;2;;Qhave been selected. Q = 22, N = 1000 and
i = 0
:6 have been selected for each i in Equation 12. As mentioned before, the users'
utility functions are logarithmic and their!parameters
are given in Table 2. Link penalty functions in the Kelly method and the proposed method are selected, according to Relations 15 and 16, respectively, with
"1 = 10 2 and "2 = 10 8, which are selected small
enough to approximate an exact penalty function.
p j(
y) = (y c j+
"1)
+
="21; j2J; (15) p
j(
y) ="2: tan(:y=(2c j))
; j2J: (16)
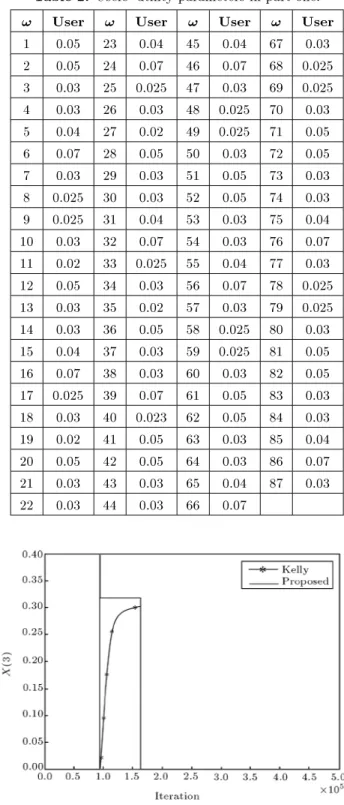
In Figures 3 to 6, the rates allocated to two temporary users and two permanent users are compared. As can be veried, the rate allocated to short-time users in the proposed algorithm is larger than that of Kelly, but, instead, as simulations show, the rate allocated to permanent users may sometimes be less in the proposed method. It can be concluded that, in most real-time regimes, unless some short-time greedy and bandwidth consuming application, such as video, is present, the proposed method is more suitable than that of Kelly. The decline in the rate of permanent users is the direct consequence of rising in the rate of the more bandwidth consuming temporary users, which reside in the same virtual user as the permanent ones.
Table 1. Bottleneck link capacities in part one. Capacity
Bottleneck Link
Capacity
Bottleneck Link
5 11 10 15
7 17 5 47
3 48 8 49
Table 2. Users' utility parameters in part one.
! User ! User ! User ! User
1 0.05 23 0.04 45 0.04 67 0.03 2 0.05 24 0.07 46 0.07 68 0.025 3 0.03 25 0.025 47 0.03 69 0.025 4 0.03 26 0.03 48 0.025 70 0.03 5 0.04 27 0.02 49 0.025 71 0.05 6 0.07 28 0.05 50 0.03 72 0.05 7 0.03 29 0.03 51 0.05 73 0.03 8 0.025 30 0.03 52 0.05 74 0.03 9 0.025 31 0.04 53 0.03 75 0.04 10 0.03 32 0.07 54 0.03 76 0.07 11 0.02 33 0.025 55 0.04 77 0.03 12 0.05 34 0.03 56 0.07 78 0.025 13 0.03 35 0.02 57 0.03 79 0.025 14 0.03 36 0.05 58 0.025 80 0.03 15 0.04 37 0.03 59 0.025 81 0.05 16 0.07 38 0.03 60 0.03 82 0.05 17 0.025 39 0.07 61 0.05 83 0.03 18 0.03 40 0.023 62 0.05 84 0.03 19 0.02 41 0.05 63 0.03 85 0.04 20 0.05 42 0.05 64 0.03 86 0.07 21 0.03 43 0.03 65 0.04 87 0.03 22 0.03 44 0.03 66 0.07
Figure3. Temporary user 3. Part Two
In part two, a similar approach to that of Walrand [3] and Basar [10] has been adopted for simulating the rates allocated to users with dierent propagation delays. The OPNET discrete-event simulator has been used. It is assumed that those users whose numbers are multiples of 5 (such as 5;10;15;) act as background
variable bit rate trac for other users. The bottleneck
Figure 4. Temporary user 11.
Figure 5. Permanent user 12.
Figure 6. Permanent user 24.
links are the same as part one, but, their capacity is selected to be 800 kbps, whereas other link capacities are selected to be 800 Mbps. All link propagation delays are set to 5 ms. It is assumed that sources have data for sending at all times (greedy sources). All links' buer sizes are set to 100 packets and, so, loss occurs in the network.
The go back n method has been used for
re-sending the packets that are doubly acknowledged. Links' scheduling discipline is FIFO. As in TCP, the slow-start method is used for initializing the rate allocation [11].
Receivers' congestion window sizes are set to unity and sender congestion window size [11] in the Kelly and Jacobi method are updated, according to Relations 17 and 18, respectively:
cwndr[
n+ 1] =fcwnd r[
n] +k r
:RTT r[
n] :(!
r
cwndr[ n]
RTTr[ n]
:d r[
n])g
+
; (17)
CWNDi[
n+ 1] =fCWND i[
n] +K i
:RTT i[
n] :(W
i[
n] CWND i[
n+ 1]
RTTi[ n]
:d i[
n])=D i[
n]g
+
;
(18) where CWND and cwnd are the congestion windows associated with the end and virtual users, respectively, and:
D i[
n], d
i[
n] + cwnd i[
n]
RTTi[ n] :
0 @
d i[
n] d i[
n 1]
cwndi[ n]
RTTi[ n]
cwndi[ n 1]
RTTi[ n 1]
1 A ;
and :
d r[
n] = RTT r[
n] d r
: (19)
d
r is the user,
r, propagation delay and its round trip
time is RTTr. Also, k
r= K
r= 0
:0003 has been used.
It is important that, as congestion occurs only in the bottleneck links located in the commonlinks, the rate allocation algorithm only consists of Equations 9 and 11, and Equation 12 has no eect on the rate allocation algorithm.
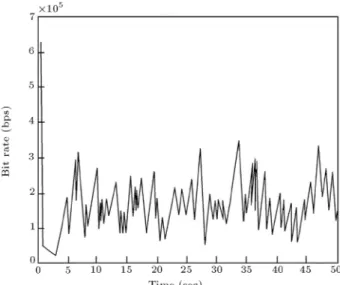
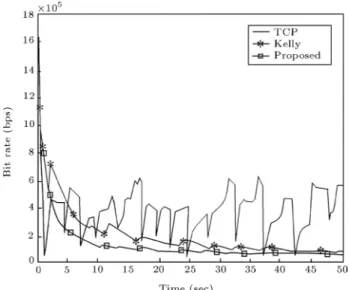
The simulation results for users in Figure 2 are depicted in Figures 7 to 10. In these gures, the proposed second order method has been compared with Kelly's method and TCP. It can be veried that the proposed method outperforms that of Kelly in convergence speed.
On the other hand, another outstanding feature of the proposed rate allocation strategy is that the user rates in the proposed method and that of Kelly, have less uctuations, with respect to TCP. Also, the rate allocation is TCP friendly [12], because none of the allocated rates in the Jacobi or Kelly methods are greater than their corresponding TCP rate alloca-tions.
Figure7. Background trac 25.
Figure8. Background trac 85.
Figure10. Rate allocated to user 14.
As Equations 17 and 18 use only the RTT and propagation delay of the connection, they can be implemented in an end-to-end manner, even on the current Internet.
CONCLUSION
In the current paper, the performance of a high-speed second-order algorithm has been compared with the conventional Kelly algorithm in the users arrival and departure and background trac aspect. Simulation results show that the proposed method allocates more rates to temporary users and, hence, is a good candi-date for some real-time applications. In the presence of variable bit rate background trac, the proposed algorithm outperforms that of Kelly in convergence speed.
REFERENCES
1. Gibbens, R.J. and Kelly, F.P., Resource Pricing and the Evolution of Congestion Control (June 1998),
Available: http://www.statslab.cam.ac.uk/frank
2. Brakmo, L.S. and Peterson, L.L. \Tcp Vegas: End to end congestion avoidance on a global internet",IEEE J. Select. Areas Commun., 13, pp 1465-1480 (Oct.
1995).
3. Mo, J. and Walrand, J. \Fair end-to-end window-based congestion control", IEEE/ACM Transactions on Networking,8(5), pp 556-567 (Oct. 2000).
4. Kelly, F.P., Maulloo, A.K. and Tan, D.K.H. \Rate control for communication networks: Shadow prices, proportional fairness and stability",J. Oper. Res. Soc.,
49(3), pp 237-252 (Mar. 1998).
5. Massoulie, L. and Roberts, J. \Bandwidth sharing: Objectives and algorithms", in Proc. IEEE INFO-COM,3, pp 1395-1403 (1999).
6. Shenker, S. \Fundamental design issues for the future internet",IEEE J. Selected Areas Commun.,13(7), pp
1176-1188 (Sept. 1995).
7. Bertsekas, D. and Tsitsiklis, J., Parallel and Dis-tributed Computation, Englewood Clis, NJ, Prentice-Hall (1989).
8. Goudarzi, P., Saidi, H. and Sheikholeslam, F. \In-vestigation of user arrival and departure in a high-speed proportionally-fair rate allocation algorithm",
IST2003, Isfahan, I.R. Iran (16-18 Aug. 2003). 9. Goudarzi, P., Saidi, H. and Sheikholeslam, F. \A
fuzzy-hierarchical algorithm for proportionally-fair rate allocation to elastic users", IEICE Trans. On Commun., E87-B(11), pp 3203-3215, Tokyo, Japan
(Nov. 2004).
10. Alpcan, T. and Basar, T. \Utility-based congestion control schemes for internet-style networks with de-lays",INFOCOM,3, pp 2039-2048 (2003).
11. Tanenbaum, A.S., Computer Networks, 3rd Edition, Prentice Hall, New Jersey (1996).
12. Keshav, S., Engineering Approach to Computer Net-working, Addison Wesley Professional, 1st Edition (1997).