System Event Log Troubleshooting
Guide for Intel
®
S5500/S3420 Series
Server Boards
Intel order number G74211-002
Revision 1.1
December 2013
Platform Collaboration and Systems Division – Marketing
Revision History
Date Revision
Number Modifications
August 2012 1.0 Initial draft. December 2013 1.1
Corrected IPMI Watchdog and PEF Sensors Typical Characteristics tables. Clarified Channel designators for DIMM memory errors.
Disclaimers
INFORMATION IN THIS DOCUMENT IS PROVIDED IN CONNECTION WITH INTEL PRODUCTS. NO LICENSE, EXPRESS OR IMPLIED, BY ESTOPPEL OR OTHERWISE, TO ANY INTELLECTUAL PROPERTY RIGHTS IS GRANTED BY THIS DOCUMENT. EXCEPT AS PROVIDED IN INTEL'S TERMS AND CONDITIONS OF SALE FOR SUCH PRODUCTS, INTEL ASSUMES NO LIABILITY WHATSOEVER AND INTEL DISCLAIMS ANY EXPRESS OR IMPLIED WARRANTY, RELATING TO SALE AND/OR USE OF INTEL PRODUCTS INCLUDING LIABILITY OR WARRANTIES RELATING TO FITNESS FOR A PARTICULAR PURPOSE, MERCHANTABILITY, OR
INFRINGEMENT OF ANY PATENT, COPYRIGHT OR OTHER INTELLECTUAL PROPERTY RIGHT.
A "Mission Critical Application" is any application in which failure of the Intel Product could result, directly or indirectly, in personal injury or death. SHOULD YOU PURCHASE OR USE INTEL'S PRODUCTS FOR ANY SUCH MISSION CRITICAL APPLICATION, YOU SHALL INDEMNIFY AND HOLD INTEL AND ITS SUBSIDIARIES,
SUBCONTRACTORS AND AFFILIATES, AND THE DIRECTORS, OFFICERS, AND EMPLOYEES OF EACH, HARMLESS AGAINST ALL CLAIMS COSTS, DAMAGES, AND EXPENSES AND REASONABLE ATTORNEYS' FEES ARISING OUT OF, DIRECTLY OR INDIRECTLY, ANY CLAIM OF PRODUCT LIABILITY, PERSONAL INJURY, OR DEATH ARISING IN ANY WAY OUT OF SUCH MISSION CRITICAL APPLICATION, WHETHER OR NOT INTEL OR ITS SUBCONTRACTOR WAS NEGLIGENT IN THE DESIGN, MANUFACTURE, OR WARNING OF THE INTEL PRODUCT OR ANY OF ITS PARTS.
Intel may make changes to specifications and product descriptions at any time, without notice. Designers must not rely on the absence or characteristics of any features or instructions marked "reserved" or "undefined". Intel reserves these for future definition and shall have no responsibility whatsoever for conflicts or incompatibilities arising from future changes to them. The information here is subject to change without notice. Do not finalize a design with this information.
The products described in this document may contain design defects or errors known as errata which may cause the product to deviate from published specifications. Current characterized errata are available on request.
Contact your local Intel sales office or your distributor to obtain the latest specifications and before placing your product order.
Copies of documents which have an order number and are referenced in this document, or other Intel literature, may be obtained by calling 1-800-548-4725, or go to: http://www.intel.com/design/literature.
Table of Contents
1.
Introduction ... 1
1.1
Purpose ... 1
1.2
Industry Standard ... 1
1.2.1
Intelligent Platform Management Interface (IPMI) ... 1
1.2.2
Baseboard Management Controller (BMC) ... 2
1.2.3
Intel
®Intelligent Power Node Manager Version 1.5 ... 3
2.
Basic Decoding of a SEL Record ... 4
2.1
Default Values in the SEL Records ... 4
3.
Sensor Cross Reference List ... 8
3.1
BMC owned Sensors (GID = 0020h) ... 8
3.2
BIOS POST owned Sensors (GID = 0001h) ... 12
3.3
BIOS SMI owned Sensors (GID = 0033h) ... 12
3.4
Hot Swap Controller Firmware owned Sensors (GID = 00C0h/00C2h) ... 14
3.5
Node Manager / ME Firmware owned Sensors (GID = 002Ch or 602Ch) ... 15
3.6
Microsoft* OS owned Events (GID = 0041) ... 16
3.7
Linux* Kernel Panic Events (GID = 0021) ... 16
4.
Power Subsystems ... 17
4.1
Voltage Sensors ... 17
4.2
Power Unit ... 21
4.2.1
Power Unit Status Sensor ... 21
4.2.2
Power Unit Redundancy Sensor... 22
4.3
Power Supply ... 24
4.3.1
Power Supply Status Sensors ... 24
4.3.2
Power Supply AC Power Input Sensors ... 25
4.3.3
Power Supply Current Output % Sensors ... 26
4.3.4
Power Supply Temperature Sensors ... 27
5.
Cooling Subsystem ... 29
5.1
Fan Sensors ... 29
5.1.1
Fan Speed Sensors... 29
5.1.2
Fan Presence and Redundancy Sensors ... 30
5.2
Temperature Sensors ... 33
5.2.1
Regular Temperature Sensors ... 33
5.2.2
Thermal Margin Sensors ... 35
5.2.3
Processor Thermal Control % Sensors... 36
5.2.4
Discrete Thermal Sensors ... 37
6.
Processor Subsystem ... 39
6.1
Processor Status Sensor ... 39
6.2
Catastrophic Error Sensor ... 40
6.3
CPU Missing Sensor ... 41
6.3.1
CPU Missing Sensor – Next Steps ... 42
6.4
QuickPath Interconnect Error Sensors ... 42
6.4.1
QPI Correctable Error Sensor ... 42
6.4.2
QPI Non-Fatal Error Sensor ... 43
6.4.3
QPI Fatal and Fatal #2 ... 44
7.
Memory Subsystem ... 46
7.1
Memory RAS Mirroring and Sparing ... 46
7.1.1
Mirroring Configuration Status ... 46
7.1.2
Mirrored Redundancy State Sensor ... 47
7.1.3
Sparing Configuration Status ... 49
7.1.4
Sparing Redundancy State Sensor ... 50
7.2
ECC and Address Parity ... 53
7.2.1
Memory Correctable and Uncorrectable ECC Error ... 53
7.2.2
Memory Address Parity Error ... 55
8.
PCI Express* and Legacy PCI Subsystem ... 58
8.1
PCI Express* Errors ... 58
8.1.1
PCI Express* Correctable Errors ... 58
8.1.2
PCI Express* Fatal Errors ... 59
8.1.3
Legacy PCI Errors ... 61
9.
System BIOS Events ... 63
9.1
System Events ... 63
9.1.1
System Boot ... 63
9.1.2
Timestamp Clock Synchronization ... 63
9.2
System Firmware Progress (Formerly Post Error) ... 64
9.2.1
System Firmware Progress (Formerly Post Error) – Next Steps ... 65
10.
Chassis Subsystem ... 71
10.1
Physical Security ... 71
10.1.1
Chassis Intrusion ... 71
10.1.2
LAN Leash Lost ... 71
10.2
FP (NMI) Interrupt ... 73
10.2.1
FP (NMI) Interrupt – Next Steps ... 73
10.3
Button Press Events ... 74
11.
Miscellaneous Events ... 75
11.1
IPMI Watchdog ... 75
11.2
SMI Timeout ... 77
11.2.1
SMI Timeout – Next Steps... 77
11.3
System Event Log Cleared ... 78
11.4
System Event – PEF Action ... 78
12.1
HSC Backplane Temperature Sensor ... 80
12.2
HSC Drive Slot Status Sensor ... 81
12.2.1
HSC Drive Slot Status Sensor – Next Steps ... 82
12.3
HSC Drive Presence Sensor ... 82
12.3.1
HSC Drive Presence Sensor – Next Steps ... 83
13.
Manageability Engine (ME) Events ... 85
13.1
Node Manager Exception Event ... 85
13.1.1
Node Manager Exception Event – Next Steps ... 86
13.2
Node Manager Health Event ... 86
13.2.1
Node Manager Health Event – Next Steps ... 87
13.3
Node Manager Operational Capabilities Change ... 88
13.3.1
Node Manager Operational Capabilities Change – Next Steps ... 89
13.4
Node Manager Alert Threshold Exceeded ... 90
13.4.1
Node Manager Alert Threshold Exceeded – Next Steps ... 91
13.5
ME Firmware Health Event ... 91
13.5.1
ME Firmware Health Event – Next Steps ... 92
14.
Microsoft Windows* Records ... 93
14.1
Boot-up Event Records ... 93
14.2
Shutdown Event Records ... 94
14.3
Bug Check / Blue Screen Event Records ... 97
List of Tables
Table 1: SEL Record Format ... 4
Table 2: Event Request Message Event Data Field Contents ... 6
Table 3: OEM SEL Record (Type C0h-DFh) ... 7
Table 4: OEM SEL Record (Type E0h-FFh) ... 7
Table 5: BMC owned Sensors ... 8
Table 6: BIOS POST owned Sensors ... 12
Table 7: BIOS SMI owned Sensors ... 13
Table 8: Hot Swap Controller Firmware owned Sensors ... 14
Table 9: Management Engine Firmware owned Sensors ... 15
Table 10: Microsoft* OS owned Events ... 16
Table 11: Linux* Kernel Panic Events ... 16
Table 12: Voltage Sensors Typical Characteristics ... 17
Table 13: Voltage Sensors Event Triggers – Description ... 18
Table 14: Voltage Sensors – Next Steps ... 18
Table 15: Power Unit Status Sensors Typical Characteristics ... 21
Table 16: Power Unit Status Sensor – Sensor Specific Offsets – Next Steps ... 22
Table 17: Power Unit Redundancy Sensors Typical Characteristics ... 23
Table 18: Power Unit Redundancy Sensor – Event Trigger Offset – Next Steps ... 23
Table 19: Power Supply Status Sensors Typical Characteristics ... 24
Table 20: Power Supply Status Sensor – Sensor Specific Offsets – Next Steps ... 24
Table 21: Power Supply AC Power Input Sensors Typical Characteristics ... 25
Table 22: Power Supply AC Power Input Sensor – Event Trigger Offset – Next Steps ... 26
Table 23: Power Supply Current Output % Sensors Typical Characteristics ... 26
Table 24: Power Supply Current Output % Sensor – Event Trigger Offset – Next Steps ... 27
Table 25: Power Supply Temperature Sensors Typical Characteristics ... 28
Table 26: Power Supply Temperature Sensor – Event Trigger Offset – Next Steps ... 28
Table 27: Fan Speed Sensors Typical Characteristics ... 29
Table 28: Fan Speed Sensor – Event Trigger Offset – Next Steps ... 30
Table 29: Fan Presence Sensors Typical Characteristics ... 30
Table 30: Fan Presence Sensors – Event Trigger Offset – Next Steps ... 31
Table 31: Fan Redundancy Sensors Typical Characteristics ... 31
Table 32: Fan Redundancy Sensor – Event Trigger Offset – Next Steps ... 32
Table 33: Temperature Sensors Typical Characteristics ... 33
Table 34: Temperature Sensors Event Triggers – Description ... 34
Table 35: Temperature Sensors – Next Steps... 34
Table 36: Thermal Margin Sensors Typical Characteristics ... 35
Table 37: Thermal Margin Sensors Event Triggers – Description ... 35
Table 40: Processor Thermal Control % Sensors Event Triggers – Description ... 37
Table 41: Processor Thermal Control % Sensors – Next Steps ... 37
Table 42: Discrete Thermal Sensors Typical Characteristics ... 38
Table 43: Discrete Thermal Sensors – Next Steps ... 38
Table 44: Process Status Sensors Typical Characteristics ... 39
Table 45: Processor Status Sensors – Next Steps ... 40
Table 46: Catastrophic Error Sensor Typical Characteristics... 40
Table 47: CPU Missing Sensor Typical Characteristics ... 41
Table 48: QPI Correctable Error Sensor Typical Characteristics ... 42
Table 49: QPI Non-Fatal Error Sensor Typical Characteristics ... 43
Table 50: QPI Fatal Error Sensor Typical Characteristics ... 44
Table 51: QPI Fatal #2 Error Sensor Typical Characteristics... 45
Table 52: Mirroring Configuration Status Sensor Typical Characteristics ... 46
Table 53: Mirroring Configuration Status Sensor Event Trigger Offset – Next Steps ... 47
Table 54: Mirrored Redundancy State Sensor Typical Characteristics ... 48
Table 55: Mirrored Redundancy State Sensor Event Trigger Offset – Next Steps ... 49
Table 56: Sparing Configuration Status Sensor Typical Characteristics ... 49
Table 57: Sparing Configuration Status Sensor Event Trigger Offset – Next Steps ... 50
Table 58: Sparing Redundancy State Sensor Typical Characteristics ... 51
Table 59: Sparing Redundancy State Sensor Event Trigger Offset – Next Steps ... 52
Table 60: Correctable and Uncorrectable ECC Error Sensor Typical Characteristics ... 53
Table 61: Correctable and Uncorrectable ECC Error Sensor Event Trigger Offset – Next Steps54
Table 62: Address Parity Error Sensor Typical Characteristics ... 55
Table 63: PCI Express* Correctable Error Sensor Typical Characteristics ... 58
Table 64: PCI Express* Correctable Error Sensor Event Trigger Offset – Next Steps ... 59
Table 65: PCI Express* Fatal Error Sensor Typical Characteristics ... 60
Table 66: PCI Express* Fatal Error Sensor Event Trigger Offset – Next Steps ... 60
Table 67: Legacy PCI Error Sensor Typical Characteristics ... 62
Table 68: Legacy PCI Error Sensor Event Trigger Offset – Next Steps ... 62
Table 69: System Event Sensor Typical Characteristics ... 64
Table 70: POST Error Sensor Typical Characteristics ... 65
Table 71: POST Error Codes ... 65
Table 72: Physical Security Sensor Typical Characteristics ... 71
Table 73: Physical Security Sensor Event Trigger Offset – Next Steps ... 72
Table 74: FP (NMI) Interrupt Sensor Typical Characteristics ... 73
Table 75: Button Press Events Sensor Typical Characteristics ... 74
Table 76: IPMI Watchdog Sensor Typical Characteristics ... 75
Table 77: IPMI Watchdog Sensor Event Trigger Offset – Next Steps ... 76
Table 78: SMI Timeout Sensor Typical Characteristics ... 77
Table 79: System Event Log Cleared Sensor Typical Characteristics ... 78
Table 81: HSC Backplane Temperature Sensor Typical Characteristics ... 80
Table 82: HSC Backplane Temperature Sensor – Event Trigger Offset – Next Steps ... 81
Table 83: HSC Drive Slot Status Sensor Typical Characteristics ... 81
Table 84: HSC Drive Presence Sensor Typical Characteristics ... 83
Table 85: Node Manager Exception Sensor Typical Characteristics ... 85
Table 86: Node Manager Health Event Sensor Typical Characteristics ... 86
Table 87: Node Manager Operational Capabilities Change Sensor Typical Characteristics ... 88
Table 88: Node Manager Alert Threshold Exceeded Sensor Typical Characteristics ... 90
Table 89: ME Firmware Health Event Sensor Typical Characteristics ... 91
Table 90: ME Firmware Health Event Sensor – Next Steps ... 92
Table 91: Boot-up Event Record Typical Characteristics ... 93
Table 92: Boot-up OEM Event Record Typical Characteristics ... 94
Table 93: Shutdown Reason Code Event Record Typical Characteristics ... 95
Table 94: Shutdown Reason OEM Event Record Typical Characteristics ... 95
Table 95: Shutdown Comment OEM Event Record Typical Characteristics ... 96
Table 96: Bug Check / Blue Screen – OS Stop Event Record Typical Characteristics ... 97
Table 97: Bug Check / Blue Screen Code OEM Event Record Typical Characteristics ... 97
Table 98: Linux* Kernel Panic Event Record Characteristics ... 99
1.
Introduction
The server management hardware that is part of Intel
®Server Boards and Intel
®Server
Platforms serves as a vital part of the overall server management strategy. The server
management hardware provides essential information to the system administrator and provides
the administrator the ability to remotely control the server, even when the operating system is
not running.
The Intel
®Server Boards and Intel
®Server Platforms offer comprehensive hardware and
software based solutions. The server management features make the servers simple to manage
and provide alerting on system events. From entry to enterprise systems, good overall server
management is essential to reduce overall total cost of ownership.
This
Troubleshooting Guide
is intended to help the users better understand the events that are
logged in the Baseboard Management Controllers (BMC) System Event Logs (SEL) on these
Intel
®Server Boards.
There is a separate
User’s Guide
that covers the general server management and the server
management software offered on Intel
®Server Boards and Intel
®Server Platforms.
Server boards currently supported by this document:
Intel
®S3200/X38ML Server Boards
Intel
®S5500/S3420 Series Server Boards
1.1
Purpose
The purpose of this document is to list all possible events generated by the Intel
®platform. It
may be possible that other sources (not under our control) also generate events, which will not
be described in this document.
1.2
Industry Standard
1.2.1
Intelligent Platform Management Interface (IPMI)
The key characteristic of the Intelligent Platform Management Interface (IPMI) is that the
inventory, monitoring, logging, and recovery control functions are available independently of the
main processors, BIOS, and operating system. Platform management functions can also be
made available when the system is in a power-down state.
IPMI works by interfacing with the BMC, which extends management capabilities in the server
system and operates independently of the main processor by monitoring the on-board
instrumentation. Through the BMC, IPMI also allows administrators to control power to the
server, and remotely access BIOS configuration and operating system console information.
IPMI defines a common platform instrumentation interface to enable interoperability between:
The baseboard management controller and chassis
The baseboard management controller and systems management software
Between servers
IPMI enables the following:
Common access to platform management information, consisting of:
-
Local access from systems management software
-
Remote access from LAN
-
Inter-chassis access from Intelligent Chassis Management Bus
-
Access from LAN, serial/modem, IPMB, PCI SMBus*, or ICMB, available even if the
processor is down
IPMI interface isolates systems management software from hardware.
Hardware advancements can be made without impacting the systems management
software.
IPMI facilitates cross-platform management software.
You can find more information on IPMI at the following URL:
http://www.intel.com/design/servers/ipmi
1.2.2
Baseboard Management Controller (BMC)
A baseboard management controller (BMC) is a specialized microcontroller embedded on most
Intel
®Server Boards. The BMC is the heart of the IPMI architecture and provides the
intelligence behind intelligent platform management, that is, the autonomous monitoring and
recovery features implemented directly in platform management hardware and firmware.
Different types of sensors built into the computer system report to the BMC on parameters such
as temperature, cooling fan speeds, power mode, operating system status, and so on. The BMC
monitors the system for critical events by communicating with various sensors on the system
board; it sends alerts and logs events when certain parameters exceed their preset thresholds,
indicating a potential failure of the system. The administrator can also remotely communicate
with the BMC to take some corrective actions such as resetting or power cycling the system to
get a hung OS running again. These abilities save on the total cost of ownership of a system.
For Intel
®Server Boards and Intel
®Server Platforms, the BMC supports the industry-standard
IPMI 2.0 Specification
, enabling you to configure, monitor, and recover systems remotely.
1.2.2.1
System Event Log (SEL)
The BMC provides a centralized, non-volatile repository for critical, warning, and informational
system events called the System Event Log or SEL. By having the BMC manage the SEL and
logging functions, it helps to ensure that “post-mortem” logging information is available if a
failure occurs that disables the systems processor(s).
The BMC allows access to SEL from in-band and out-of-band mechanisms. There are various
tools and utilities that can be used to access the SEL. There is the Intel
®SELViewer and
multiple open sourced IPMI tools.
1.2.3
Intel
®Intelligent Power Node Manager Version 1.5
Intel
®Intelligent Power Node Manager version 1.5 (NM) is a platform-resident technology that
enforces power and thermal policies for the platform. These policies are applied by exploiting
subsystem knobs (such as processor P and T states) that can be used to control power
consumption. Intel
®Intelligent Power Node Manager enables data center power and thermal
management by exposing an external interface to management software through which platform
policies can be specified. It also enables specific data center power management usage models
such as power limiting.
The configuration and control commands are used by the external management software or
BMC to configure and control the Intel
®Intelligent Power Node Manager feature. Because
Platform Services firmware does not have any external interface, external commands are first
received by the BMC over LAN and then relayed to the Platform Services firmware over IPMB
channel. The BMC acts as a relay and the transport conversion device for these commands. For
simplicity, the commands from the management console might be encapsulated in a generic
CONFIG packet format (config data length, config data blob) to the BMC so that the BMC
doesn’t even have to parse the actual configuration data.
The BMC provides the access point for remote commands from external management SW and
generates alerts to them. Intel
®Intelligent Power Node Manager on Intel
®Manageability Engine
(Intel
®ME) is an IPMI satellite controller. A mechanism needs to exist to forward commands to
Intel
®ME and send response back to originator. Similarly events from Intel
®ME have to be sent
as alerts outside of the BMC. It is the responsibility of BMC to implement these mechanisms for
communication with Intel
®Intelligent Power Node Manager.
The full specification can be downloaded from the following link:
http://www.intel.com/content/dam/doc/technical-specification/intelligent-power-node-manager-1-5-specification.pdf
2.
Basic Decoding of a SEL Record
The System Event Log (SEL) record format is defined in the
IPMI Specification
. The following
section provides a basic definition for each of the fields in a SEL. For more details see the
IPMI
Specification
.
The definitions for the standard SEL can be found in Table 1.
The definitions for the OEM defined event logs can be found in Table 3 and Table 4.
2.1
Default Values in the SEL Records
Unless otherwise noted in the event record descriptions the following are the default values in
all SEL entries.
Byte [3] = Record Type (RT) = 02h = System event record
Byte [9:8] = Generator ID = 0020h = BMC Firmware
Byte [10] = Event Message Revision (ER) = 04h = IPMI 2.0
Table 1: SEL Record Format
Byte Field Description
1 2
Record ID
(RID) ID used for SEL Record access. 3 Record Type
(RT) [7:0] – Record Type 02h = System event record
C0h-DFh = OEM timestamped, bytes 8-16 OEM defined (See Table 3) E0h-FFh = OEM non-timestamped, bytes 4-16 OEM defined (See Table 4) 4
5 6 7
Timestamp
(TS) Time when event was logged. LS byte first. Example: TS:[29][76][68][4C] = 4C687629h = 1281914409 = Sun, 15 Aug 2010 23:20:09 UTC
Byte Field Description
8 9
Generator ID (GID)
RqSA and LUN if event was generated from IPMB. Software ID if event was generated from system software. Byte 1
[7:1] – 7-bit I2C Slave Address, or 7-bit system software ID [0] 0b = ID is IPMB Slave Address
1b = System software ID Software ID values:
0001h – BIOS POST for POST errors, RAS Configuration/State, Timestamp Synch, OS Boot events
0033h – BIOS SMI Handler 0020h – BMC Firmware 002Ch – ME Firmware
0041h – Server Management Software 00C0h – HSC Firmware – HSBP A 00C2h – HSC Firmware – HSBP B Byte 2
[7:4] – Channel number. Channel that event message was received over. 0h if the event message was received from the system interface, primary IPMB, or internally generated by the BMC.
[3:2] – Reserved. Write as 00b.
[1:0] – IPMB device LUN if byte 1 holds Slave Address. 00b otherwise. 10 EvM Rev
(ER)
Event Message format version. 04h = IPMI v2.0; 03h = IPMI v1.0 11 Sensor Type
(ST)
Sensor Type Code for sensor that generated the event 12 Sensor #
(SN)
Number of sensor that generated the event (From SDR) 13 Event Dir | Event Type (EDIR) Event Dir [7] – 0b = Assertion event. 1b = Deassertion event. Event Type
Type of trigger for the event, for example, critical threshold going high, state asserted, and so on. Also indicates class of the event. For example, discrete, threshold, or OEM. The Event Type field is encoded using the Event/Reading Type Code.
[6:0] – Event Type Codes
01h = Threshold (States = 0x00-0x0b) 02h-0ch = Discrete
6Fh = Sensor-Specific 70-7Fh = OEM 14 Event Data 1
(ED1) Per Table 2: Event Request Message Event Data Field Contents 15 Event Data 2
(ED2) 16 Event Data 3
Table 2: Event Request Message Event Data Field Contents
Sensor
Class Event Data
Threshold Event Data 1
[7:6] – 00b = Unspecified Event Data 2 01b = Trigger reading in Event Data 2 10b = OEM code in Event Data 2
11b = Sensor-specific event extension code in Event Data 2 [5:4] – 00b = Unspecified Event Data 3
01b = Trigger threshold value in Event Data 3 10b = OEM code in Event Data 3
11b = Sensor-specific event extension code in Event Data 3 [3:0] – Offset from Event/Reading Code for threshold event.
Event Data 2 – Reading that triggered event, FFh or not present if unspecified.
Event Data 3 – Threshold value that triggered event, FFh or not present if unspecified. If present, Event Data 2 must be present.
discrete Event Data 1
[7:6] – 00b = Unspecified Event Data 2
01b = Previous state and/or severity in Event Data 2 10b = OEM code in Event Data 2
11b = Sensor-specific event extension code in Event Data 2 [5:4] – 00b = Unspecified Event Data 3
01b = Reserved
10b = OEM code in Event Data 3
11b = Sensor-specific event extension code in Event Data 3 [3:0] – Offset from Event/Reading Code for discrete event state Event Data 2
[7:4] – Optional offset from “Severity” Event/Reading Code (0Fh if unspecified).
[3:0] – Optional offset from Event/Reading Type Code for previous discrete event state (0Fh if unspecified).
Event Data 3 – Optional OEM code. FFh or not present if unspecified. OEM Event Data 1
[7:6] – 00b = Unspecified in Event Data 2
01b = Previous state and/or severity in Event Data 2 10b = OEM code in Event Data 2
11b = Reserved
[5:4] – 00b = Unspecified Event Data 3 01b = Reserved
10b = OEM code in Event Data 3 11b = Reserved
[3:0] – Offset from Event/Reading Type Code Event Data 2
[7:4] – Optional OEM code bits or offset from “Severity” Event/Reading Type Code (0Fh if unspecified). [3:0] – Optional OEM code or offset from Event/Reading Type Code for previous event state (0Fh if unspecified).
Table 3: OEM SEL Record (Type C0h-DFh)
Byte Field Description
1 2
Record ID
(RID) ID used for SEL Record access. 3 Record Type
(RT) [7:0] – Record Type C0h-DFh = OEM timestamped, bytes 8-16 OEM defined 4
5 6 7
Timestamp
(TS) Time when event was logged. LS byte first. Example: TS:[29][76][68][4C] = 4C687629h = 1281914409 = Sun, 15 Aug 2010 23:20:09 UTC
Note: There are various websites that will convert the raw number to a date/time. 8
9 10
Manufacturer ID LS Byte first. The manufacturer ID is a 20-bit value that is derived from the IANA “Private Enterprise” ID.
Most significant four bits = Reserved (0000b). 000000h = Unspecified. 0FFFFFh = Reserved. This value is binary encoded.
For example the ID for the IPMI forum is 7154 decimal, which is 1BF2h, which will be stored in this record as F2h, 1Bh, 00h for bytes 8 through 10, respectively.
11 12 13 14 15 16
OEM Defined OEM Defined. This is defined according to the manufacturer identified by the Manufacturer ID field.
Table 4: OEM SEL Record (Type E0h-FFh)
Byte Field Description
1 2
Record ID (RID)
ID used for SEL Record access. 3 Record Type
(RT) [7:0] – Record Type E0h-FFh = OEM system event record 4 5 6 7 8 9 10 11 12 13 14 15 16
3.
Sensor Cross Reference List
This section contains a cross reference to help find details on any specific SEL entry.
3.1
BMC owned Sensors (GID = 0020h)
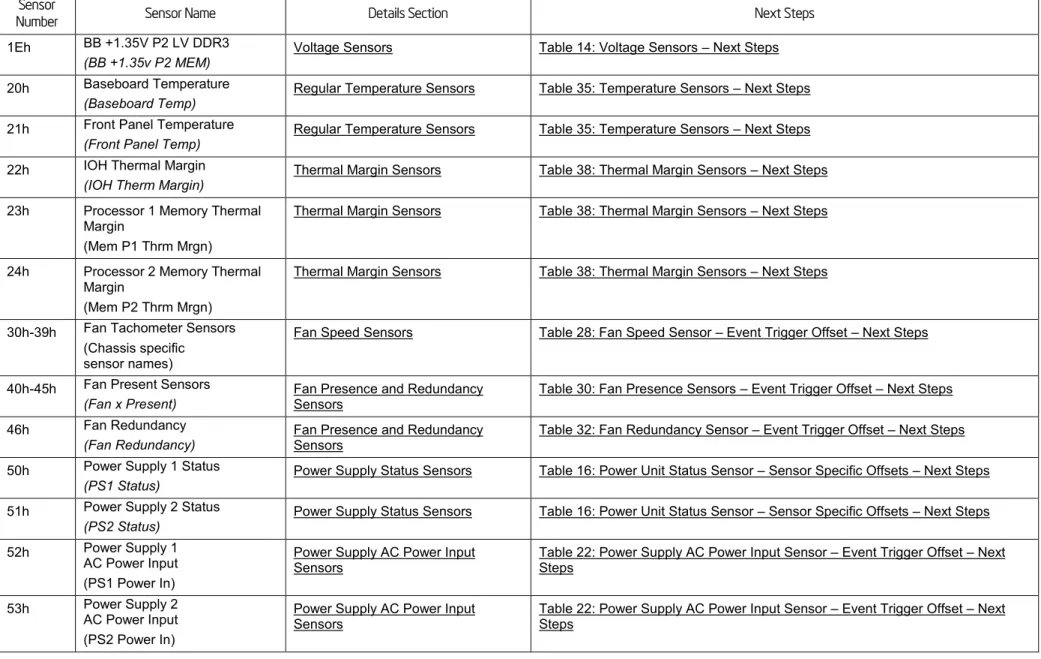
The following table can be used to find the details of sensors owned by the BMC.
Table 5: BMC owned Sensors
Sensor
Number Sensor Name Details Section Next Steps
01h Power Unit Status (Pwr Unit Status)
Power Unit Status Sensor Table 16: Power Unit Status Sensor – Sensor Specific Offsets – Next Steps 02h Power Unit Redundancy
(Pwr Unit Redund)
Power Unit Redundancy Sensor Table 18: Power Unit Redundancy Sensor – Event Trigger Offset – Next Steps 03h IPMI Watchdog
(IPMI Watchdog)
IPMI Watchdog Table 77: IPMI Watchdog Sensor Event Trigger Offset – Next Steps 04h Physical Security
(Physical Scrty)
Physical Security Table 73: Physical Security Sensor Event Trigger Offset – Next Steps 05h FP Interrupt
(FP NMI Diag Int)
FP (NMI) Interrupt FP (NMI) Interrupt – Next Steps 06h SMI Timeout
(SMI Timeout)
SMI Timeout SMI Timeout – Next Steps 07h System Event Log
(System Event Log)
System Event Log Cleared Not applicable 08h System Event
(System Event)
System Event – PEF Action System Event – PEF Action – Next Steps 09h Button Press Event
(Button Press)
Sensor
Number Sensor Name Details Section Next Steps
10h BB +1.1V IOH (BB +1.1V IOH)
Voltage Sensors Table 14: Voltage Sensors – Next Steps 11h BB +1.1V P1 Vccp
(BB +1.1V P1 Vccp)
Voltage Sensors Table 14: Voltage Sensors – Next Steps 12h BB +1.1V P2 Vccp
(BB +1.1V P2 Vccp)
Voltage Sensors Table 14: Voltage Sensors – Next Steps 13h BB +1.5V P1 DDR3
(BB +1.5V P1 DDR3)
Voltage Sensors Table 14: Voltage Sensors – Next Steps 14h BB +1.5V P2 DDR3
(BB +1.5V P2 DDR3)
Voltage Sensors Table 14: Voltage Sensors – Next Steps 15h BB +1.8V AUX
(BB +1.8V AUX)
Voltage Sensors Table 14: Voltage Sensors – Next Steps 16h BB +3.3V
(BB +3.3V)
Voltage Sensors Table 14: Voltage Sensors – Next Steps 17h BB +3.3V STBY
(BB +3.3V STBY)
Voltage Sensors Table 14: Voltage Sensors – Next Steps 18h BB +3.3V Vbat
(BB +3.3V Vbat)
Voltage Sensors Table 14: Voltage Sensors – Next Steps 19h BB +5.0V
(BB +5.0V)
Voltage Sensors Table 14: Voltage Sensors – Next Steps 1Ah BB +5.0V STBY
(BB +5.0V STBY)
Voltage Sensors Table 14: Voltage Sensors – Next Steps 1Bh BB +12.0V
(BB +12.0V)
Voltage Sensors Table 14: Voltage Sensors – Next Steps 1Ch BB -12.0V
(BB -12.0V) Voltage Sensors Table 14: Voltage Sensors – Next Steps
Sensor
Number Sensor Name Details Section Next Steps
1Eh BB +1.35V P2 LV DDR3 (BB +1.35v P2 MEM)
Voltage Sensors Table 14: Voltage Sensors – Next Steps 20h Baseboard Temperature
(Baseboard Temp)
Regular Temperature Sensors Table 35: Temperature Sensors – Next Steps 21h Front Panel Temperature
(Front Panel Temp) Regular Temperature Sensors Table 35: Temperature Sensors – Next Steps 22h IOH Thermal Margin
(IOH Therm Margin) Thermal Margin Sensors Table 38: Thermal Margin Sensors – Next Steps 23h Processor 1 Memory Thermal
Margin
(Mem P1 Thrm Mrgn)
Thermal Margin Sensors Table 38: Thermal Margin Sensors – Next Steps
24h Processor 2 Memory Thermal Margin
(Mem P2 Thrm Mrgn)
Thermal Margin Sensors Table 38: Thermal Margin Sensors – Next Steps
30h-39h Fan Tachometer Sensors (Chassis specific
sensor names)
Fan Speed Sensors Table 28: Fan Speed Sensor – Event Trigger Offset – Next Steps
40h-45h Fan Present Sensors
(Fan x Present) Fan Presence and Redundancy Sensors Table 30: Fan Presence Sensors – Event Trigger Offset – Next Steps 46h Fan Redundancy
(Fan Redundancy)
Fan Presence and Redundancy Sensors
Table 32: Fan Redundancy Sensor – Event Trigger Offset – Next Steps 50h Power Supply 1 Status
(PS1 Status)
Power Supply Status Sensors Table 16: Power Unit Status Sensor – Sensor Specific Offsets – Next Steps 51h Power Supply 2 Status
(PS2 Status) Power Supply Status Sensors Table 16: Power Unit Status Sensor – Sensor Specific Offsets – Next Steps 52h Power Supply 1
AC Power Input (PS1 Power In)
Power Supply AC Power Input
Sensors Table 22: Power Supply AC Power Input Sensor – Event Trigger Offset – Next Steps 53h Power Supply 2
AC Power Input (PS2 Power In)
Power Supply AC Power Input Sensors
Table 22: Power Supply AC Power Input Sensor – Event Trigger Offset – Next Steps
Sensor
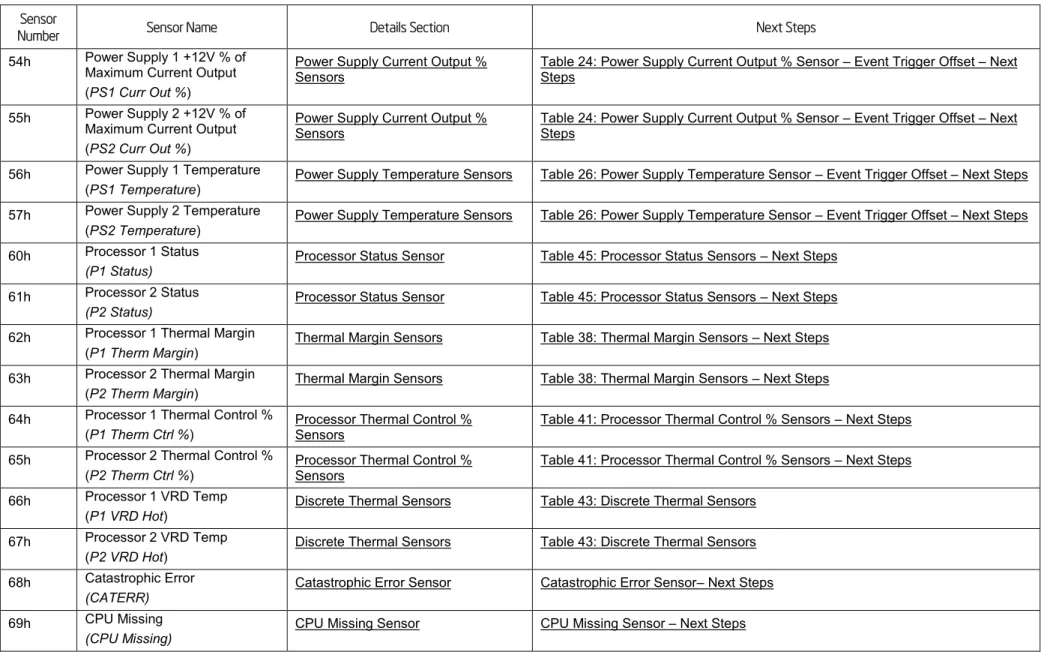
Number Sensor Name Details Section Next Steps
54h Power Supply 1 +12V % of Maximum Current Output (PS1 Curr Out %)
Power Supply Current Output % Sensors
Table 24: Power Supply Current Output % Sensor – Event Trigger Offset – Next Steps
55h Power Supply 2 +12V % of Maximum Current Output (PS2 Curr Out %)
Power Supply Current Output %
Sensors Table 24: Power Supply Current Output % Sensor – Event Trigger Offset – Next Steps 56h Power Supply 1 Temperature
(PS1 Temperature) Power Supply Temperature Sensors Table 26: Power Supply Temperature Sensor – Event Trigger Offset – Next Steps 57h Power Supply 2 Temperature
(PS2 Temperature) Power Supply Temperature Sensors Table 26: Power Supply Temperature Sensor – Event Trigger Offset – Next Steps 60h Processor 1 Status
(P1 Status) Processor Status Sensor Table 45: Processor Status Sensors – Next Steps 61h Processor 2 Status
(P2 Status)
Processor Status Sensor Table 45: Processor Status Sensors – Next Steps 62h Processor 1 Thermal Margin
(P1 Therm Margin)
Thermal Margin Sensors Table 38: Thermal Margin Sensors – Next Steps 63h Processor 2 Thermal Margin
(P2 Therm Margin) Thermal Margin Sensors Table 38: Thermal Margin Sensors – Next Steps 64h Processor 1 Thermal Control %
(P1 Therm Ctrl %) Processor Thermal Control % Sensors Table 41: Processor Thermal Control % Sensors – Next Steps 65h Processor 2 Thermal Control %
(P2 Therm Ctrl %) Processor Thermal Control % Sensors Table 41: Processor Thermal Control % Sensors – Next Steps 66h Processor 1 VRD Temp
(P1 VRD Hot)
Discrete Thermal Sensors Table 43: Discrete Thermal Sensors 67h Processor 2 VRD Temp
(P2 VRD Hot)
Discrete Thermal Sensors Table 43: Discrete Thermal Sensors 68h Catastrophic Error
(CATERR) Catastrophic Error Sensor Catastrophic Error Sensor– Next Steps 69h CPU Missing
Sensor
Number Sensor Name Details Section Next Steps
6Ah IOH Thermal Trip (IOH Thermal Trip)
Discrete Thermal Sensors Table 43: Discrete Thermal Sensors
3.2
BIOS POST owned Sensors (GID = 0001h)
The following table can be used to find the details of sensors owned by BIOS POST.
Table 6: BIOS POST owned Sensors
Sensor
Number Sensor Name Details Section Next Steps
01h Mirroring Redundancy State Mirrored Redundancy State Sensor Table 55: Mirrored Redundancy State Sensor Event Trigger Offset – Next Steps 06h POST Error System Firmware Progress (Formerly
Post Error)
System Firmware Progress (Formerly Post Error) – Next Steps
11h Sparing Redundancy State Sparing Redundancy State Sensor Table 59: Sparing Redundancy State Sensor Event Trigger Offset – Next Steps 12h Mirroring Configuration Status Mirroring Configuration Status Table 53: Mirroring Configuration Status Sensor Event Trigger Offset – Next Steps 13h Sparing Configuration Status Sparing Configuration Status Table 57: Sparing Configuration Status Sensor Event Trigger Offset – Next Steps
83h System Event System Events Not applicable
3.3
BIOS SMI owned Sensors (GID = 0033h)
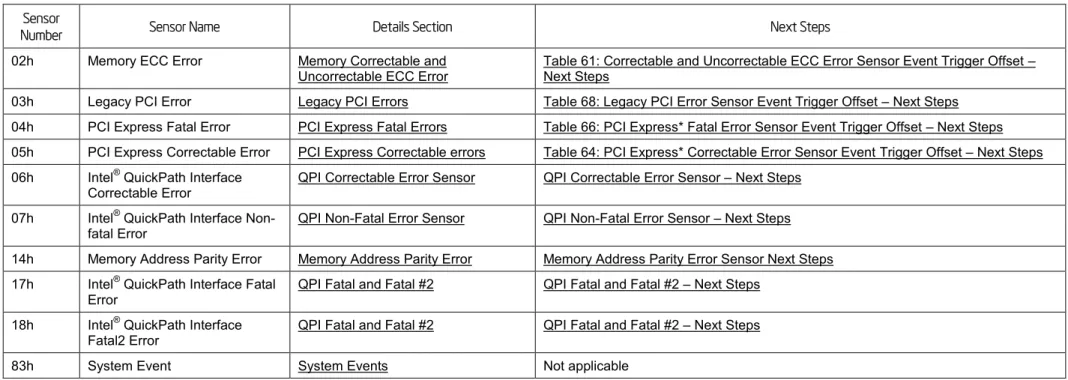
Table 7: BIOS SMI owned Sensors
Sensor
Number Sensor Name Details Section Next Steps
02h Memory ECC Error Memory Correctable and Uncorrectable ECC Error
Table 61: Correctable and Uncorrectable ECC Error Sensor Event Trigger Offset – Next Steps
03h Legacy PCI Error Legacy PCI Errors Table 68: Legacy PCI Error Sensor Event Trigger Offset – Next Steps 04h PCI Express Fatal Error PCI Express Fatal Errors Table 66: PCI Express* Fatal Error Sensor Event Trigger Offset – Next Steps 05h PCI Express Correctable Error PCI Express Correctable errors Table 64: PCI Express* Correctable Error Sensor Event Trigger Offset – Next Steps 06h Intel® QuickPath Interface
Correctable Error QPI Correctable Error Sensor QPI Correctable Error Sensor – Next Steps 07h Intel® QuickPath Interface
Non-fatal Error QPI Non-Fatal Error Sensor QPI Non-Fatal Error Sensor – Next Steps 14h Memory Address Parity Error Memory Address Parity Error Memory Address Parity Error Sensor Next Steps 17h Intel® QuickPath Interface Fatal
Error QPI Fatal and Fatal #2 QPI Fatal and Fatal #2 – Next Steps 18h Intel® QuickPath Interface
Fatal2 Error QPI Fatal and Fatal #2 QPI Fatal and Fatal #2 – Next Steps
3.4
Hot Swap Controller Firmware owned Sensors (GID = 00C0h/00C2h)
The following table can be used to find the details of sensors owned by the Hot Swap Controller (HSC) firmware. The HSC firmware resides on
a Hot Swap Back Plane (HSBP). There can be up to two HSBPs in a system. Each HSBP will have its own GID.
00C0h = HSC Firmware – HSBP A
00C2h = HSC Firmware – HSBP B
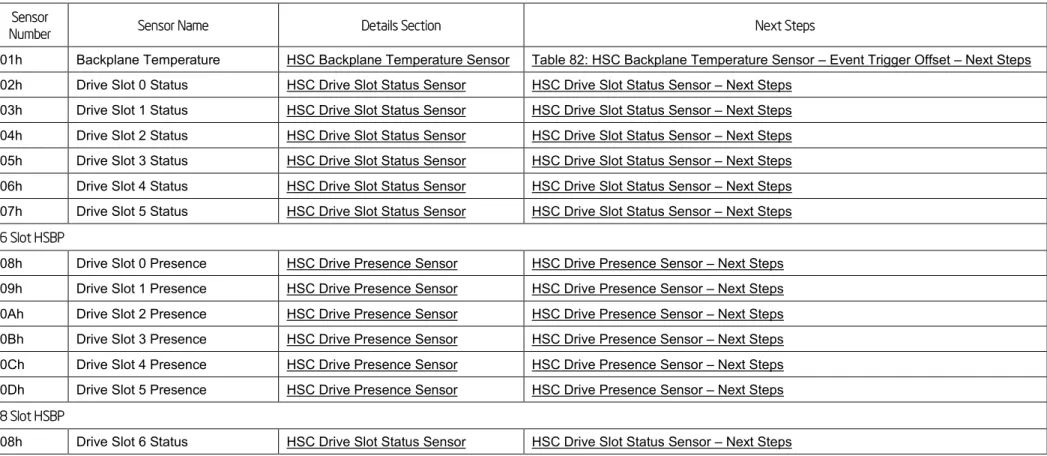
Table 8: Hot Swap Controller Firmware owned Sensors
Sensor
Number Sensor Name Details Section Next Steps
01h Backplane Temperature HSC Backplane Temperature Sensor Table 82: HSC Backplane Temperature Sensor – Event Trigger Offset – Next Steps 02h Drive Slot 0 Status HSC Drive Slot Status Sensor HSC Drive Slot Status Sensor – Next Steps
03h Drive Slot 1 Status HSC Drive Slot Status Sensor HSC Drive Slot Status Sensor – Next Steps 04h Drive Slot 2 Status HSC Drive Slot Status Sensor HSC Drive Slot Status Sensor – Next Steps 05h Drive Slot 3 Status HSC Drive Slot Status Sensor HSC Drive Slot Status Sensor – Next Steps 06h Drive Slot 4 Status HSC Drive Slot Status Sensor HSC Drive Slot Status Sensor – Next Steps 07h Drive Slot 5 Status HSC Drive Slot Status Sensor HSC Drive Slot Status Sensor – Next Steps
6 Slot HSBP
08h Drive Slot 0 Presence HSC Drive Presence Sensor HSC Drive Presence Sensor – Next Steps 09h Drive Slot 1 Presence HSC Drive Presence Sensor HSC Drive Presence Sensor – Next Steps 0Ah Drive Slot 2 Presence HSC Drive Presence Sensor HSC Drive Presence Sensor – Next Steps 0Bh Drive Slot 3 Presence HSC Drive Presence Sensor HSC Drive Presence Sensor – Next Steps 0Ch Drive Slot 4 Presence HSC Drive Presence Sensor HSC Drive Presence Sensor – Next Steps 0Dh Drive Slot 5 Presence HSC Drive Presence Sensor HSC Drive Presence Sensor – Next Steps
8 Slot HSBP
Sensor
Number Sensor Name Details Section Next Steps
09h Drive Slot 7 Status HSC Drive Slot Status Sensor HSC Drive Slot Status Sensor – Next Steps 0Ah Drive Slot 0 Presence HSC Drive Presence Sensor HSC Drive Presence Sensor – Next Steps 0Bh Drive Slot 1 Presence HSC Drive Presence Sensor HSC Drive Presence Sensor – Next Steps 0Ch Drive Slot 2 Presence HSC Drive Presence Sensor HSC Drive Presence Sensor – Next Steps 0Dh Drive Slot 3 Presence HSC Drive Presence Sensor HSC Drive Presence Sensor – Next Steps 0Eh Drive Slot 4 Presence HSC Drive Presence Sensor HSC Drive Presence Sensor – Next Steps 0Fh Drive Slot 5 Presence HSC Drive Presence Sensor HSC Drive Presence Sensor – Next Steps 10h Drive Slot 6 Presence HSC Drive Presence Sensor HSC Drive Presence Sensor – Next Steps 11h Drive Slot 7 Presence HSC Drive Presence Sensor HSC Drive Presence Sensor – Next Steps
3.5
Node Manager / ME Firmware owned Sensors (GID = 002Ch or 602Ch)
The following table can be used to find the details of sensors owned by the Node Manager / Management Engine (ME) firmware.
Table 9: Management Engine Firmware owned Sensors
Sensor
Number Sensor Name Details Section Next Steps
17h ME Firmware Health Events ME Firmware Health Event ME Firmware Health Event – Next Steps 18h Node Manager Exception Events Node Manager Exception Event Node Manager Exception Event – Next Steps 19h Node Manager Health Events Node Manager Health Event Node Manager Health Event – Next Steps 1Ah Node Manager Operational Capabilities
Change Events Node Manager Operational Capabilities Change Node Manager Operational Capabilities Change – Next Steps 1Bh Node Manager Alert Threshold Exceeded
Events
3.6
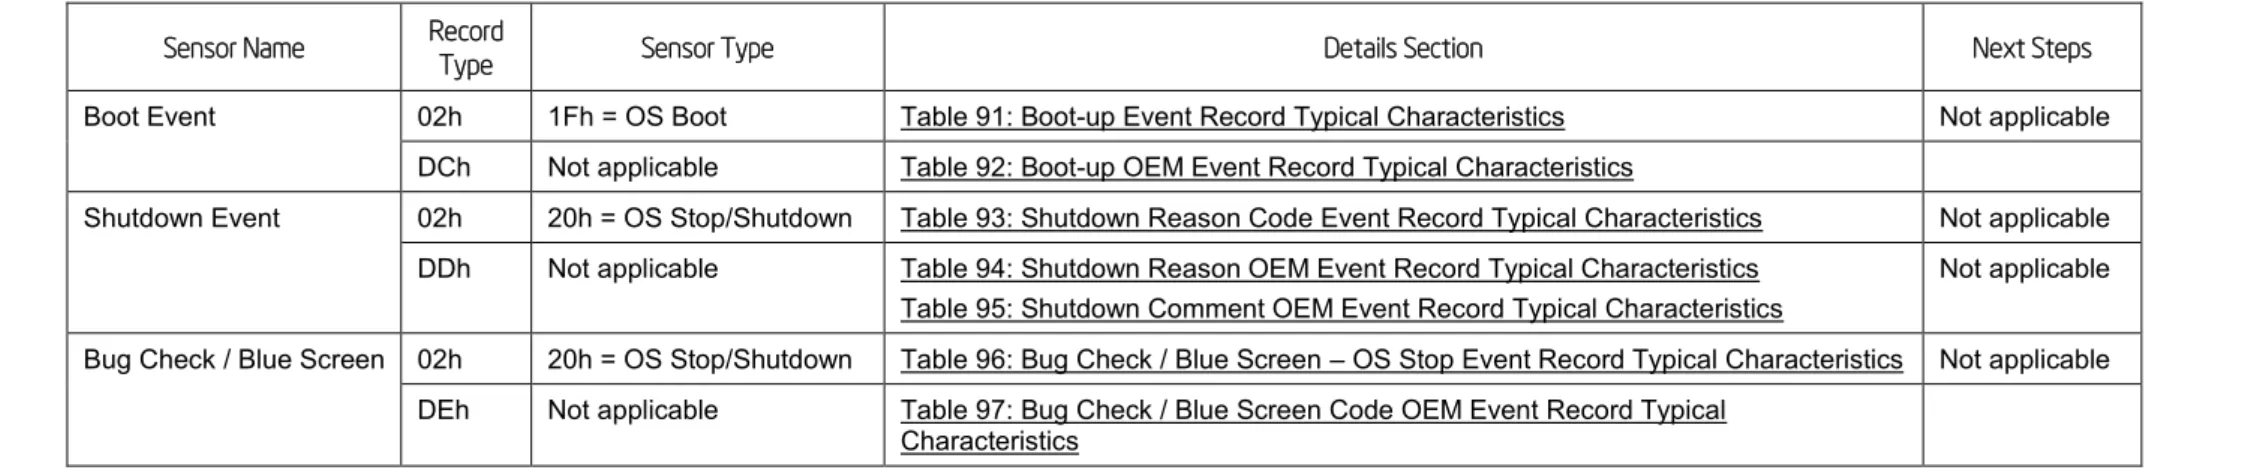
Microsoft* OS owned Events (GID = 0041)
The following table can be used to find the details of records that are owned by the Microsoft* Operating System (OS).
Table 10: Microsoft* OS owned Events
Sensor Name Record Type Sensor Type Details Section Next Steps
Boot Event 02h 1Fh = OS Boot Table 91: Boot-up Event Record Typical Characteristics Not applicable DCh Not applicable Table 92: Boot-up OEM Event Record Typical Characteristics
Shutdown Event 02h 20h = OS Stop/Shutdown Table 93: Shutdown Reason Code Event Record Typical Characteristics Not applicable DDh Not applicable Table 94: Shutdown Reason OEM Event Record Typical Characteristics
Table 95: Shutdown Comment OEM Event Record Typical Characteristics
Not applicable Bug Check / Blue Screen 02h 20h = OS Stop/Shutdown Table 96: Bug Check / Blue Screen – OS Stop Event Record Typical Characteristics Not applicable
DEh Not applicable Table 97: Bug Check / Blue Screen Code OEM Event Record Typical Characteristics
3.7
Linux* Kernel Panic Events (GID = 0021)
The following table can be used to find the details of records that can be generated when there is a Linux* Kernel panic.
Table 11: Linux* Kernel Panic Events
Sensor Name Record Type Sensor Type Details Section Next Steps
Linux* Kernel Panic 02h 20h = OS Stop/Shutdown Table 98: Linux* Kernel Panic Event Record Characteristics Not applicable F0h Not applicable Table 99: Linux* Kernel Panic String Extended Record Characteristics
4.
Power Subsystems
The BMC monitors the power subsystem including power supplies, select onboard voltages, and related sensors.
4.1
Voltage Sensors
The BMC monitors the main voltage sources in the system, including the baseboard, memory, and processors, using IPMI-compliant
analog/threshold sensors.
Note
: A voltage error could be caused by the device supplying the voltage or by the device using the voltage. For each sensor it will be noted
who is supplying the voltage and who is using it.
Table 12: Voltage Sensors Typical Characteristics
Byte Field Description
11 Sensor Type 02h = Voltage 12 Sensor Number See Table 14 13 Event Direction and
Event Type [7] Event direction 0b = Assertion Event 1b = Deassertion Event [6:0] Event Type = 01h (Threshold)
14 Event Data 1 [7:6] – 01b = Trigger reading in Event Data 2 [5:4] – 01b = Trigger threshold in Event Data 3 [3:0] – Event Triggers as described in Table 13 15 Event Data 2 Reading that triggered event
16 Event Data 3 Threshold value that triggered event
Table 13: Voltage Sensors Event Triggers – Description
Event Trigger Assertion
Severity Deassert Severity Description Hex Description
00h Lower non-critical
going low Degraded OK The voltage has dropped below its lower non-critical threshold. 02h Lower critical
going low non-fatal Degraded The voltage has dropped below its lower critical threshold. 07h Upper non-critical
going high Degraded OK The voltage has gone over its upper non-critical threshold. 09h Upper critical
going high
non-fatal Degraded The voltage has gone over its upper critical threshold.
Table 14: Voltage Sensors – Next Steps
Sensor
Number Sensor Name Next Steps
10h BB +1.1V IOH This 1.1V line is supplied by the main board. This 1.1V line is used by the I/O hub (IOH)
1. Ensure all cables are connected correctly. 2. If the issue remains, replace the motherboard. 11h BB +1.1V P1 Vccp This 1.1V line is supplied by the main board.
This 1.1V line is used by processor 1.
1. Ensure all cables are connected correctly.
2. Cross test the processor if possible. If the issue remains with the socket, replace the main board, otherwise the processor. 12h BB +1.1V P2 Vccp This 1.1V line is supplied by the main board.
This 1.1V line is used by processor 2.
1. Ensure all cables are connected correctly.
Sensor
Number Sensor Name Next Steps
13h BB +1.5V P1 DDR3 This 1.5V line is supplied by the main board.
This 1.5V line is used by the memory on processor 1. 1. Ensure all cables are connected correctly. 2. Check the DIMMs are seated properly.
3. Cross test the DIMMs. If the issue remains with the DIMMs on this socket, replace the main board, otherwise replace the DIMM.
14h BB +1.5V P2 DDR3 This 1.5V line is supplied by the main board.
This 1.5V line is used by the memory on processor 2. 1. Ensure all cables are connected correctly. 2. Check the DIMMs are seated properly.
3. Cross test the DIMMs. If the issue remains with the DIMMs on this socket, replace the main board, otherwise replace the DIMM.
15h BB +1.8V AUX +1.8V is supplied by the main board.
+1.8V is used by the onboard NIC and I/O hub. 1. Ensure all cables are connected correctly. 2. If the issue remains, replace the main board. 16h BB +3.3V +3.3V is supplied by the power supplies.
+3.3V is used by the PCIe and PCI-X slots. 1. Ensure all cables are connected correctly. 2. Reseat any PCI cards, and try them in other slots.
3. If the issue follows the card, swap it, otherwise, replace the main board. 4. If the issue remains, replace the power supplies.
17h BB +3.3V STBY +3.3V Stby is supplied by the main board.
+3.3V Stby is used by the BMC, Onboard NIC, IOH, and ICH. 1. Ensure all cables are connected correctly.
2. If the issue remains, replace the board.
Sensor
Number Sensor Name Next Steps
18h BB +3.3V Vbat +3.3V Vbat is supplied by the CMOS battery when power is off and by the main board when power is on. +3.3V Vbat is used by the CMOS and related circuits.
1. Replace the CMOS battery. Any battery of type CR2032 can be used. 2. If error remains (unlikely), replace the board.
19h BB +5.0V +5.0V is supplied by the power supplies. +5.0V is used by the PCI slots.
1. Ensure all cables are connected correctly. 2. Reseat any PCI cards, and try them in other slots.
3. If the issue follows the card, swap it, otherwise, replace the main board. 4. If the issue remains, replace the power supplies.
1Ah BB +5.0V STBY +5.0V STBY is supplied by the power supplies.
+5.0V STBY is used to generate other standby voltages. 1. Ensure all cables are connected correctly. 2. If the issue remains, replace the board.
3. If the issue remains, replace the power supplies. 1Bh BB +12.0V +12V is supplied by the power supplies.
+12V is used by SATA drives, Fans, and PCI cards. In addition it is used to generate various processor voltages. 1. Ensure all cables are connected correctly.
2. Check connections on fans and HDDs.
3. If the issue follows the component, swap it, otherwise, replace the board. 4. If the issue remains, replace the power supplies.
1Ch BB -12.0V -12V is supplied by the power supplies.
-12V is used by the serial port and by PCI cards. In addition it is used to generate various processor voltages. 1. Ensure all cables are connected correctly.
2. Reseat any PCI cards, and try them in other slots.
3. If the issue follows the card, swap it, otherwise, replace the main board. 4. If the issue remains, replace the power supplies.
Sensor
Number Sensor Name Next Steps
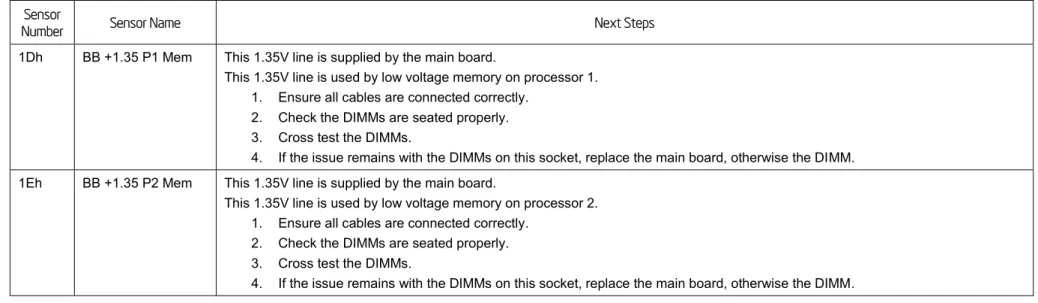
1Dh BB +1.35 P1 Mem This 1.35V line is supplied by the main board.
This 1.35V line is used by low voltage memory on processor 1. 1. Ensure all cables are connected correctly.
2. Check the DIMMs are seated properly. 3. Cross test the DIMMs.
4. If the issue remains with the DIMMs on this socket, replace the main board, otherwise the DIMM. 1Eh BB +1.35 P2 Mem This 1.35V line is supplied by the main board.
This 1.35V line is used by low voltage memory on processor 2. 1. Ensure all cables are connected correctly.
2. Check the DIMMs are seated properly. 3. Cross test the DIMMs.
4. If the issue remains with the DIMMs on this socket, replace the main board, otherwise the DIMM.
4.2
Power Unit
The power unit monitors the power state of the system and logs the state changes in the SEL.
4.2.1
Power Unit Status Sensor
The power unit status sensor monitors the power state of the system and logs state changes. Expected power-on events such as DC ON/OFF
are logged and unexpected events are also logged, such as AC loss and power good loss.
Table 15: Power Unit Status Sensors Typical Characteristics
Byte Field Description
11 Sensor Type 09h = Power Unit 12 Sensor Number 01h
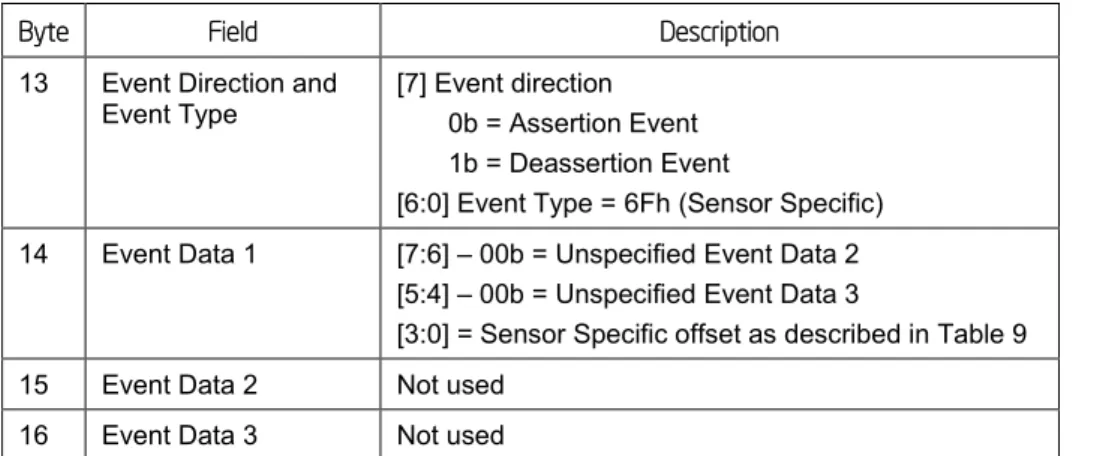
Byte Field Description
13 Event Direction and Event Type
[7] Event direction 0b = Assertion Event 1b = Deassertion Event
[6:0] Event Type = 6Fh (Sensor Specific) 14 Event Data 1 [7:6] – 00b = Unspecified Event Data 2
[5:4] – 00b = Unspecified Event Data 3
[3:0] = Sensor Specific offset as described in Table 9 15 Event Data 2 Not used
16 Event Data 3 Not used
Table 16: Power Unit Status Sensor – Sensor Specific Offsets – Next Steps
Sensor Specific Offset
Description Next Steps
Hex Description
00h Power down System is powered down. Informational Event 04h AC Lost AC removed. Informational Event 05h Soft Power Control
Failure
Generally means power good was lost in the system, causing a shutdown.
This could be caused by the power supply subsystem or system components.
1. Verify all power cables and adapters are connected properly (AC cables as well as the cables between the PSU and system components).
2. Cross test the PSU if possible. 3. Replace the power subsystem. 06h Power Unit Failure Power subsystem experienced a
failure.
Indicates a power supply failed.
1. Remove and reapply AC power. 2. If the power supply still fails, replace it.
4.2.2
Power Unit Redundancy Sensor
This sensor is enabled on systems that support redundant power supplies. When a system has AC applied or if it loses redundancy of the
power supplies a message will get logged into the SEL.
Table 17: Power Unit Redundancy Sensors Typical Characteristics
Byte Field Description
11 Sensor Type 09h = Power Unit 12 Sensor Number 02h
13 Event Direction and
Event Type [7] Event direction 0b = Assertion Event 1b = Deassertion Event
[6:0] Event Type = 0Bh (Generic Discrete) 14 Event Data 1 [7:6] – 00b = Unspecified Event Data 2
[5:4] – 00b = Unspecified Event Data 3
[3:0] – Event Trigger Offset as described in Table 18 15 Event Data 2 Not used
16 Event Data 3 Not used
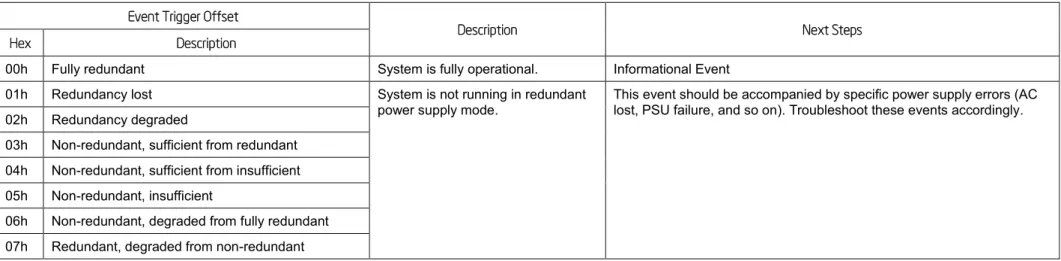
Table 18: Power Unit Redundancy Sensor – Event Trigger Offset – Next Steps
Event Trigger Offset
Description Next Steps Hex Description
00h Fully redundant System is fully operational. Informational Event 01h Redundancy lost System is not running in redundant
power supply mode.
This event should be accompanied by specific power supply errors (AC lost, PSU failure, and so on). Troubleshoot these events accordingly. 02h Redundancy degraded
03h Non-redundant, sufficient from redundant 04h Non-redundant, sufficient from insufficient 05h Non-redundant, insufficient
06h Non-redundant, degraded from fully redundant 07h Redundant, degraded from non-redundant
4.3
Power Supply
The BMC monitors the power supply subsystem.
4.3.1
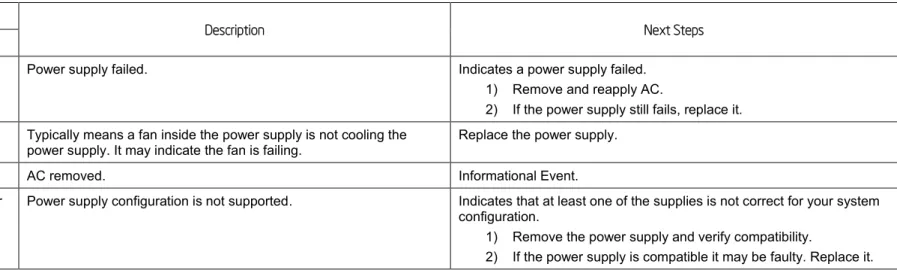
Power Supply Status Sensors
These sensors report the status of the power supplies in the system. When a system first AC applied or removed it can log an event. Also if
there is a failure, predictive failure, or a configuration error it can log an event.
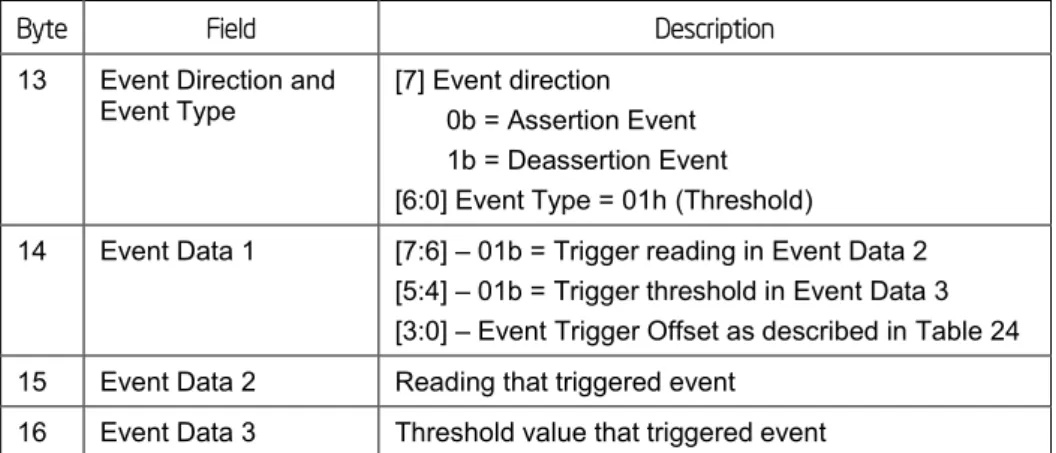
Table 19: Power Supply Status Sensors Typical Characteristics
Byte Field Description
11 Sensor Type 08h = Power Supply
12 Sensor Number 50h = Power Supply 1 Status 51h = Power Supply 2 Status 13 Event Direction and
Event Type [7] Event direction 0b = Assertion Event 1b = Deassertion Event
[6:0] Event Type = 6Fh (Sensor Specific) 14 Event Data 1 [7:6] – 00b = Unspecified Event Data 2
[5:4] – 00b = Unspecified Event Data 3
[3:0] = Sensor Specific offset as described in Table 20 15 Event Data 2 Not used
16 Event Data 3 Not used
Table 20: Power Supply Status Sensor – Sensor Specific Offsets – Next Steps
Sensor Specific Offset
Description Next Steps
Hex Description
Sensor Specific Offset
Description Next Steps
Hex Description
01h Failure Power supply failed. Indicates a power supply failed. 1) Remove and reapply AC.
2) If the power supply still fails, replace it. 02h Predictive Failure Typically means a fan inside the power supply is not cooling the
power supply. It may indicate the fan is failing.
Replace the power supply.
03h AC lost AC removed. Informational Event.
06h Configuration error Power supply configuration is not supported. Indicates that at least one of the supplies is not correct for your system configuration.
1) Remove the power supply and verify compatibility.
2) If the power supply is compatible it may be faulty. Replace it.
4.3.2
Power Supply AC Power Input Sensors
These sensors will log an event when a power supply in the system is exceeding its AC power in threshold.
Table 21: Power Supply AC Power Input Sensors Typical Characteristics
Byte Field Description
11 Sensor Type 0Bh = Other Units
12 Sensor Number 52h = Power Supply 1 AC Power Input 53h = Power Supply 2 AC Power Input 13 Event Direction and
Event Type
[7] Event direction 0b = Assertion Event 1b = Deassertion Event [6:0] Event Type = 01h (Threshold)
14 Event Data 1 [7:6] – 01b = Trigger reading in Event Data 2 [5:4] – 01b = Trigger threshold in Event Data 3
Byte Field Description
15 Event Data 2 Reading that triggered event 16 Event Data 3 Threshold value that triggered event
The following table describes the severity of each of the event triggers for both assertion and deassertion.
Table 22: Power Supply AC Power Input Sensor – Event Trigger Offset – Next Steps
Event Trigger Offset Assertion
Severity Deassert Severity Description Next Steps Hex Description
07h Upper non-critical going high
Degraded OK PMBus* feature to monitor power supply power consumption.
If you see this event, the system is pulling too much power on the input for the PSU rating.
1. Verify the power budget is within the specified range.
2. Check http://www.intel.com/p/en_US/support/ for the power budget tool for your system.
09h Upper critical going high
non-fatal Degraded
4.3.3
Power Supply Current Output % Sensors
PMBus*-compliant power supplies may monitor the current output of the main 12v voltage rail and report the current usage as a percentage of
the maximum power output for that rail.
Table 23: Power Supply Current Output % Sensors Typical Characteristics
Byte Field Description
11 Sensor Type 03h = Current
12 Sensor Number 54h = Power Supply 1 Current Output % 55h = Power Supply 2 Current Output %
Byte Field Description
13 Event Direction and Event Type
[7] Event direction 0b = Assertion Event 1b = Deassertion Event [6:0] Event Type = 01h (Threshold)
14 Event Data 1 [7:6] – 01b = Trigger reading in Event Data 2 [5:4] – 01b = Trigger threshold in Event Data 3 [3:0] – Event Trigger Offset as described in Table 24 15 Event Data 2 Reading that triggered event
16 Event Data 3 Threshold value that triggered event
The following table describes the severity of each of the event triggers for both assertion and deassertion.
Table 24: Power Supply Current Output % Sensor – Event Trigger Offset – Next Steps
Event Trigger Offset Assertion
Severity Deassert Severity Description Next Steps Hex Description
07h Upper non-critical
going high Degraded OK PMBus* feature to monitor power supply power consumption. If you see this event, the system is using too much power on the output for the PSU rating. 1. Verify the power budget is within the specified range.
2. Check http://www.intel.com/p/en_US/support/ for the power budget tool for your system.
09h Upper critical going high
non-fatal Degraded
4.3.4
Power Supply Temperature Sensors
Table 25: Power Supply Temperature Sensors Typical Characteristics
Byte Field Description
11 Sensor Type 01h = Temperature
12 Sensor Number 56h = Power Supply 1 Temperature 57h = Power Supply 2 Temperature 13 Event Direction and
Event Type [7] Event direction 0b = Assertion Event 1b = Deassertion Event [6:0] Event Type = 01h (Threshold)
14 Event Data 1 [7:6] – 01b = Trigger reading in Event Data 2 [5:4] – 01b = Trigger threshold in Event Data 3 [3:0] – Event Trigger Offset as described in Table 26 15 Event Data 2 Reading that triggered event
16 Event Data 3 Threshold value that triggered event
The following table describes the severity of each of the event triggers for both assertion and deassertion.
Table 26: Power Supply Temperature Sensor – Event Trigger Offset – Next Steps
Event Trigger Offset Assertion
Severity Deassert Severity Description Next Steps Hex Description
07h Upper non-critical going high
Degraded OK An upper non-critical or critical temperature threshold has been crossed.
1. Check for clear and unobstructed airflow into and out of the chassis. 2. Ensure the SDR is programmed and correct chassis has been selected. 3. Ensure there are no fan failures.
4. Ensure the air used to cool the system is within the thermal specifications for the system (typically below 35°C).
09h Upper critical going high
5.
Cooling Subsystem
5.1
Fan Sensors
There are three types of fan sensors that can be present on Intel
®Server Systems: speed, presence, and redundancy. The last two are only
present in systems with hot-swap redundant fans.
5.1.1
Fan Speed Sensors
Fan speed sensors monitor the rpm signal on the relevant fan headers on the platform. Fan speed sensors are threshold-based sensors.
Usually they only have lower (critical) thresholds set, so that a SEL entry is only generated if the fan spins too slowly.
Table 27: Fan Speed Sensors Typical Characteristics
Byte Field Description
11 Sensor Type 04h = Fan
12 Sensor Number 30h-39h (Chassis specific) 13 Event Direction and
Event Type
[7] Event direction 0b = Assertion Event 1b = Deassertion Event [6:0] Event Type = 01h (Threshold)
14 Event Data 1 [7:6] – 01b = Trigger reading in Event Data 2 [5:4] – 01b = Trigger threshold in Event Data 3 [3:0] – Event Trigger Offset as described in Table 28 15 Event Data 2 Reading that triggered event
16 Event Data 3 Threshold value that triggered event
Table 28: Fan Speed Sensor – Event Trigger Offset – Next Steps
Event Trigger Offset Assertion
Severity Deassert Severity Description Next Steps Hex Description
00h Lower non-critical
going low Degraded OK The fan speed has dropped below its lower non-critical threshold. A fan speed error on a new system build is typically not caused by the fan spinning too slowly, instead it is caused by the fan being connected to the wrong header (the BMC expects them on certain headers for each chassis and will log this event if there is no fan on that header).
1. Refer to the Quick Start Guide or the Service Guide to identify the correct fan headers to use.
2. Ensure the latest FRUSDR update has been run and the correct chassis was detected or selected.
3. If you are sure this was done, the event may be a sign of impending fan failure (although this will only normally apply if the system has been in use for a while). Replace the fan.
02h Lower critical
going low non-fatal Degraded The fan speed has dropped below its lower critical threshold.
5.1.2
Fan Presence and Redundancy Sensors
Fan presence sensors are only implemented for hot-swap fans, and require an additional pin on the fan header. Fan redundancy is an
aggregate of the fan presence sensors and will warn when redundancy is lost. Typically the redundancy mode on Intel
®servers is an n+1
redundancy (if one fan fails there are still sufficient fans to cool the system, but it is no longer redundant) although other modes are also
possible.
Table 29: Fan Presence Sensors Typical Characteristics
Byte Field Description
11 Sensor Type 04h = Fan
12 Sensor Number 40h-45h (Chassis specific) 13 Event Direction and
Event Type [7] Event direction 0b = Assertion Event 1b = Deassertion Event
Byte Field Description
14 Event Data 1 [7:6] – 00b = Unspecified Event Data 2 [5:4] – 00b = Unspecified Event Data 3
[3:0] – Event Trigger Offset as described in Table 30 15 Event Data 2 Not used
16 Event Data 3 Not used
The following table describes the severity of each of the event triggers for both assertion and deassertion.
Table 30: Fan Presence Sensors – Event Trigger Offset – Next Steps
Event Trigger Offset Assertion
Severity Deassert Severity Description Next Steps Hex Description
01h Device Present
OK Degraded Assertion – A fan was inserted. This event may also get logged when the BMC initializes when AC is applied.
Informational only
Deassert – A fan was removed, or was not present at the expected location when the BMC initialized.
These events only get generated in systems with hot-swappable fans, and normally only when a fan is physically inserted or removed. If fans were not physically removed:
1. Use the Quick Start Guide to check whether the right fan headers were used. 2. Swap the fans round to see whether the problem stays with the location, or
follows the fan.
3. Replace the fan or fan wiring/housing depending on the outcome of step 2. 4. Ensure the latest FRUSDR update has been run and the correct chassis was
detected or selected.
Table 31: Fan Redundancy Sensors Typical Characteristics
Byte Field Description
11 Sensor Type 04h = Fan 12 Sensor Number 46h
Byte Field Description
13 Event Direction and Event Type
[7] Event direction 0b = Assertion Event 1b = Deassertion Event
[6:0] Event Type = 0Bh (Generic Discrete) 14 Event Data 1 [7:6] – 00b = Unspecified Event Data 2
[5:4] – 00b = Unspecified Event Data 3
[3:0] – Event Trigger Offset as described in Table 32 15 Event Data 2 Not used
16 Event Data 3 Not used
The following table describes the severity of each of the event triggers for both assertion and deassertion.
Table 32: Fan Redundancy Sensor – Event Trigger Offset – Next Steps
Event Trigger Offset
Description Next Steps Hex Description
00h Fully redundant System has lost one or more fans and is running in non-redundant mode. There are enough fans to keep the system properly cooled, but fan speeds will boost.
Fan redundancy loss indicates failure of one or more fans.
Look for lower (non) critical fan errors, or fan removal errors in the SEL, to indicate which fan is causing the problem, and follow the troubleshooting steps for these event types.
01h Redundancy lost 02h Redundancy degraded
03h Non-redundant, sufficient from redundant 04h Non-redundant, sufficient from insufficient
05h Non-redundant, insufficient System has lost fans and may no longer be able to cool itself adequately. Overheating may occur if this situation remains for a longer period of time.
06h Non-redundant, degraded from fully redundant
System has lost one or more fans and is running in non-redundant mode. There are enough fans to keep the system properly cooled, but fan speeds will boost.
07h Redundant, degraded from non-redundant System has lost one or more fans and is running in a degraded mode, but still is redundant. There are enough fans to keep the system properly cooled.