Nursing Data Review
Academic Year 2005-2006
Baccalaureate, Associate Degree, and Diploma Programs
National League for Nursing
61 Broadway
National League for Nursing 61 Broadway
New York, NY 10006 212-363-5555
www.nln.org
Copyright © 2008 by the National League for Nursing
All rights reserved. No part of the material protected by this copyright notice may be reproduced or utilized in any form, electronic or mechanical, including photocopying, recording, or by any other information storage or retrieval system, without written permission from the copyright owner. ISBN: 0-9779557-8-8
iii
ACKNOWLEDGEMENTS
The National League for Nursing wishes to acknowledge the following key individuals and groups for their assistance in bringing this report to fruition. First and foremost, the NLN appreciates the survey responses provided by literally thousands of nursing school deans, directors, chairpersons, program administrators, and their hardworking staff members, without whom this valuable data source could not have been created.
We are also extremely grateful to Susan K. Fairchild, who not only performed the computational gymnastics required to generate the working data files, graphs, and tables used in this report, but also provided considerable methodological expertise and collegial support at key moments in the re-search process.
Finally, we would like to acknowledge the following members of the NLN staff: Adefunke Faly, research associate, who conscientiously organized and composed these book pages, and Mario Espaillat, general services coordinator, for handling its production.
PREFACE
The National League for Nursing is currently the only organization in the United States that collects comprehensive nursing education statistics from all types of programs that prepare students for li-censure as registered nurses. The NLN’s most recent effort to date, Nursing Data Review, Academic Year 2005-2006, draws on the NLN’s annual survey of schools of nursing as well as previously pub-lished data book volumes to provide a contemporary overview of the 1,694 prelicensure registered nursing programs across the United States. To this end, this volume provides long-term trend data on schools, applications, admissions, enrollments, and graduations.
The National League for Nursing’s public policy research program is fully independent of NLN membership and NLNAC accreditation activities in an effort to provide accurate information on all US nursing programs. Thus, nursing programs are represented in Nursing Data Review irrespective of their membership and accreditation status.
Nursing Data Review will be invaluable to decision-makers, organizations, and individuals interested in data reflecting the state of nursing education. Moreover, it will serve a critical role in models de-signed to project the magnitude of the future registered nurse workforce and help address the nurs-ing shortage.
v
TABLE OF CONTENTS
Acknowledgements ... iii
Preface ... iv
Jurisdictions Included in the US Regions... viii
Executive Summary ... 1
Figures... 5
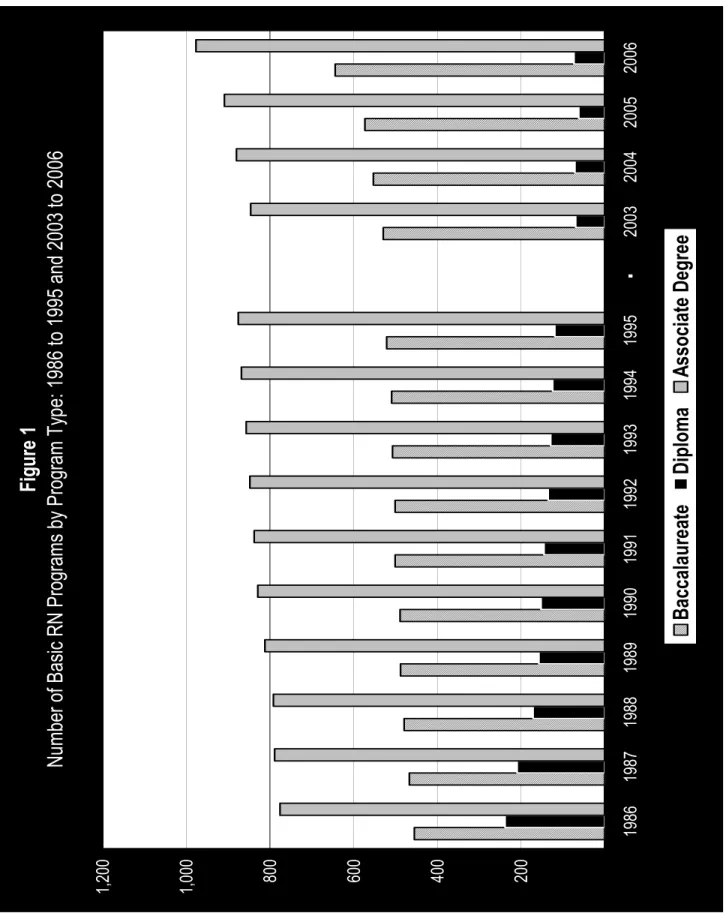
Figure 1. Number of Basic RN Programs by Program Type: 1986 to 1995 and 2003 to 2006... 6
Figure 2. Percentage of Basic RN Programs by Program Type: 1986 to 1995 and 2003 to 2006 ... 7
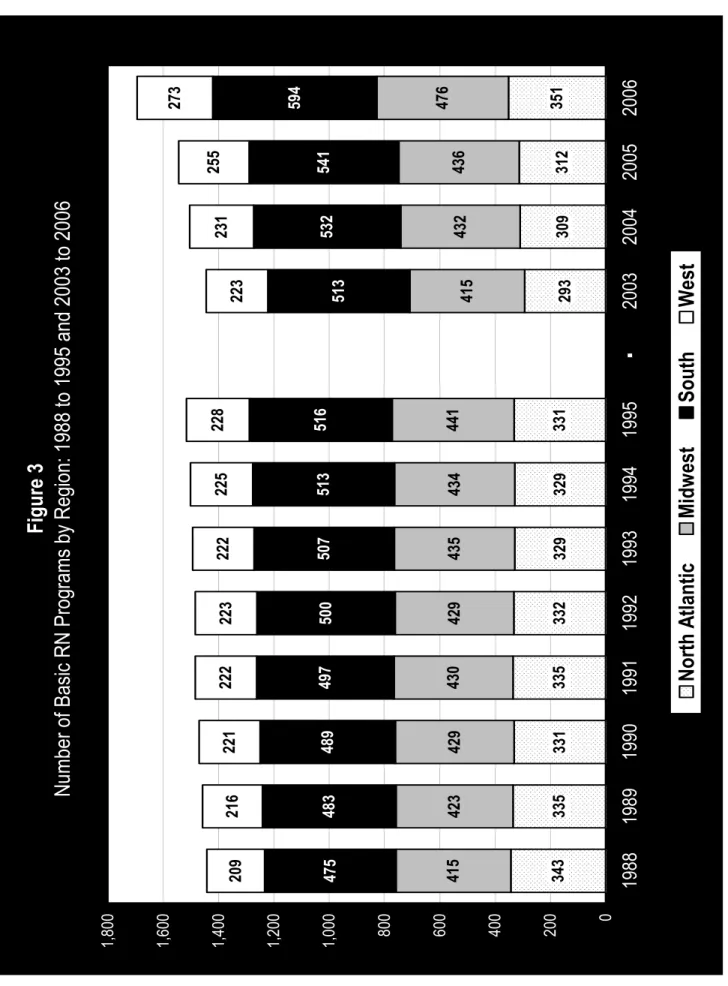
Figure 3. Number of Basic RN Programs by Region: 1988 to 1995 and 2003 to 2006... 8
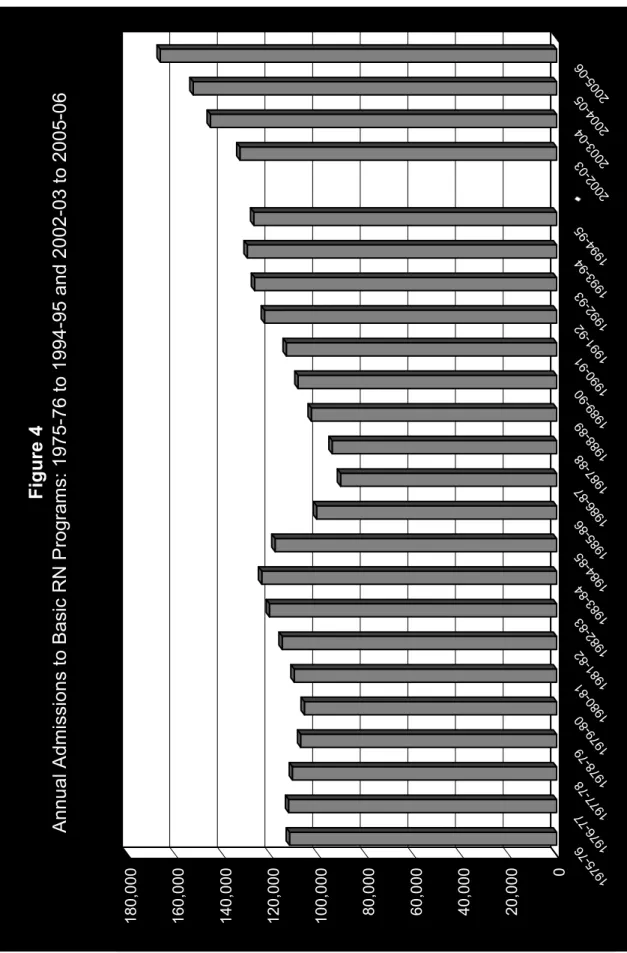
Figure 4. Annual Admissions to Basic RN Programs: 1975-76 to 1994-95 and 2002-03 to 2005-06... 9
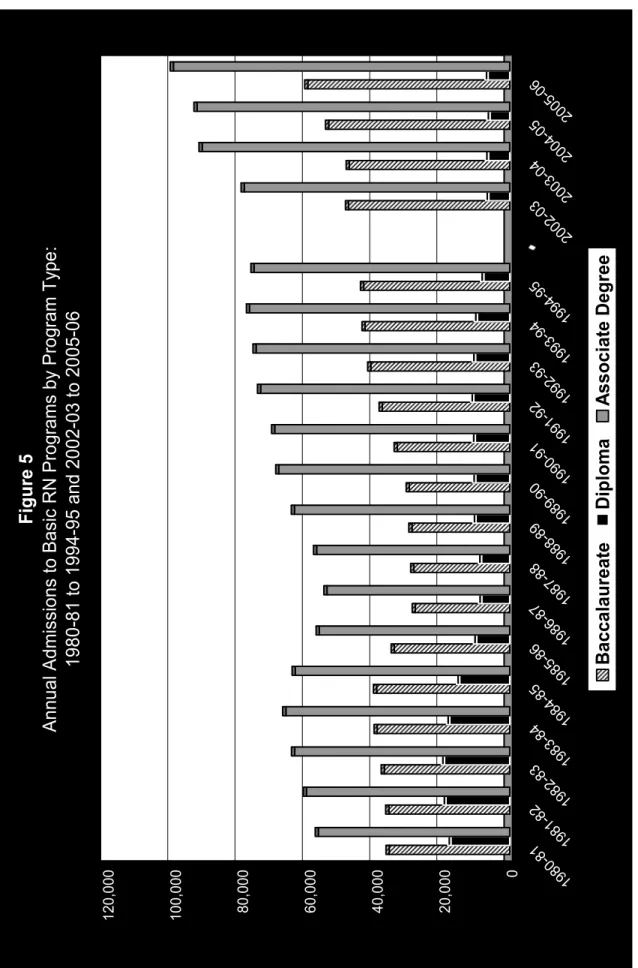
Figure 5. Annual Admissions to Basic RN Programs by Program Type: 1980-81 to 1994-95 and 2002-03 to 2005-06 ... 10
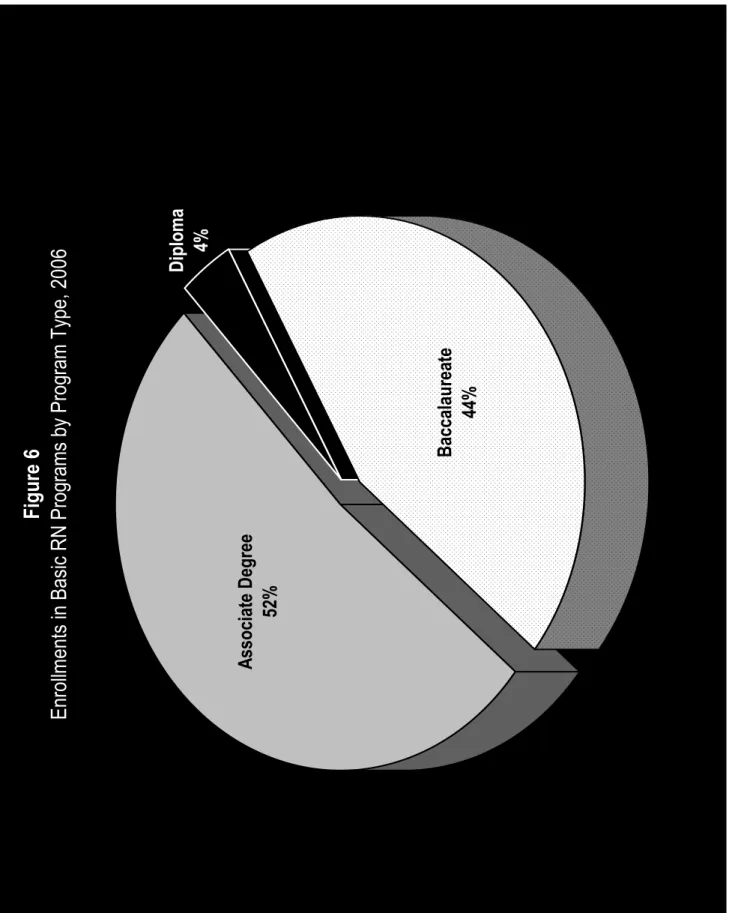
Figure 6. Enrollments in Basic RN Programs by Program Type, 2006 ... 11
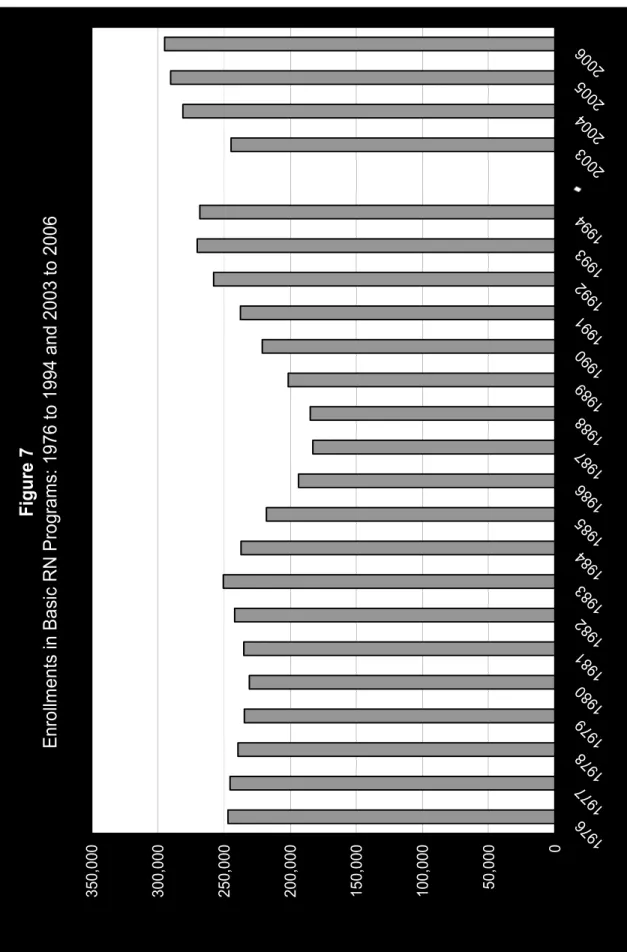
Figure 7. Enrollments in Basic RN Programs: 1976 to 1994 and 2003 to 2006... 12
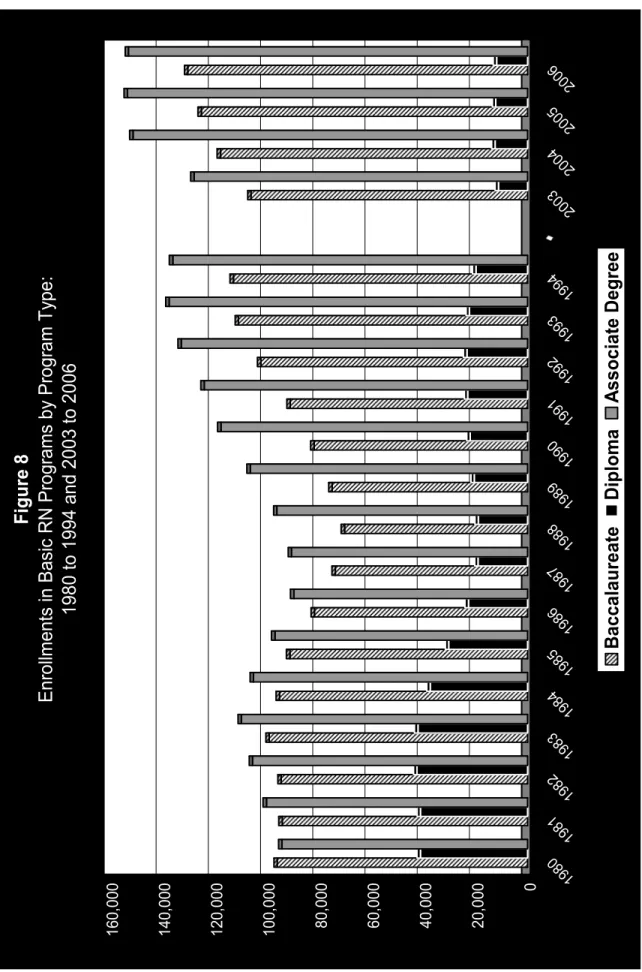
Figure 8. Enrollments in Basic RN Programs by Program Type: 1980 to 1994 and 2003 to 2006 ... 13
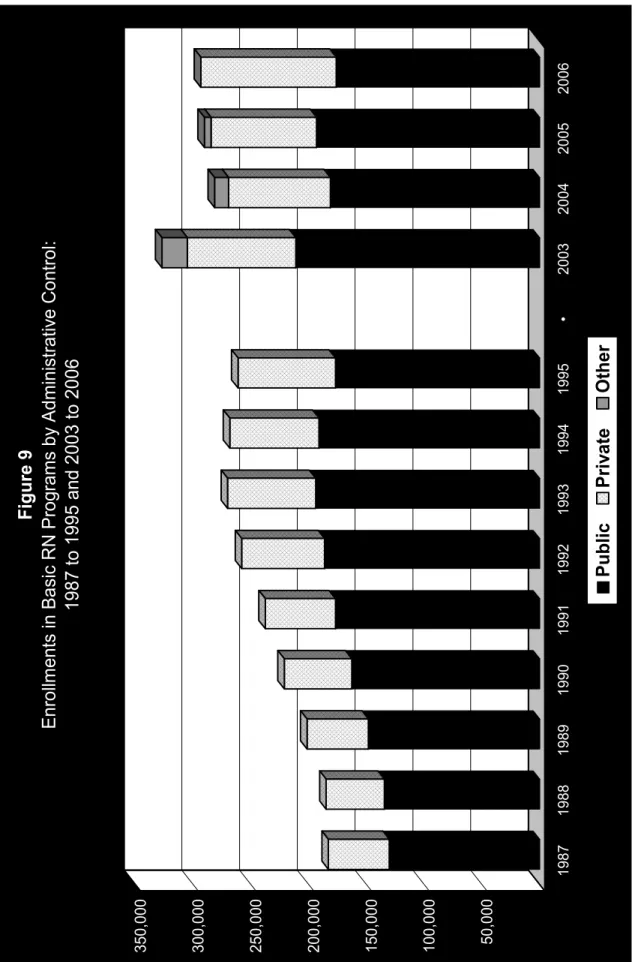
Figure 9. Enrollments in Basic RN Programs by Administrative Control: 1987 to 1995 and 2003 to 2006... 14
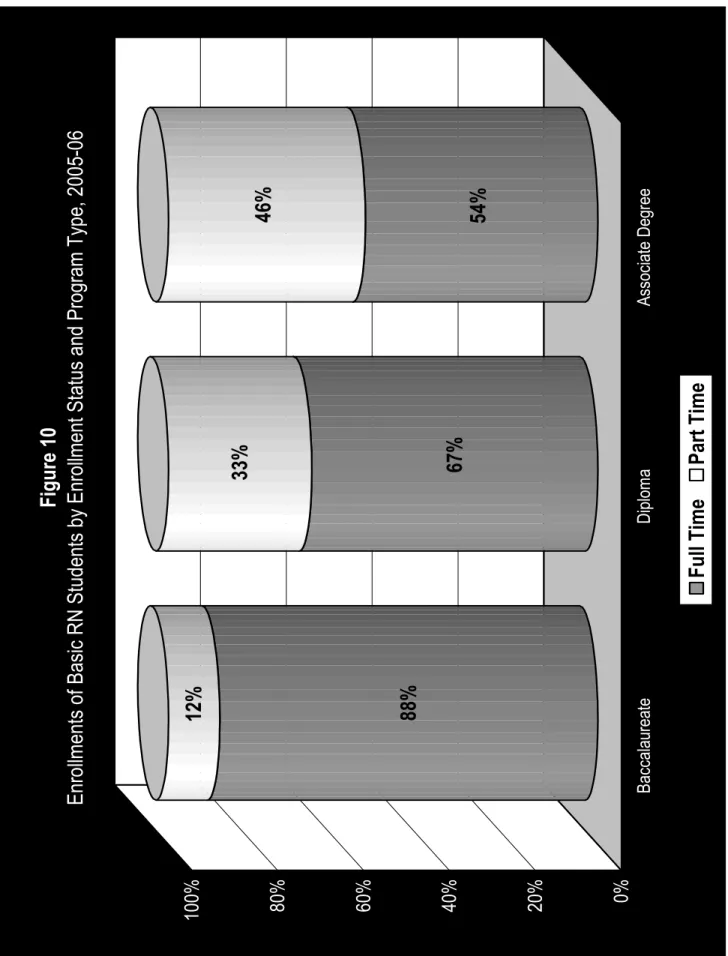
Figure 10. Enrollments of Basic RN Students by Enrollment Status and Program Type, 2005-06...15
Figure 11. Percentage of Basic RN Students Enrolled Part Time by Program Type, 2003, 2005, and 2006... 16
Figure 12. Graduations from Basic RN Programs: 1985-86 to 1994-95 and 2002-03 to 2005-06 ... 17
Figure 13. Graduations from Basic RN Programs by Program Type, 1984-85 to 1994-95 and 2002-03 to 2005-06... 18
Figure 14. Graduations from Prelicensure RN Programs by Program Type, 2005-2006... 19
Figure 15. Baccalaureate Programs as a Percentage of All Basic RN Programs and Baccalaureate Graduations as a Percentage of All Basic RN Graduations:
1986-87 to 1994-95 and 2002-03 to 2005-06... 20 Figure 16. Diploma Programs as a Percentage of All Basic RN Programs and
Diploma Graduations as a Percentage of All Basic RN Graduations:
1986-87 to 1994-95 and 2002-03 to 2005-06... 21 Figure 17. Associate Degree Programs as a Percentage of All Basic RN Programs
and Associate Degree Graduations as a Percentage of All Basic RN
Graduations: 1986-87 to 1994-95 and 2002-03 to 2005-06... 22 Figure 18. Number of Applications Submitted to Basic RN Programs: 1974 to 1982,
1991 to 1995, and 2003 to 2006... 23 Figure 19. Disposition of Applications to Basic RN Programs, 2005-06 ... 24 Figure 20. Disposition of Applications to Basic RN Programs by Program Type,
2005-06... 25 Figure 21. Selectivity Level of Basic RN Programs by Program Type, 2005-06... 26 Figure 22. Average Yield Rate of Basic RN Programs and Number of Applications
Submitted: 1980 to 1982, 1991 to 1995, and 2003-2006... 27 Figure 23. One Year Retention Status of Full Time Nursing Students and Full Time
US Undergraduates by Program/Institution Type ... 28 Figure 24. Graduations of Men from Basic RN Programs: 1988 to 1989, 1991 to
1995, and 2003 to 2006... 29 Figure 25. Percentage of Minorities Graduating from Basic RN Programs: 1989-90
to 1994-95 and 2002-03 to 2005-06 ... 30 Figure 26. Percentage of Minorities Graduating from Basic RN Programs by
Race-Ethnicity: 1989-90 to 1994-95 and 2002-03 to 2005-06... 31 Figure 27. Graduations from Basic RN Program by Age Category and Program
Type, 2005-06...32 Figure 28. Percentage of Prelicensure RN Graduates over Age 30, 2005-06... 33
Tables ... 34 Table 1. Basic RN Programs and Percentage Change from Previous Years by Type
of Program: 1980 to 1995 and 2002 to 2006 ... 35 Table 2. Annual Admissions to Basic RN Programs and Percentage Change from
Previous Year by Program Type: 1984-85 to 1994-95 and 2002-03 to
2005-06 ... 36 Table 3. Enrollments in Basic RN Programs and Percentage Change from
vii Table 4. Graduations from Basic RN Programs and Percentage Change from
Previous Year by Program Type: 1984-85 to 1994-95 and 2001-02 to
2005-06... 38 Table 5. Percentage of Applications for Admission Accepted, Not Accepted, and
Waitlisted by Program Type, 2006 ... 39 Table 6. Graduations of Minority Students from Basic RN Programs by Program
Type: 1990-91 to 1994-95 and 2002-03 to 2005-06... 40 Table 7. Graduations of Men from Basic RN Programs by Program Type: 1986 to
2006 (selected years) ... 41 Table 8. Graduations of Men from Basic RN Programs by Program Type and
Region, 2006 ... 42
JURISDICTIONS INCLUDED IN THE US REGIONS
North Atlantic
Midwest
South
West
Connecticut Illinois Alabama Alaska Delaware Indiana Arkansas Arizona
District of Columbia Iowa Florida California
Maine Kansas Georgia Colorado
Massachusetts Michigan Kentucky Hawaii
New Hampshire Minnesota Louisiana Idaho
New Jersey Missouri Maryland Montana
New York Nebraska Mississippi Nevada
Pennsylvania North Dakota North Carolina New Mexico
Rhode Island Ohio Oklahoma Oregon
Vermont South Dakota South Carolina Utah
Wisconsin Tennessee Washington
Texas Wyoming
Virginia
1
Applications to Basic RN Programs, 2005-06
Rejected, 30% Rejected, 16% Waitlisted, 12% Accepted, 42% Qualified Not Qualified
EXECUTIVE SUMMARY
As Applications Fall Off
“Applicant Discouragement” Is Suspected Cause
Applications, Institutional Selectivity, and Yield Rates. Applications to all types of prelicensure RN programs dropped by 8.7 percent between 2005 and 2006. In 2005, total applications peaked at more than 347,000 in contrast to slightly fewer than 317,000 applications in 2006. Diploma programs experienced the greatest loss, more than 13 percent. For baccalaureate programs the loss was similar. Applications were down by 12.4 percent, from almost 114,000 in 2005 to less than 100,000 in 2006. Associate degree programs had notable but smaller reductions in applications, from 217,000 in 2005 to 203,000 in 2006, a decrease of 6.4 percent.
Unmet Demand for Placement in Programs Persists
Despite the reduced number of applications, many factors indicate that opportunities to obtain a nursing education are still in short supply. Eighty-eight thousand (88,000) qualified applications — or one out of every three qualified applications submitted to nursing education programs this year — were turned away due to lack of capacity. Moreover, the level of selectivity of prelicensure nursing programs, while down from last year’s peak, continues to dramatically exceed that of US undergraduate programs nationwide.
Selectivity. The most commonly used measure of demand in higher education is the “selectivity rate” — also known as the acceptance rate — which is the percentage of all applicants who are accepted into a school or program. In 2006 Harvard University was the nation’s most selective college, with a selectivity rate of 9 percent. Generally, undergraduate colleges are considered “highly selective” if they offer admission to fewer than half of their applicants. Whereas only about one-third (35 percent) of US four-year colleges fell into the highly selective category, more than one-half (54 percent) of prelicensure nursing programs earned that designation in 2006. And, while the vast majority (over 90 percent) of undergraduate colleges are “less selective” (accepting more than one-half of their applicants), only 42 percent of nursing programs fall into that category.1
Overall, baccalaureate programs accept qualified applications at a much higher rate than do their associate degree counterparts. In 2006, baccalaureate programs accepted more than 71 percent of all qualified prelicensure applications, and diploma programs accepted 74 percent, compared to only 54.4 percent accepted by associate degree programs. Compared with 2005, the percentage of qualified applications not accepted to baccalaureate programs was up slightly in 2006, while the percentage turned away from associate degree programs was down relative to the previous academic year.
1 Hawkins, D. A., & Clinedinst, M. (2006). The State of College Admission 2006. Alexandria, VA: National Association for
College Admission Counseling (NACAC). Also, National Center for Education Statistics (NCES). (2004). Integrated Postsecondary Education Data System (IPEDS). DAS Online data extraction system. [Online]. Available:
Key Trends - All Prelicensure RN Programs 0 50 100 150 200 250 300 350 1983 1985 1987 1989 1991 1993 1995 ... 2003 2005 Thousands
Enrollments Admissions Graduations
Yield. The yield rate, defined as the percentage of accepted applicants who go on to enroll, offers another indicator of demand for spots in academic programs. A high yield rate might indicate the popularity of a particular program relative to others, or can signal a dearth of alternative venues for pursuing a course of educational studies. Consistent with this year’s drop in applications, after three consecutive years of extraordinarily high yield rates exceeding 90 percent, the average yield rate of all prelicensure RN programs fell in 2006 to just over 80 percent. Specifically, yield rates were highest among associate degree programs, where 86 percent of accepted applicants went on to enroll. At baccalaureate and diploma programs, on average, three out of four accepted applicants entered those schools.
While down slightly from 2005, the yield rate for prelicensure nursing programs is still extraordinarily high relative to that found among undergraduate colleges nationally. For instance, in 2006, Harvard’s yield rate of 79 percent was the highest in the nation, whereas the average yield rate among prelicensure nursing programs was 80 percent.2 Specifically, at 86 percent, yield rates among associate degree
programs were the highest of the various types of prelicensure nursing programs, while at baccalaureate and diploma programs three out of four accepted applicants went on to enroll.
Admissions Rise
But Rate of Enrollment Growth Continues to Fall
Nursing Workforce Supply Trends. The nation added 150 additional prelicensure RN programs between 2005 and 2006, a significant expansion. Moreover, the new programs were not simply added by institutions with established nursing schools. Rather, the overall number of American institutions offering nursing programs expanded by 6.4 percent over the past year.
Perhaps reflecting this expanded capacity, annual admissions rose by 5 percent, to 166,442 in 2005-2006. Increases were seen across program types, with baccalaureate program admissions up 12 percent, diploma programs up 9 percent, and associate degree program admissions gaining 8 percent between 2005 and 2006.
Although annual admissions increased in healthy proportions, the rate of growth of overall enrollments fell off significantly between 2005 and 2006. After growing almost 15 percent between 2003 and 2004, enrollment growth declined to only 3 percent in 2005, and fell to just half that level — 1.5 percent — in 2006.
The falling growth rate in enrollments was seen across all types of RN programs. Baccalaureate enrollments grew by only 4.2 percent in 2006 compared with 6.2 percent in 2005 — a decline of 33 percent. And enrollments in associate degree programs were effectively unchanged from last year, registering a fractional 0.3 percent drop to 150,277 in 2006. Diploma enrollments fell by 2.6 percent to slightly under 12,000 in 2006.
3
One-Year Retention Status of Full-Time US Nursing and College Students
72% 64% 83% 81% 90% 0% 20% 40% 60% 80% 100% BSN (2005-06) Diploma (2005-06) ADN (2005-06) US 2-Year Institutions (2004) US 4-Year Institutions (2004) 87% 90% 75% 81% 80% 83% 65% 70% 75% 80% 85% 90% BSN Diploma ADN
One-Year Retention Status of Full-Time RN Students: 2005 and 2006
2005 2006
Graduations. In keeping with long-term trends, fully 59 percent of all new graduates eligible to enter the nursing workforce this year in the United States were prepared in two-year associate degree programs, whereas slightly more than one-third (38 percent) graduated from baccalaureate nursing programs, and 8 percent graduated from diploma programs. Overall graduations from prelicensure programs grew by 8.5 percent to just under 85,000 in 2006. Graduations from baccalaureate programs grew by almost 20 percent, whereas the number of associate degrees conferred grew by only 3 percent, and graduations from diploma programs actually fell by 3 percent.
Student Retention. Retention rates in nursing exceed those found in US postsecondary institutions by a healthy margin. In 2006, nine out of every 10 students who had enrolled in baccalaureate nursing programs in 2005 remained enrolled or graduated by 2006, compared with a retention rate of only 72 percent at four-year US undergraduate institutions. And associate degree nursing programs had a retention rate of 83 percent, comparing very favorably with that of US two-year institutions, which retained under two-thirds (64 percent) of their first-year students at last count in 2004.3
Moreover, the one-year retention status of first-year, full-time nursing students showed a very healthy increase this year across all types of prelicensure RN programs. Between 2005 and 2006, the average first-year retention rate increased 3 percent among both baccalaureate and associate degree programs, while first-year retention in diploma programs jumped a prodigious 6 percent, from 75 percent in 2004-2005 to 81 percent in 2005-2006.
Minority Graduations Jump to 25 Percent
Student Demographics. This year’s Annual Survey of Schools of Nursing yields both positive and negative findings regarding characteristics of graduates from US nursing programs. On a very positive note, after three consecutive years in which the proportion of minorities entering the RN workforce stagnated at approximately 20 percent, minority graduations jumped to 24.5 percent in 2006. This increase in minority graduations was distributed across all racial-ethnic categories, each of which exhibited fractional growth between 2005 and 2006. (Asians, African-Americans, and Hispanics each gained roughly an additional 1 percent share of graduates, while American Indians gained .3 percent.)
Minority Graduations from Basic RN Programs 24% 15% 13% 13% 13% 13% 14% 20% 21% 20% 0% 5% 10% 15% 20% 25% 30% 1989-1990 1990-1991 1991-1992 1992-1993 1993-1994 1994-1995 ▪ 2002-2003 2003-2004 2004-2005 2005-2006
Prelicensure RN Graduates Over Age 30
16% 14% 17% 32% 27% 16% 0% 10% 20% 30% 40% 50% 60%
Baccalaureate Diploma Associate Degree
31 to 40 Over age 40
This represents an extremely auspicious turn of events from two key standpoints. First, given the need to maximize the sheer numbers of recruits into the profession, it is crucial that future candidates be drawn from the broadest possible swath of the working population. Second, research increasingly links minority health disparities to a lack of cultural competence on the part of health care providers, who often differ from their patients with respect to racial-ethnic background. This concern has been particularly acute within the RN workforce where the percentage of minorities has been slow to increase, and only exceeded 10 percent in the last decade.4 Thus, if this year’s jump in minority
graduations marks a permanent trend, it will be welcome indeed.
On another positive note, after falling off during the dot.com boom, the percentage of men graduating from basic RN programs has exhibited a small but steady growth trend over the past three years, with men reaching just over 12.1 percent of graduates in 2006. Baccalaureate programs had the smallest proportion of men in 2006, with males representing just over one in 10 graduates. Associate degree and diploma programs, with 13 percent and 15 percent of graduates respectively, had slightly greater percentages of men.
Despite the good news, the age of new graduates represents an area of concern. Fully 43 percent of all prelicensure nursing graduates were over the age of 30 in 2006, and one in six (16 percent) were over the age of 40. While age breakdowns for new college graduates were not available in 2006, we do know that fewer than one in four (24 percent) of students enrolled in US postsecondary institutions were over age 30 in 2006, and that only 11 percent were over the age of 40. By contrast, the relatively advanced age of new nursing graduates is worrisome as it indicates that, despite growth in the volume of new workforce entrants in nursing, the average RN’s overall length of employment in nursing will be foreshortened considerably by delayed entrance into the profession.
Kathy Kaufman, PhD Senior Research Scientist for Public Policy National League for Nursing
4 US Department of Health and Human Services (HHS) Health Resources and Services Administration (HRSA) (2006). The
Figure
1
N
umber
of Bas
ic
R
N
Pr
og
ra
ms
by
Prog
ra
m T
ype: 1
986 to
1995 an
d 2003
to 200
6
200 400 600 800 1,000 1,200 1986 1987 1988 1989 1990 1991 1992 1993 1994 1995 ▪ 2003 2004 2005 2006B
ac
calau
rea
te
Diplo
m
a
As
socia
te De
gre
e
7
Figure 2
Per
centag
e of
Basi
c R
N
Pr
og
ra
ms by
Pr
og
ra
m T
ype: 1986 to 1995 and 2003 to 2006
31% 32% 33% 33% 33% 34 % 34% 34% 34% 34% 37% 37% 37% 38% 16% 14% 12% 11% 10% 10 % 9% 9% 8% 8% 5% 5% 4% 4% 53% 54% 55% 56% 56% 56 % 57% 57% 58% 58% 59% 58% 59% 58% 0% 20% 40% 60% 80% 100% 1986 1987 1988 1989 1990 1991 1992 1993 1994 1995 ▪ 2003 2004 2005 2006B
accalaureat
e
Diploma
A
ssociat
e D
egree
Figure 3
N
umber
of
Basi
c R
N
Pr
og
rams by
R
eg
ion: 1988 to 1995 and 2003 to 2006
343 335 331 335 332 329 329 331 293 309 312 351 415 423 429 430 429 435 434 441 415 432 436 476 475 483 489 497 500 507 513 516 513 532 541 594 209 216 221 222 223 222 225 228 223 231 255 273 0 200 400 600 800 1, 000 1, 200 1, 400 1, 600 1, 800 1988 1989 1990 1991 1992 1993 1994 1995 ▪ 2003 2004 2005 2006Nort
h A
tlant
ic
M
idw
est
South
West
9 0 20,000 40,000 60,000 80,000 100,000 120,000 140,000 160,000 180,000 19 75 -7 6 76 19 -7 7 77 19 -7 8 78 19 -7 9 79 19 -8 0 80 19 -8 1 81 19 -8 2 82 19 -8 3 83 19 -8 4 84 19 -8 5 85 19 -8 6 86 19 -8 7 87 19 -8 8 88 19 -8 9 89 19 -9 0 90 19 -9 1 91 19 -9 2 92 19 -9 3 93 19 -9 4 94 19 -9 5 20 02 -0 3 03 20 -0 4 04 20 -0 5 05 20 -0 6 Figure 4 Annual Admis si ons to Bas ic R N Pr og rams : 1975-76 to 1994-95 and 2002-03 to 2005-06 * After 2001 missin g values were im pu
ted from historical records. See A
pp
endix for methodolo
gy
0 20,000 40,000 60,000 80,000 100,000 120,000 198 0-81 19 81 -82 19 82 -83 19 83 -8 4 19 84-85 198 5-86 19 86 -87 19 87 -88 19 88 -8 9 19 89-90 19 90 -9 1 19 91 -92 19 92 -9 3 19 93-94 199 4-95 20 02 -03 20 03 -0 4 20 04-05 200 5-06 Figure 5 Annual Admi ssi ons to Basi c R N Pr og ra ms by Pr og ra m T ype: 1980-81 to 1994-95 and 2002-03 to 2005-06 B accalaureat e Diploma A ssociat e D egree * After 2001 missin g values were im pu
ted from historical records. See A
pp
endix for methodolo
gy
11
Figure 6
Enr
ol
lm
ents i
n Basi
c R
N
Pr
og
ra
ms by
Pr
og
ra
m T
ype, 2006
Baccalau reate 44% Diploma 4% A ssociate D egree 52%Figure 7 Enr ol lm en ts in Ba sic RN Pr og ra m s: 19 76 to 19 94 a nd 20 03 to 2 00 6 0 50 ,00 0 100 ,00 0 150 ,00 0 200 ,00 0 250 ,00 0 300 ,00 0 350 ,00 0 197 6 197 7 197 8 197 9 198 0 198 1 198 2 198 3 198 4 198 5 198 6 198 7 198 8 198 9 199 0 199 1 199 2 199 3 199 4 200 3 200 4 200 5 200 6 * After 2001 missin g values were im pu
ted from historical records. See A
pp
endix for methodolo
gy
13 0 20,000 40,000 60,000 80,000 100,000 120,000 140,000 160,000 198 0 19 81 198 2 198 3 198 4 19 85 198 6 198 7 198 8 198 9 19 90 199 1 199 2 199 3 19 94 200 3 200 4 200 5 20 06 Figure 8 Enr ol lm ents i n Basi c R N Pr og ra ms by Pr og ra m T ype: 1980 to 1994 and 2003 to 2006 B accalaureat e Diploma A ssociat e D egree
* After 2001 missing values were impu
ted from hist
50,000 100,000 150,000 200,000 250,000 300,000 350,000 1987 1988 1989 1990 1991 1992 1993 1994 1995 • 2003 200 4 2005 2006 Figure 9 Enr ol lm ents i n Basi c R N Pr og ra ms by Adm ini str ati ve C ontr ol : 1987 to 1995 and 2003 to 2006 Public Priv at e Ot her
* After 2001 missing values were impu
ted from hist
15
88%
12%
67%
33%
54%
46%
0% 20% 40% 60% 80% 100% Ba cc alaur eate D iplom a As so ci ate Degr eeFigure 10
Enr
ol
lm
ents of
Basi
c R
N
Students by
Enr
ol
lm
ent Status and Pr
og
ra
m T
ype,
2005-06
Full Time
Part
Time
11 % 12 % 12 % 22 % 26 % 33 % 33 % 46 % 46 %
0%
10%
20%
30%
40%
50%
Ba cca la ur ea te Diplom a A ss oc ia te Deg reeFigure
11
P
erce
nt
ag
e of
B
asic RN S
tud
en
ts
Enr
ol
led Par
t Ti
me by
P
rog
ra
m Ty
pe, 2003,
2005, and 2006
2003
2005
2006
17 0 10,000 20,000 30,000 40,000 50,000 60,000 70,000 80,000 90,000 100,000 1985 -86 1986 -87 19 87 -88 19 88 -89 1989 -90 199 0-9 1 19 91 -92 1992 -93 1993 -94 199 4-9 5 2002 -03 200 3-0 4 20 04 -05 20 05 -06 Figure 12 Gr aduati ons f rom Basi c R N Pr og ra ms: 1985-86 to 1994-95 and 2002-03 to 2005-06 * After 2001 missin g values were im pu
ted from historical records. See A
pp
endix for methodolo
gy
0 10,000 20,000 30,000 40,000 50,000 60,000 19 84 -8 5 19 85 -8 6 19 86 -8 7 19 87 -8 8 19 88 -8 9 19 89 -9 0 19 90 -9 1 19 91 -9 2 19 92 -9 3 19 93 -9 4 19 94 -9 5 20 02 -0 3 20 03 -0 4 20 04 -0 5 20 05 -0 6 Figure 13 Gr aduati ons f rom Basi c R N Pr og ra ms by Pr og ra m T ype: 1984-85 to 1994-95 and 2002-03 to 2005-06 Baccal aur eat e Di pl oma A ssso ci at e Degree
* After 2001 missing values were impu
ted from hist
19
Figure 14
Gr
aduati
ons f
rom Pr
el
ic
ensur
e R
N
Pr
og
ra
ms by
Pr
og
ra
m T
ype,
2005-06
Diploma
4%
A
sssociat
e D
egree
59%
B
accalaureat
e
37%
Figure 15
Baccal
aur
eate Pr
og
ra
ms as a Per
centag
e of
Al
l Basi
c R
N
Pr
og
ra
ms
and Baccal
aur
eate Gr
aduati
ons as a Per
centag
e of
Al
l Basi
c R
N
Gr
aduations:
1986-87 to
1994-95 and
2002-03 to
2005-06
0% 5% 10% 15% 20% 25% 30% 35% 40% 45% 198 6-87 19 87 -8 8 19 88 -8 9 198 9-90 19 90 -9 1 19 91 -9 2 199 2-93 19 93 -9 4 19 94 -9 5 20 02 -0 3 20 03 -0 4 200 4-05 20 05 -0 6% Programs
%
Gr
aduations
21
Figure 16
D
ipl
oma Pr
og
ra
ms as a Per
centag
e of
Al
l Basi
c R
N
Pr
og
ra
ms
and D
ipl
oma Gr
aduati
ons as a Per
centag
e of
Al
l Basi
c R
N
Gr
aduati
ons:
1986-87 to
1994-95 and
2002-03 to
2005-06
0% 5% 10% 15% 20% 19 86 -8 7 19 87 -8 8 19 88 -8 9 19 89 -9 0 19 90 -9 1 19 91 -9 2 19 92 -9 3 19 93 -9 4 19 94 -9 5 20 02 -0 3 20 03 -0 4 20 04 -0 5 20 05 -0 6%
Programs
%
Graduations
Figure 17
Associ
ate D
eg
ree Pr
ogr
ams as a Per
centag
e of
Al
l Basi
c R
N
Pr
og
ra
ms
and Associ
ate D
eg
ree Gr
aduati
ons as a
Per
centag
e of
Al
l Basi
c R
N
Gr
aduati
ons:
1986-87 to
1994-95 and
2002-03 to
2005-06
0% 20% 40% 60% 80% 19 86 -8 7 19 87-88 198 8-8 9 198 9-9 0 199 0-91 199 1-9 2 199 2-9 3 199 3-94 199 4-9 5 20 02 -0 3 20 03-04 200 4-0 5 20 05 -0 6%
Programs
%
G
raduations
23 Figure 1 8 N umber of Appl ic ati ons Submi tted t o Basi c R N Pr og ra ms : 1974 t o 1982, 1991 to 1995, and 2003 to 2006 0 50 ,0 00 100 ,0 00 150 ,0 00 200 ,0 00 250 ,0 00 300 ,0 00 350 ,0 00 197 4 197 5 197 6 197 7 19 78 19 79 19 80 1981 1982 ▪ 1991 1992 199 3 199 4 199 5 ▪ 20 03 20 04 20 05 2006 * After 2001 missin g values were im pu
ted from historical records. See A
pp
endix for methodolo
gy
Figu re 1 9 D isposi tio n of Appli cations to Bas ic RN Prog rams, 2005-06 Acc epted, 42% W aitli st ed , 1 2% R ej ec ted, 16% N ot Q ua lified , 30% Qualified, 70%
25
Figur
e 2
0
Dispos
ition of
Applic
ati
ons
to Bas
ic
RN Programs by
Program Ty
pe, 2005-06
31%
51%
28%
20%
13%
33%
49%
36%
39%
0% 10% 20% 30% 40% 50% 60% 70% 80% 90% 100% Ba cc alaureate D ipl oma Ass oc iate D eg reeAccep
ted
Q
ual
ifi
ed
, n
ot
accept
ed
Not qualifie
d
18
%
45
%
38
%
10
%
40
%
50
%
12
%
26
%
62
%
0% 20% 40% 60% 80% 100% Ba ccal au re ate D ip lo ma Asso cia te D eg reeFi
gure
2
1
Se
le
ct
iv
ity
L
ev
el
o
f Ba
si
c RN
Pr
og
ra
ms
by
Pr
og
ra
m Ty
pe
, 20
05
-0
6
A
cc
epts less
th
an 50
%
50
to
85
%
M
ore than
85
%
27 Figure 22 Av er ag e Y iel d R ate of Basi c RN Pr og ra ms and N umber of Appl ic ati ons Subm itted: 1980 to 1982, 1991 to 1995, and 2003 to 2006 0 10 20 30 40 50 60 70 80 90 100 1980 1981 1982 ▪ 1991 1992 1993 1994 1995 ▪ 2003 200 4 2005 2006 Y IE L D RA T E 0 50 100 150 200 250 300 350 400 A P P L IC A T IO N S (t h ous ands ) A p plications Yi el d Ra te
*After 2001 one number
of a
pp
lications was im
puted from historical records. See A
pp
endix for methodolo
gy
90% 81% 83% 64 % 72% 0% 20 % 40 % 60 % 80 % 10 0% Ba ccala ur ea te Nu rs in g (2005-06 ) Dipl oma Nursin g (20 05-06) As socia te Degree Nu rs in g (2005-06 ) US 2-Year Institutions (20 04) US 4-Yea r Insti tuti ons (2004 ) Figure 2 3 One-Y ear R etent io n Status * of F ul l Ti me N ur si ng St udents and F ul l Ti me U S U nder gr aduat es by Pr og ra m/Ins tit uti on Ty pe A D DI T IO N A L S O URCE : Nati o n al Cen ter f o r E ducati on S tati st ics ( 2004). Int e gra ted P o stsecon d ary E ducat io n Dat a S ystem (I P E DS ). D A S Onli ne data extract ion sy stem . A vai la b le at : ht tp: //n ces. ed. gov/ d asol /ip eds/ m ai npa ge. asp .
* Percentage of students who are still enrolled or have graduated one year af
29 6% 6% 8% 10 % 11% 11% 12 % 10% 10% 12% 12% 0% 2% 4% 6% 8% 10 % 12 % 14 % 1988 19 89 ▪ 1991 1992 199 3 1994 1995 ▪ 2003 2004 20 05 200 6
Figure 24
Gr
ad
ua
tio
ns o
f Me
n f
rom
Ba
si
c RN Prog
ra
m
s:
19
88
to
19
89
, 1
99
1 t
o 19
95
, a
nd
20
03
to
20
06
15% 13% 13% 13 % 13% 14% 20% 21% 20% 24% 0% 5% 10% 15% 20% 25% 198 9-90 19 90 -9 1 199 1-9 2 199 2-93 19 93 -9 4 199 4-9 5 20 02 -0 3 20 03 -0 4 200 4-05 20 05 -0 6
Figure 25
Per
centag
e of
M
inor
iti
es Gr
aduati
ng
fr
om Basi
c R
N
Pr
og
ra
ms:
1989-90 to
1994-95 and
2002-03 to
2005-06
31 0% 2% 4% 6% 8% 10% 12% 1989-90 1990-91 1991-92 1992-93 1993-94 1994-95 ▪ 2002-03 2003-04 2004-05 2005-06 AMERI C AN I NDI AN ASI AN HI SPANI C BLACK
Figure 26
Per
centag
e of
M
inor
iti
es Gr
aduati
ng
fr
om Basi
c R
N
Pr
og
ra
ms by
R
ace-E
thni
city
:
1989-90 to
1994-95 and
2002-03 to
2005-06
Fi gure 27 Gr adu at ions fr om Ba si c R N Pr og ra ms b y Ag e C at eg or y and Pr og ra m Ty pe , 2 005 -0 6 32 % 47 % 31 % 24% 25 % 21 % 28 % 27% 26 % 16 % 27 % 32% 16 % 16 % 14 % 17% 0% 10% 20% 30% 40% 50% 60% 70% 80% 90% 100% All Ba sic Pr og ra m s Baccalaur ea te Diplom a A ssociat e Deg re e A ge 41 an d Ov er 31 t o 40 26 t o 30 25 a nd Under
33
16%
16%
27
%
14%
32%
17%
0%
10
%
20
%
30
%
40
%
50
%
Baccalaur
eate
Dipl
om
a
Associ
ate Deg
ree
Fig
ure
28
Percen
tag
e of
Pre
lic
en
su
re RN Gra
dua
tes
ov
er Ag
e 30
, 20
05
-06
A
ge
31
to
40
Ov
er
A
ge 40
NUMBER
OF Number of Percent Number of Percent Number of Percent Number of Percent
YEAR SCHOOLS Programs Change Programs Change Programs Change Programs Change
1980 1,360 1,385 0.8 377 3.9 311 -6.6 697 2.8 1981 1,377 1,401 1.2 383 1.6 303 -2.6 715 2.6 1982 1,406 1,432 2.2 402 5.0 288 -5.0 742 3.8 1983 1,432 1,466 2.4 421 4.7 281 -2.4 764 3.0 1984 1,445 1,477 0.8 427 1.4 273 -2.8 777 1.7 1985 1,434 1,473 -0.2 441 3.3 256 -6.2 776 -0.1 1986 1,426 1,469 -0.3 455 3.2 238 -7.0 776 0.0 1987 1,406 1,465 -0.3 467 2.6 209 -12.2 789 1.7 1988 1,391 1,442 -1.6 479 2.6 171 -18.7 792 0.3 1989 1,429 1,457 1.0 488 1.9 157 -8.2 812 2.5 1990 1,412 1,470 0.9 489 0.2 152 -3.2 829 2.1 1991 1,411 1,484 1.0 501 2.4 145 -4.6 838 1.1 1992 1,404 1,484 0.0 501 0.0 135 -6.9 848 1.2 1993 1,415 1,493 0.6 507 1.2 129 -4.4 857 1.1 1994 1,422 1,501 0.5 509 0.4 124 -3.9 868 1.3 1995 1,434 1,516 1.0 521 2.4 119 -4.0 876 0.9 ... 2002 * 1,459 -3.8 526 1.0 76 -36.1 857 -2.2 2003 1,376 1,444 -1.0 529 0.6 69 -9.2 846 -1.3 2004 1,410 1,504 4.2 553 4.5 71 2.9 880 4.0 2005 1,446 1,544 2.7 573 3.6 62 -12.7 909 3.3 2006 1,538 1,694 9.7 644 12.4 73 17.7 977 7.5
*Data not available.
Basic RN Programs and Percentage Change from Previous Years by Type of Program: 1980 to 1995 and 2002 to 2006
Table 1
RN PROGRAMS
ALL BASIC DIPLOMA
PROGRAMS ASSOCIATE DEGREE PROGRAMS BACCALAUREATE PROGRAMS 35
ACADEMIC YEAR Number of Admissions Percent Change Number of Admissions Percent Change Number of Admissions Percent Change Number of Admissions Percent Change 1984-85 118,224 -4.5 39,573 0.4 14,875 -16.7 63,776 -4.2 1985-86 100,791 -14.7 34,310 -13.3 9,846 -33.0 56,635 -11.2 1986-87 90,693 -10.0 28,026 -18.3 8,337 -15.3 54,330 -4.1 1987-88 94,269 3.9 28,505 1.7 8,389 0.6 57,375 5.6 1988-89 103,025 9.3 29,042 1.9 10,010 19.3 63,973 11.5 1989-90 108,580 5.4 29,858 2.6 10,088 0.8 68,634 7.3 1990-91 113,526 4.6 33,437 12.0 10,220 -1.3 69,869 1.8 1991-92 122,656 8.0 37,886 13.3 10,691 4.6 74,079 6.0 1992-93 126,837 3.4 41,290 9.0 10,165 -4.9 75,382 1.7 1993-94 129,897 2.4 42,953 4.0 9,601 -5.5 77,343 2.6 1994-95 127,184 -2.1 43,451 1.2 7,717 -19.6 76,016 -1.7 ... 2002-03 133,011 – 47,903 – 6,196 – 78,912 – 2003-04 145,410 9.3 47,668 -0.5 6,294 1.6 91,448 15.9 2004-05 152,627 5.0 53,799 12.9 5,858 -6.9 92,970 1.7 2005-06 166,442 9.1 60,013 11.6 6,406 9.4 100,023 7.6
† After 2001 missing values for individual programs were imputed from historical records. See Appendix for detailed methodology.
Table 2
Annual Admissions to Basic RN Programs and Percentage Change from Previous Year by Program Type: 1984-85 to 1994-95 and 2002-03 to 2005-06
ASSOCIATE DEGREE PROGRAMS BACCALAUREATE
PROGRAMS ALL BASIC
Number of Number at Number of Number of
Enrollments Enrollments Enrollments Enrollments
1980 230,966 -1.6 95,858 -3.1 41,048 -6.0 94,060 2.2 1981 234,995 1.7 93,967 -2.0 41,009 -0.1 100,019 6.3 1982 242,035 3.0 94,363 0.4 42,348 3.3 105,324 5.3 1983 250,553 3.5 98,941 4.9 42,007 -0.8 109,605 4.1 1984 237,232 -5.3 95,008 -4.0 37,256 -11.3 104,968 -4.2 1985 217,955 -8.1 91,020 -4.2 30,179 -19.0 96,756 -7.8 1986 193,712 -11.1 81,602 -10.3 22,641 -25.0 89,469 -7.5 1987 182,947 -5.6 73,621 -9.8 18,927 -16.4 90,399 1.0 1988 184,924 1.1 70,078 -4.8 18,860 -0.4 95,986 6.2 1989 201,458 8.9 74,865 6.8 20,418 8.3 106,175 10.6 1990 221,170 9.8 81,788 9.2 21,969 7.6 117,413 10.6 1991 237,598 7.4 90,877 11.1 22,905 4.3 123,816 5.4 1992 257,983 8.6 102,128 12.4 23,252 1.5 132,603 7.1 1993 270,228 4.7 110,693 8.4 22,235 -4.4 137,300 3.5 1994 268,350 -0.7 112,659 1.8 19,796 -11.0 135,895 -1.0 1995 261,219 -2.7 109,505 -2.8 16,479 -16.8 135,235 -0.5 ... 2002 221,698 – 94,739 – 9,767 – 117,192 – 2003 244,769 10.4 105,907 11.8 11,153 14.2 127,709 9.0 2004 281,141 14.9 117,586 11.0 12,447 11.6 151,108 18.3 2005 290,309 3.3 124,906 6.2 12,162 -2.3 153,241 1.4 2006 292,238 0.7 130,120 4.2 11,841 -2.6 150,277 -1.9
† After 2001 missing values for individual programs were imputed from historical records. See Appendix for detailed methodology.
YEAR
Table 3
Enrollments in Basic RN Programs and Percentage Change from Previous
Year by Program Type: 1980 to 1995 and 2002 to 2006†
BACCALAUREATE PROGRAMS
ASSOCIATE DEGREE PROGRAMS DIPLOMA PROGRAMS
ALL BASIC RN PROGRAMS Percent Change Percent Change Percent Change Percent Change 37
ACADEMIC YEAR Number of Graduations Percent Change Number of Graduations Percent Change Number of Graduations Percent Change Number of Graduations Percent Change 1984-85 82,075 2.2 24,975 5.3 11,892 -2.5 45,208 1.8 1985-86 77,027 -6.2 25,170 0.8 10,524 -11.5 41,333 -8.6 1986-87 70,561 -8.4 23,761 -5.6 8,272 -21.4 38,528 -6.8 1987-88 64,839 -8.0 21,504 -9.5 5,938 -28.2 37,397 -2.9 1988-89 61,660 -4.9 18,997 -11.6 4,826 -18.7 37,837 1.2 1989-90 66,088 7.2 18,571 -2.2 5,199 7.7 42,318 11.8 1990-91 72,230 9.3 19,264 3.7 6,172 18.7 46,794 10.6 1991-92 80,839 11.9 21,415 11.2 6,528 5.8 52,896 13.0 1992-93 88,149 9.0 24,442 14.1 6,937 6.3 56,770 7.3 1993-94 94,870 7.6 28,912 18.3 7,119 2.6 58,839 3.6 1994-95 97,052 2.3 31,254 8.1 7,049 -1.0 58,749 -0.1 ... 2001-02 72,882 – 30,522 – 2,287 – 40,073 – 2002-03 76,659 5.2 31,187 2.2 2,550 11.5 42,922 7.1 2003-04 78,476 2.4 26,293 -15.7 3,203 25.6 48,980 14.1 2004-05 84,878 8.2 28,373 7.9 3,387 5.7 53,118 8.4 2005-06 92,123 8.5 33,992 19.8 3,275 -3.3 54,856 3.3
† After 2001 missing values for individual programs were imputed from historical records. See Appendix for detailed methodology. Table 4
Graduations from Basic RN Programs and Percentage Change from Previous Year by
Program Type: 1984-85 to 1994-95 and 2001-02 to 2005-06†
BACCALAUREATE PROGRAMS ASSOCIATE DEGREE PROGRAMS DIPLOMA PROGRAMS BASIC RN PROGRAMS
Percentage of Applications
All RN Programs 100%
Accepted 41.9
Not Accepted (subtotal) 58.1
Not Qualified 30.4 Qualified (subtotal ) 27.7 Waitlisted 11.8 Not Waitlisted 16.0 Baccalaureate 100% Accepted 49.2
Not Accepted (subtotal) 50.8
Not Qualified 30.8 Qualified (subtotal ) 20.0 Waitlisted 5.2 Not Waitlisted 14.8 Diploma 100% Accepted 36.1
Not Accepted (subtotal) 63.9
Not Qualified 51.2 Qualified (subtotal ) 12.6 Waitlisted 3.6 Not Waitlisted 9.0 Associate Degree 100% Accepted 38.9
Not Accepted (subtotal) 61.1
Not Qualified 28.4
Qualified (subtotal ) 32.7
Waitlisted 15.5
Not Waitlisted 17.2
Table 5
Percentage of Applications for Admission Accepted, Not Accepted, and
Waitlisted by Program Type, 2006
Black Hispanic Asian American Indian Other* YEAR % % % % % 1990-91 72,230 7.4 2.8 2.5 0.5 – 1991-92 80,839 7.2 3.0 2.5 0.6 – 1992-93 88,149 6.8 2.6 2.6 0.7 – 1993-94 94,870 6.8 3.0 2.9 0.6 – 1994-95... 97,052 7.0 3.1 3.0 0.6 – 2002-03 76,659 11.4 5.1 3.5 0.9 5.1 2003-04 78,509 10.4 6.0 3.6 0.9 5.5 2004-05 84,878 10.2 5.1 4.1 0.8 5.9 2005-06 92,123 10.7 6.9 4.8 1.0 4.2 1990-91 19,264 8.0 2.7 4.0 0.6 – 1991-92 21,415 7.8 3.0 3.5 0.6 – 1992-93 24,442 7.4 2.4 3.8 0.8 – 1993-94 28,912 6.6 3.0 3.9 0.5 – 1994-95... 31,254 7.3 2.9 4.0 0.5 – 2002-03 31,187 10.5 4.1 4.2 1.1 4.0 2003-04 26,320 11.1 5.4 4.3 0.7 3.8 2004-05 28,373 10.3 4.3 4.5 0.7 4.3 2005-06 33,992 9.7 4.7 5.2 1.4 7.0 1990-91 6,172 6.2 3.2 1.8 0.2 – 1991-92 6,528 5.4 2.4 1.7 0.2 – 1992-93 6,937 5.3 2.4 2.0 0.2 – 1993-94 7,119 5.5 2.5 2.9 0.3 – 1994-95... 7,049 5.5 2.7 2.3 0.3 – 2002-03 2,550 15.1 4.5 2.6 0.3 4.0 2003-04 3,203 13.0 2.7 2.2 0.4 1.9 2004-05 3,387 11.2 3.1 2.8 0.2 1.0 2005-06 3,275 11.7 5.3 4.8 0.5 4.3 1990-91 46,794 7.3 2.8 2.0 0.5 – 1991-92 52,896 7.1 3.0 2.2 0.6 – 1992-93 56,770 6.8 2.8 2.1 0.7 – 1993-94 58,839 7.1 3.0 2.5 0.7 – 1994-95... 58,749 7.0 3.3 2.6 0.7 – 2002-03 42,922 11.6 5.9 3.1 0.8 5.8 2003-04 48,986 9.8 6.5 3.3 1.0 6.7 2004-05 53,118 10.1 5.6 3.9 0.9 7.1 2005-06 54,856 11.1 8.1 4.6 0.9 2.8 * Use of the "Other" category was initiated in 2002-03.
† After 2001 missing values for individual programs were imputed from historical records. See Appendix for detailed methodology.
Table 6
Graduations of Minority Students from Basic RN Programs: 1990-91 to 1994-95 and 2002-03 to 2005-06
Total Graduations†
ALL REPORTING RN PROGRAMS
BACCALAUREATE PROGRAMS
ASSOCIATE DEGREE PROGRAMS DIPLOMA PROGRAMS
YEAR Total Graduations† Percent Male 1988 64,839 5.7 1989 61,660 5.7 1991 72,230 8.4 1992 80,839 9.9 1993 88,149 10.5 1994 94,870 11.4 1995 97,052 12.4 2003 76,659 9.8 2004 78,476 10.4 2005 84,878 11.6 2006 92,123 12.1 1988 21,504 5.2 1989 18,997 5.0 1991 19,264 8.2 1992 21,415 10.4 1993 24,442 10.5 1994 28,912 11.1 1995 31,254 12.2 2003 31,187 9.1 2004 26,293 9.2 2005 28,373 11.4 2006 33,992 10.2 1988 5,938 6.7 1989 4,826 5.2 1991 6,172 8.0 1992 6,528 9.7 1993 6,937 10.6 1994 7,119 12.0 1995 7,049 13.0 2003 2,550 8.2 2004 3,203 8.9 2005 3,387 11.3 2006 3,275 14.7 1988 37,397 5.9 1989 37,837 6.0 1991 46,794 8.5 1992 52,896 9.7 1993 56,770 10.4 1994 58,839 11.5 1995 58,749 12.4 2003 42,922 10.5 2004 48,980 11.1 2005 53,118 11.7 2006 54,856 13.1 Table 7
Graduations of Men from Basic RN Programs by Program Type:
1986 to 2006 (selected years) ALL RN PROGRAMS
† After 2001 missing values for individual programs were imputed from historical records.
See Appendix for detailed methodology.
BACCALAUREATE PROGRAMS
ASSOCIATE DEGREE PROGRAMS DIPLOMA PROGRAMS
All Regions 84,878 11.6 North Atlantic 17,352 12.4 Midwest 22,269 8.7 South 32,620 12.5 West 12,637 13.1 All Regions 28,373 11.4 North Atlantic 4,914 9.9 Midwest 8,485 8.5 South 11,296 13.7 West 3,678 12.1 All Regions 3,387 11.3 North Atlantic 1,835 13.2 Midwest 704 8.7 South 848 9.7 West – – All Regions 53,118 11.7 North Atlantic 10,603 12.9 Midwest 13,080 8.8 South 20,476 12.2 West 8,959 13.5
† Missing values for individual programs were imputed from historical records.
See Appendix for detailed methodology.
ASSOCIATE DEGREE PROGRAMS
Table 8
Graduations of Men from Basic RN Programs by Program Type and Region, 2006
Percent Male
ALL REPORTING RN PROGRAMS
BACCALAUREATE PROGRAMS
REGION Total Graduations†
APPENDIX: METHODOLOGY
Overview. In the spring of 2007, the deans, directors, or department chairs of all state-accredited prelicensure nursing programs in the United States∗ were contacted by email by the National League for Nursing and invited to participate in the 2007 Concise Survey of Schools of Nursing. Invitations were sent on March 7, 2007 followed by a series of follow-up emails sent to non-responding schools between March 28 and June 19. Electronic, web-based survey forms were made available to nursing school administrators and staff members.
Data reporting and estimation techniques. The estimation techniques used to generate this report were devised to balance two key objectives: a) the evaluation of the 2005-06 dataset within the context of historical trends, and b) accurate statistical estimation of the size of the 2005-06 student body and its subpopulations. To fulfill these objectives we used two different techniques throughout this report. Figures and tables that present the proportional distribution of the 2005-06 nursing student population use only 2005-06 survey data. By contrast, tables and figures that trend numbers of students were generated using unweighted historical imputation, a technique in which a previous value of a nonrespondent is used for the imputation of a current value. In this case the number of enrollments, admissions, or graduations of programs that did not complete a survey in 2005-06 were imputed from the data most recently reported by the program. These charts and tables are identified by the word Estimated in titles or footnotes.
Key Statistics in Reported and Estimated Data Tables
Baccalaureate Diploma Associate Degree
Total Programs Programs Programs
Reported Imputed Reported Imputed Reported Imputed Reported Imputed
Number of
Programs 688 754 226 296 48 13 414 445
Admissions 93,872 72,570 31,224 28,789 4,934 1,472 57,714 42,309
Enrollments 150,643 144,158 58,330 71,790 9,085 2,756 83,228 69,612
Graduations 48,005 44,118 16,335 17,657 2,336 939 29,334 25,522
Characteristics of responding vs. nonresponding programs. Of 1,694 programs, 688 reported survey data this year for an overall response rate of 40.6 percent to the 2005-06 survey. The response rate varied by program type, ranging from a rate of 65.8 percent among diploma programs to 35.1 percent among baccalaureate programs. Associate degree programs responded at a rate of 42.4 percent. This year’s survey response rate was highest in the North Atlantic (45 percent), followed by the South (42 percent), the Midwest (41 percent), and the West (32 percent). When reported data are combined with historical data, which is substituted in cases where data are not reported to produce population estimates, the 2005-06 dataset is very similar to the universe of nursing schools with respect to regional distribution and program type (see table below).
∗ U.S. territories are not included in this publication.
Distribution of Database Records by School Characteristics and Year Collected Data Collection Year
All nursing
programs Any data 2005 Pre-2005 No data
SCHOOL
CHARACTERISTICS Count % Count % Count % Count % Count %
Program Type 1694 100 1442 100 688 100 754 100 252 100 Baccalaureate 644 38.0 522 36.2 226 32.8 296 39.3 122 48.4 Diploma 73 4.3 61 4.2 48 6.9 13 1.7 12 4.7 Associate degree 977 57.7 859 59.6 414 60.2 445 59.0 118 46.8 Region 1694 100 1442 100 688 100 754 100 252 100 Midwest 476 28.1 404 28.0 194 28.2 210 27.9 72 28.6 North Atlantic 351 20.7 299 20.7 157 22.8 142 18.8 52 20.6 South 594 35.1 516 35.8 250 36.3 266 35.3 78 31.0 West 273 16.1 223 15.5 87 12.6 136 18.0 50 19.8