2012
Q1 Q2 Q3 Q4 Year Full
Real Sector
Real GDP Growth, y-o-y % 1.5 2.3 0.0 1.5 1.3
Real GDP Growth, q-o-q saar % 7.8 0.1 -4.6 3.3 -
Index of Industrial Production, y-o-y % -1.1 4.2 -1.4 -0.4 0.3
Non-oil Domestic Exports, y-o-y % 6.0 3.7 -3.2 -4.2 0.5
Labour Market and Prices
Unemployment Rate, sa, % (Average) 2.1 2.0 1.9 1.8 2.0
CPI Inflation, y-o-y % 4.9 5.3 4.2 4.0 4.6
Wage Growth, y-o-y % 0.9 2.8 3.1 2.5 2.3
The Singapore economy expanded by 1.3% in 2012
Real GDP grew by 3.3% q-o-q saar (quarter-on-quarter seasonally-adjusted annualised rate) in Q4 2012, following a 4.6% contraction the quarter before. The turnaround was broad-based across both external and domestic-oriented sectors.
G3 economies contracted, but growth in Asia ex-Japan strengthened in Q4 2012
Economic output in the G3 shrank in Q4 2012, after growing marginally in the previous quarter. However, more recent data suggests that growth momentum in the global economy is picking up, particularly in Asia ex-Japan, alongside a recovery in China.GDP growth for 2013 is likely to be modest
Against this backdrop, the Singapore economy is forecast to register growth of 1-3% for 2013 as a whole, supported by domestic-oriented activities and some recovery in the sectors reliant on external demand.
CPI inflation is forecast to come in at 3.5-4.5% for 2013
CPI-All Items inflation is likely to remain elevated in 2013, underpinned by firm accommodation and private road transport costs. Excluding these two items, MAS Core Inflation will be lower at around 2-3%.
7 March 2013
Recent Economic Developments in Singapore
____________________________
Note: Labour market statistics were obtained from the Ministry of Manpower, while trade and index of industrial production (IIP) data were provided by IE Singapore and the EDB respectively. All other data in this document were obtained from the Building
A. External Developments
The G3 economies ended 2012 on a negative note
As the recessions in the Eurozone and Japan persisted, the weighted GDP of the G3 economies registered a decline of 1.0% q-o-q saar in Q4 2012, from almost flat growth in the previous quarter. In the US, economic activity decelerated sharply towards the end of the year, largely due to deep defence cuts and a slower rate of inventory restocking. Nevertheless, there are signs that the downturn may have troughed, with growth in these economies expected to recover gradually through 2013.
Economic growth in the US fell from a robust 3.1% q-o-q saar in Q3 2012 to just 0.1% in Q4 as private investment, government consumption and exports contracted simultaneously. However,
private consumption growth
accelerated to 2.1% q-o-q saar from 1.6% in the previous quarter, spurred by a surge in durable goods spending as disposable incomes rose.
G3 economic output declined in Q4 2012.
Source: Datastream * Based on 17 countries
Gross private domestic investment slipped by 1.5% q-o-q saar in Q4 2012, as weak inventory accumulation more than offset an expansion in both equipment & software and residential investment. This was compounded by a sharp pullback in federal government defence spending, which subtracted 1.3% points from real GDP growth. Despite a weaker US dollar, sluggish external demand led to a fall in exports of 3.9% q-o-q saar—the first such contraction since Q1 2009.
Recent production indicators suggest that US economic activity will pick up modestly in Q1 2013. In February, the ISM PMIs for both manufacturing and services strengthened further to 54.2 and 56.0 respectively, from 53.1 and 55.2 in January. In a sign that the labour market is continuing to improve, the employment sub-indices in both sectors also remained firmly in positive territory. However, the prospects for household earnings growth, and hence private consumption, may be more subdued. Following a surge in growth in December, which was largely due to one-off factors, growth in personal income in January corrected, registering a fall of 3.6% instead. As a result, retail sales increased by just 0.1% m-o-m in January 2013, after growing by an average 0.4% in November and December 2012.
2007 2008 2009 2010 2011 2012 -20 -15 -10 -5 0 5 10 % Q O Q S A A R US Japan Eurozone* Real GDP Growth Q4
Further, Congress has failed to reach an agreement on the sequester, which means automatic spending cuts across the board are now taking place. Unless a deal is reached in the coming months, employment and private consumption spending will be further impacted. Overall, the current consensus has projected US GDP growth to slip to 1.9% in 2013 from 2.2% last year.
The Eurozone economy contracted more severely than anticipated in Q4 2012, with output falling by 2.3% q-o-q saar following a 0.3% decline in Q3. This extends the recession in the currency bloc to its fifth quarter. After expanding in the first three quarters of 2012, Germany’s real GDP fell by 2.3% q-o-q saar in Q4 as net exports turned from a support to a drag on growth. While Spain and Italy also saw large contractions of 3.1% and 3.7% q-o-q saar respectively, the other core economies such as France, the Netherlands and Austria registered smaller declines in economic output.
Notwithstanding the disappointing Q4 outturn, latest indicators suggest that growth prospects in the Eurozone could be improving gradually. The reduction of uncertainty emanating from three key global risks—the US fiscal cliff, China’s hard landing and the Eurozone’s own debt crisis—has given economic sentiment a fillip, pushing the Eurozone Economic Sentiment indicator to a nine-month high in February. The return of confidence may augur a faster recovery, as evidenced by improvements in the region-wide manufacturing and services PMIs at the start of the year, although fiscal austerity and high unemployment will still pose headwinds to growth. Overall, the Eurozone economy is projected to contract by a milder 0.2% in 2013, compared with the 0.5% fall seen in 2012.
In Japan, real GDP declined by a more moderate 0.4% q-o-q saar in Q4 2012, after the sharp drop of 3.8% in Q3. Activity was retarded by sagging demand from Europe and China, as shown by continued negative contributions of net exports and private non-residential investment, amounting to 0.6% point and 1.4% point respectively. Nevertheless, the overall contraction was milder in Q4, which was mainly attributable to resilient private consumption and public investment. In January 2013, the new Japanese government announced more stimulus plans to revive growth, including a 10 trillion yen fiscal package. Together with an easier monetary policy and a weaker yen, this has boosted corporate sentiment as well as the short-term outlook for the economy. The consensus real GDP growth forecast for Japan was subsequently upgraded to 1.2% for 2013.
Headline inflation in the G3 economies remained muted at 1.7% y-o-y in Q4, unchanged from the previous quarter amid soft demand conditions. In the US, headline inflation crept up to 1.9% y-o-y in Q4, due in part to trickle-down effects from the drought in the US farm belt. Nonetheless, the inflation outlook remains stable, as domestic demand is expected to stay moderate in early 2013.
G3 headline inflation stayed subdued.
Source: Datastream
In contrast, headline inflation in the Eurozone fell to 2.3% y-o-y in Q4 from 2.5% in Q3, as continued slack in the labour market kept wage pressures subdued. The strengthening euro and weak levels of economic activity are likely to keep inflationary pressures benign in the near term. Meanwhile, Japan’s prices fell at a slower pace in Q4, and are expected to continue declining in early 2013 as the effects of last year’s energy price increases wash out. Consequently, overall CPI inflation in the G3 is projected to ease further to 1.5% in 2013, from 1.9% last year.
Growth in Asia ex-Japan has strengthened
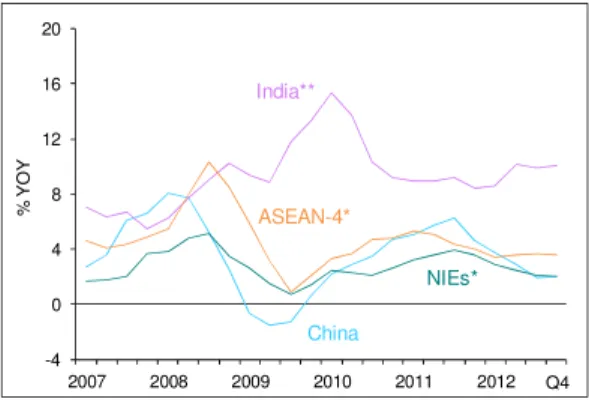
After plateauing in Q3 2012, the Asia ex-Japan economies have seen an upturn in Q4, alongside firmer growth in China. The trade-oriented NIEs posted faster sequential GDP growth, while in the ASEAN region, Thailand and the Philippines surprised with stellar performances. Given relatively optimistic prospects, growth in Asia ex-Japan is expected to improve to 5.6% in 2013, from 5.1% in 2012.
After seven straight quarters of deceleration, China’s GDP growth picked up in Q4 2012 to reach 7.9% y-o-y. This brought annual growth for 2012 to 7.8%, higher than the government’s target of 7.5%. In sequential terms, however, growth momentum eased slightly from 2.1% q-o-q sa in Q3 2012 to 2.0% in Q4. Nevertheless, industrial production and fixed asset investment both remained strong, the latter shored up by public infrastructure projects.
Asian ex-Japan economies rebounded in Q4, except for India.
Source: CEIC
* Regional groupings are weighted by Singapore's non-oil domestic exports (average 2009-2011)
Note: NIEs refer to Hong Kong, Korea and Taiwan. ASEAN-4 refer to Indonesia, Malaysia, the Philippines and Thailand
2007 2008 2009 2010 2011 2012 -3 -2 -1 0 1 2 3 4 5 6 % Y O Y US Japan Eurozone Q4 2007 2008 2009 2010 2011 2012 -10 -5 0 5 10 15 20 % Y O Y India China ASEAN-4* NIEs* Q4 Real GDP Growth
Forward-looking indicators suggest that the Chinese economy has turned a corner. The overall manufacturing PMI has stayed in expansionary territory for five consecutive months up to February, supported by firm new orders and low inventory levels. The completion of the destocking cycle for Chinese manufacturers has resulted in an elevated orders-to-inventory ratio, which signals stronger production in the coming months. Consensus forecasts suggest that China’s GDP growth will rise to 8.2% in 2013.
In contrast, the Indian economy decelerated further in Q4 2012, expanding by only 4.5% y-o-y—the slowest rate since the global financial crisis. While growth in the manufacturing sector recovered modestly to 2.5% from 0.8% in Q3, the large services sector slowed and agricultural output stagnated due to the poor monsoon. On a more positive note, gross investment spending reversed two quarters of contraction to grow by 6% as a slate of policy reforms lifted business sentiment. However, faster private consumption growth was offset by a decline in government consumption. India’s GDP growth is projected to come in at 5.3% for the fiscal year ending in March 2013, before improving to 6.3% in the following year.
GDP growth in the NIEs picked up to 4.7% q-o-q saar in Q4 2012 from 2.8% in the previous quarter, as the recovery in China and new technology product launches lifted electronics exports. Taiwan’s GDP expanded by a robust 7.3% q-o-q saar in Q4, aided by an uplift in domestic demand. Meanwhile Korea’s economy also strengthened further to 1.5% from 0.2% in the previous quarter, although investmentscontinued to contract in the face of political uncertainties. Hong Kong’s economic growth accelerated to 4.9% q-o-q saar in Q4, the fastest pace in seven quarters, on the back of strong consumption and investment. GDP growth in the NIEs as a whole is envisaged to rise to 3.4% in 2013, from 1.5% in 2012.
The ASEAN-4 economies performed well in Q4 2012, with domestic demand displaying continued resilience amid lacklustre exports. Private consumption in the region continued to grow at a brisk clip, buttressed by favourable labour market conditions, fiscal transfers and consumer optimism. At the same time, the investment upswing was sustained by accommodative monetary conditions, accelerated infrastructure spending and increased FDI inflows. Thailand, in particular, outperformed in Q4 2012, registering exceptional GDP growth of 18.9% y-o-y. While the low base of comparison a year ago imparted an upward bias, sequential growth was strong as well, reflecting buoyant consumption and a surge in exports due in part to the post-flood restoration of productive capacity. The Philippines also put in a particularly strong performance, with real GDP expanding by 6.8% y-o-y in Q4 on the back of robust household spending and a pick-up in public construction.
The ASEAN region is projected to maintain firm growth of 5.4% in 2013, albeit slightly lower than the 6.0% recorded in 2012. Domestic demand will continue to be supported by a strong pipeline of infrastructure projects, even as election-related spending in Malaysia and the Philippines ebbs, and the boost from Thailand’s post-flood rebound fades. Exports are also expected to stage a mild recovery, with prices of key commodities such as palm oil, rubber and coal stabilising since late 2012, after declining over the last two years. The gradual improvement in external demand later this year should provide further support. Moreover, the region’s role as a “downstream producer” for Japan suggests that exports are unlikely to be adversely affected by a weaker yen and might even benefit from cheaper intermediate goods imports.
On the inflation front, consumer prices in Asia ex-Japan rose marginally to 3.7% y-o-y in Q4, as the cyclical slowdown in the preceding quarters dampened inflationary pressures with a lag. However, India’s inflation rate remained elevated at 10.1% y-o-y in Q4, largely due to supply-side bottlenecks. Headline inflation in the region is expected to climb to 4.2% in 2013 from 3.9% in 2012, against a backdrop of firming global demand, robust wage growth, and possible subsidy pullbacks in some countries.
Inflation in Asia ex-Japan was broadly stable.
Source: CEIC and EPG, MAS estimates
* Regional groupings are weighted by nominal GDP 2011 ** India’s series uses CPI(Industrial Workers) prior to 2012
Table 1: Consensus Forecasts of GDP Growth
2011 2012 Forecast 2013 2014 Percent Industrial US 1.8 2.2 1.9 2.8 Japan -0.5 1.9 1.2 1.2 Eurozone 1.5 -0.5 -0.2 1.0 UK 0.9 0.2 0.9 1.7 NIE Hong Kong 4.9 1.4 3.4 4.1 Korea 3.6 2.0 3.0 3.7 Taiwan 4.1 1.3 3.6 4.1 ASEAN Indonesia 6.5 6.2 6.2 6.3 Malaysia 5.1 5.6 5.0 5.3 Thailand 0.1 6.4 4.6 4.8 Philippines 3.9 6.6 5.9 5.7 China 9.3 7.8 8.2 8.2 India* 7.5 5.0 6.3 7.4
Source: CEIC and Consensus Economics, Feb 2013 * Forecasts refer to fiscal year ending March
2007 2008 2009 2010 2011 2012 -4 0 4 8 12 16 20 % Y O Y India** China ASEAN-4* NIEs* Q4
The global IT industry has shown signs of stabilising
Global chip sales grew in Q4 even as prices rose.
Source: WSTS, Semiconductor Industry Association and EPG, MAS estimates
The global semiconductor industry registered modest growth of 4.7% q-o-q sa in Q4 2012, reversing the decline witnessed in Q3. Despite the year-end upturn, global chip sales dipped by 2.7% for 2012 as a whole, recording the first full-year contraction since 2009. Sales were weighed down by a sharp decline in Eurozone demand, reflecting moribund business sentiment in the region.
The sequential gains in Q4 were driven by a pickup in both corporate and consumer IT spending in the advanced and emerging economies. Notably, IT expenditure by US firms rose by a robust 15% q-o-q sa during Q4, whilst retail spending on electronics in China remained firm at 9.1%.
While final IT demand saw nascent signs of a turnaround in Q4, such gains have yet to filter significantly through to the midstream segment. The level of semiconductor inventories remained elevated, accounting for 49% of revenue towards the end of 2012 (according to estimates by IHS iSuppli).
Forward-looking indicators could signal a trough in the electronics cycle.
Source: CEIC
Barring a severe downturn in the global economy in the coming quarters, the nascent resumption in final IT demand should gradually gain traction towards the second half of 2013. Forward-looking indicators of technology spending in the US and China continued to signal improvement in the electronics cycle. The uptick in final demand will in turn spill over to the midstream and upstream segments. Indeed, notwithstanding the inventory overhang, overall chip prices have started to show signs of stabilisation recently. Accordingly, demand in the upstream segment witnessed a gradual recovery as the SEMI book-to-bill ratio in January exceeded parity for the first time since mid-2012. Against this backdrop, the global IT industry is expected to see muted growth in the first half of 2013, before a more decisive upturn in the latter half of the year.
64 68 72 76 80 92 96 100 104 108 2010 2011 2012 U S $ B ill io n , S A In d e x ( Q 1 2 0 1 0 = 1 0 0 ) Q4 Global Chip Sales Value (RHS) Ave Semiconductor Price (LHS)
2009 2010 2011 2012 2013 140 145 150 155 160 165 170 -30 -20 -10 0 10 20 30 In d e x D if fu si o n I n d e x US Future Tech Spending (LHS) China Entrepreneur Expectation Indicator (IT)
(RHS)
B. Domestic Developments
The Singapore economy expanded modestly in Q4 2012
As tail risks in the global economy receded, Singapore’s GDP grew by 3.3% q-o-q saar in Q4 2012, following a contraction of 4.6% in the previous quarter. The expansion was broad-based across the economy. On the external front, renewed vigour in regional economies lent support to manufacturing, trade-related and tourism-related services. Meanwhile, domestic-oriented activities, such as bank lending and retail spending, continued to turn in firm growth in Q4 2012. For the whole of 2012, the Singapore economy grew by 1.3%.
The increase in external demand was reflected in a 2.7% q-o-q sa rise in Singapore’s domestic exports in Q4 2012, following two quarters of contraction. Oil shipments, particularly to China, underpinned this turnaround as Chinese factory production and infrastructure spending gathered pace. Non-electronics exports, such as shipments of transport equipment and vehicle-related manufactures, also provided some support. However, domestic electronics exports remained weak as the midstream segment continued to be held back by an inventory overhang.
Correspondingly, in the manufacturing sector, output rose by a modest 1.8% q-o-q sa in Q4, following a sharp decline of 5.7% in Q3. The divergence in performance between electronics and non-electronics was also evident in manufacturing activity, where a surge in pharmaceuticals output had supported the latter.
Output of non-electronics expanded in Q4 2012.
Alongside the pick-up in industrial production, trade-related services recorded a small uptick. Within the transport & storage industry, sea cargo grew by 1.0% q-o-q sa in Q4 on increased shipments of bulk cargo. In the wholesale trade sector, the foreign wholesale trade index1 rose by 1.1% q-o-q sa in Q4, reversing a dip of 0.1% in the preceding quarter. This reflected the mild improvement in regional trade flows, which lifted wholesale trade activity in the telecommunication devices, computers and electronic components segments.
1 The foreign WTI pertains to wholesale sales outside Singapore, and it comprises of domestic exports, re-exports,
transhipment cargo and offshore merchandise.
2007 2008 2009 2010 2011 2012 60 80 100 120 140 160 180 In d e x ( Q 1 2 0 0 7 = 1 0 0 ), S A Non-electronics Overall IIP Electronics Q4
Hotel occupancy rates remained robust.
Source: EPG, MAS estimates
Following the upturn in the Asia ex-Japan economies, regional demand for services posted a strong performance. In particular, the tourism-related segment saw a recovery. Air passenger arrivals rebounded by 1.8% q-o-q sa in Q4, from -0.5% in the preceding quarter, on the back of higher Chinese and South-east Asian visitors.
Notwithstanding an increase in hotel rooms, hotel operators reported healthy occupancy rates of around 85%, with average room rates trending upwards by 1.8% compared to the quarter before. Meanwhile, non-bank loan growth to East Asia accelerated in Q4 to 4.0% q-o-q from 3.4% in the previous quarter, contributing to about half of the gains in offshore non-bank lending.
The domestic sector also stayed relatively resilient. While the construction sector posted a small contraction of 3.9% q-o-q saar in Q4, activity levels remained elevated following three quarters of strong expansion. The modest drop in output reflected mainly the dip in private sector construction output, which was in turn due to the completion of several commercial and industrial buildings towards the end of 2012.
Consumer spending continued to hold up, with non-vehicle retail sales growing by 1.2% q-o-q sa in Q4 on the back of buoyant discretionary purchases of electronic gadgets and other consumer durables. Correspondingly, credit card spending rose by 6.2% q-o-q, the fastest increase recorded since Q4 2011. Mortgage-related loan growth also strengthened for the second sequential quarter by 4.8% q-o-q as compared to 3.8% in Q3 2012. 175 200 225 250 275 300 80 82 84 86 88 90 2010 2011 2012 S $ , S A P e r C e n t, S A
Occupancy Rate (LHS) Room Rates (RHS)
The domestic economy is expected to expand by 1-3% in 2013
While prospects for the global economy appear to have improved, a decisive recovery is not a foregone conclusion. Economic conditions remain challenging in advanced economies. Although recent central bank actions have lifted sentiment in financial markets, these measures have yet to impart a self-sustaining impetus to the real sectors in the G3 economies. Turning to the domestic economy, activity in the externally-oriented industries such as manufacturing and wholesale trade is thus likely to remain subdued in the near term.
In comparison, domestic-oriented activities are likely to remain firm. The construction sector in particular could see significant expansion this year, in view of a strong pipeline of projects awarded over the last few years. This could create positive spillovers for activities such as bank lending and real estate services.
The construction sector will benefit from a strong pipeline of projects awarded in recent years.
On balance, barring a further deterioration in the external environment, the Singapore economy is forecast to record growth of 1-3% in 2013. Activity is likely to remain modest in H1, especially in the externally-exposed industries, before picking up in the latter half of the year alongside a strengthening of the global economy. 0 5 10 15 20 25 30 35 40 2000 2002 2004 2006 2008 2010 2012 S $ B ill io n (2000-12)Average
C. Labour Market and Consumer Prices
Employment growth edged up in 2012
Overall employment expanded by an estimated 44,500 in Q4 2012, up from 26,200 in Q3 2012. Notably, hiring picked up in the services sector for the year-end festive season, while the construction sector continued to see strong headcount additions on the back of government-related infrastructure projects. In comparison, employment gains in the manufacturing sector fell from 3,700 in Q3 to 600 in Q4, led by slower job creation in the petrochemicals cluster.
For the year as a whole, overall employment rose by 129,600 in 2012, exceeding the 122,600 jobs created in 2011. Local employment grew by 59,200 last year, substantially higher than the increase of 37,900 in 2011. As a result, the resident employment rate reached a record high of 64%.
Consequently, the labour market remained tight, with the overall unemployment rate falling to a five-year low of 1.8% in Q4. Nonetheless, with the weak economic outlook weighing on employers’ sentiment, nominal resident wage growth moderated to 2.5% y-o-y in Q4, compared with 3.1% in Q3.
The unemployment rate fell in Q4.
CPI-All Items inflation slowed in recent months
CPI-All Items inflation came in slightly lower at 4.0% in Q4 2012 from 4.2% in Q3, mainly due to benign external price influences. Notably, domestic oil-related items and food saw more moderate price increases, as global commodity price pressures subsided with the easing of geopolitical tensions in the Middle-East, while the widely expected weather-related supply disruptions associated with El Nino did not materialise. On the domestic front, services inflation was stable at 2.8% amidst sustained labour market tightness. Accommodation cost inflation edged down slightly on account of the smaller increase in residential property rentals, while private road transport cost rose at a faster pace due to sharply higher COE premiums. 2007 2008 2009 2010 2011 2012 1.2 1.6 2.0 2.4 2.8 3.2 3.6 -20 0 20 40 60 80 100 P e r C e n t, S A C h a n g e s in E m p lo y m e n t (' 0 0 0 )
Goods Producing Industries (LHS) Services Industry (LHS) Unemployment Rate (RHS)
Excluding the costs of accommodation and private road transport, MAS Core Inflation fell from 2.4% in Q3 2012 to 2.0% in Q4, reflecting the more moderate external price increases. For the full year, CPI-All Items inflation fell from 5.2% in 2011 to 4.6% in 2012, while MAS Core Inflation picked-up slightly from 2.2% to 2.5% over the same period.
In January 2013, CPI-All Items inflation slowed further to 3.6%. Except for private road transport, all other major categories recorded smaller price increases partly because of base effects. Notably, food inflation moderated from 1.5% in December 2012 to 1.0% in January, mainly on account of the higher base in January 2012 from the seasonal rise in food prices during the Chinese New Year.
Both CPI-All Items inflation and MAS Core Inflation came in lower in Q4 and January 2013.
Oil-related items saw the first year-on-year price decline since December 2009 in line with the weakness in global oil prices. Services inflation also edged down led by slower increases in public transport and healthcare costs.2 Reflecting this, MAS Core Inflation eased from 1.9% in December 2012 to 1.2% in January.
Given the generally subdued conditions in the global economy, imported inflation will be broadly benign in the coming months. However, the persistent tightness in the domestic labour market will support wage increases in 2013, some which will continue to be passed through to consumer prices. Taking these factors into account, MAS Core Inflation is expected to average 2-3% in 2013.
CPI-All Items inflation will remain elevated, with month-to-month fluctuations, reflecting significant contributions from car prices and imputed rentals on owner-occupied accommodation. For the whole of 2013, CPI-All Items inflation is likely to be 3.5-4.5%. Accommodation and private road transport costs will together account for around 60% of CPI-All Items inflation, while prices of commodity-related items and services will each contribute around one-fifth.
2 Notably, the increase in taxi fares slowed considerably from 9.0% y-o-y in December 2012 to 0.4% in January 2013 as the
base effects associated with the upward adjustment in taxi fares in January 2012 dissipated.
2008 2009 2010 2011 2012 2013 -2 0 2 4 6 8 % Y O Y MAS Core Inflation CPI-All Items Inflation Jan
D. Balance of Payments
The overall balance of payments surplus reached $33 billion in 2012
The surplus in the overall balance of payments rose to $14 billion in Q4 2012, from $7.8 billion in Q3. For 2012 as a whole, the balance of payments surplus rose to $33 billion, from $21 billion in 2011, reflecting a smaller net outflow from the capital and financial account. Singapore’s official foreign reserves rose to $317 billion as at the end of 2012, equivalent to 8.0 months of merchandise imports.
The current account surplus narrowed by $4.2 billion to $13 billion in Q4. For 2012 as a whole, the current account surplus fell to $64 billion (19 per cent of GDP), from $82 billion in 2011 (25 per cent of GDP). This was largely due to the decline in the goods surplus, as imports rose and exports contracted. The deficits in the primary and secondary income balances also widened, while the services surplus narrowed slightly, reflecting in part lower net receipts from maintenance and repair services on ships and aircraft owned by non-residents.
… but was offset by the fall in the financial account deficit.
The surplus in the overall balance of payments rose in Q4.
The current account surplus narrowed ...
The deficit in the financial account shrank sharply to $0.5 billion in Q4, from $8.9 billion in Q3. For the full year, net outflows narrowed to $36 billion (10 per cent of GDP), significantly below the $56 billion recorded in 2011 (17 per cent of GDP). This was due to the reversal from a large net outflow to a small net inflow of “other investment”, and an expansion in net direct investment inflow. Together, this more than offset the increase in net outflows from portfolio investment and financial derivatives. 2007 2008 2009 2010 2011 2012 -50 -40 -30 -20 -10 0 10 20 30 40 S $ B ill io n
Direct Investment Portfolio Investment Other Investment Financial Derivatives Financial Account Q4 2007 2008 2009 2010 2011 2012 -30 -20 -10 0 10 20 30 S $ B ill io n
Financial Account Current Account Overall Balance Q4 2007 2008 2009 2010 2011 2012 -10 0 10 20 30 S $ B ill io n
Goods Balance Services Balance Primary Income Balance Secondary Income Balance Current Account
E. Macroeconomic Policies
In October last year, MAS reaffirmed the monetary policy stance adopted in April 2012
i) Monetary Policy
The Singapore economy is forecast to expand at a modest pace in 2012 and 2013, given the likely extended period of slow growth in the global economy. Nevertheless, the domestic economy is expected to stay at full employment alongside supply-side constraints, especially in the labour and housing rental markets. As a result, slightly stronger wage and other cost increases are envisaged in 2013, which will continue to be passed through to consumer prices.
MAS maintained the monetary policy stance in October 2012.
Thus, MAS kept the S$NEER policy band on a modest and gradual appreciation path in October 2012, with no change to its slope, level or width. This monetary policy stance is assessed to be appropriate for containing inflationary pressures and keeping the economy on a path of restructuring towards sustainable growth. MAS will continue to keep a close watch on external economic and financial developments and assess their impact on the Singapore economy.
The FY 2013 Budget is focused on supporting the economy’s restructuring and achieving more equitable growth over the longer term
ii) Fiscal Policy
The overall budget for FY2012 is estimated to have recorded a surplus of $3.9 billion (1.1% of GDP), higher than the $1.3 billion projected in last year’s Budget. This was largely due to higher revenue from stamp duties and vehicle quota premiums, as the housing market remained firm while COE prices reached record highs during the year.
Budget 2013 builds on the restructuring efforts put in place since Budget 2010, with additional initiatives for businesses to upgrade, create better jobs, and raise wages under the “Quality Growth Programme”. Foreign worker policies were tightened further via higher foreign worker levies, lower dependency ratio ceilings, and more stringent eligibility requirements for the S Pass and Employment Pass, with the
92 96 100 104 108
Apr Jul Oct Jan Apr Jul Oct
In d e x ( 4 -8 A p r 2 0 1 1 A v e ra g e = 1 0 0 ) 2011 Appreciation Depreciation
indicates release of Monetary Policy Statement
least productive sectors that rely most heavily on low-skilled foreign workers being hit the hardest. To ease the burden of restructuring for businesses, a three-year Transition Support Package was also put in place. A key feature of this package is the Wage Credit Scheme, whereby firms are encouraged to share the benefits of productivity gains with workers in the form of wage increases co-funded by the government. Firms were also given rebates on corporate income taxes and road taxes on commercial vehicles, as well as a dollar-for-dollar matching cash bonus if they spend at least $5,000 in productivity investments under the Productivity and Innovation Credit (PIC) scheme. More generally, programmes to help match the needs of firms and trade associations with productivity solutions providers were introduced.
In order to promote more inclusive growth, the 2013 Budget implemented measures to enhance social mobility and reduce income inequality. It provided for comprehensive reforms to the pre-school sector, such that interventions to level the playing field for all school-going children can be made as early as possible. The Workfare Income Supplement Scheme was enhanced with wider coverage and larger payouts to offer targeted assistance to the elderly and low-income workers. The property tax structure was also made more progressive, while a tiered Additional Registration Fee (ARF) system was put in place such that purchasers of more expensive cars pay higher rates. Finally, the Budget had measures to ease the cost of living for households, with one-off special increases in GST Voucher payments, S&CC rebates, Medisave top-ups, and personal income tax rebates. For FY2013, the government has projected a small basic surplus of $0.3 billion (0.1% of GDP), and an overall budget surplus (which include top-ups to trust and endowment funds and net investment returns contribution) of $2.4 billion (0.7% of GDP).
Summary of Fiscal Position
FY 2011 FY 2012 Revised FY 2013 Budgeted
$billion % of GDP $billion % of GDP $billion % of GDP
Operating Revenue 51.1 15.2 55.2 16.1 55.0 14.9 Total Expenditure 46.6 13.8 50.1 14.6 53.4 14.5 Operating Expenditure 35.2 10.4 37.2 10.8 40.6 11.0 Development Expenditure 11.4 3.4 12.9 3.8 12.8 3.5 Primary Surplus/Deficit (-) 4.5 1.3 5.1 1.5 1.6 0.4 Less: Special Transfers Excluding Top-ups to Endowment and Trust Funds 2.9 0.9 1.5 0.4 1.3 0.4 Basic Surplus/Deficit (-) 1.6 0.5 3.6 1.1 0.3 0.1 Less: Top-ups to Endowment and Trust Funds 5.5 1.6 7.4 2.2 5.6 1.5 Add: NIR Contribution 7.9 2.4 7.7 2.2 7.7 2.1 Budget Surplus/Deficit (-) 4.0 1.2 3.9 1.1 2.4 0.7
Note: Figures may not tally due to rounding Source: Ministry of Finance
Selected Indicators
Land Area (Sq km) 715.8 Literacy Rate* (%) 96.4
Total Population ('000) 5,312.4 Real Per Capita GDP (US$) 45,973
Labour Force ('000) 3,361.8 Gross National Savings (% of GNI) 46.1
Resident Labour Force Participation Rate (%) 66.6
* Refers to resident population aged 15 years and over.
COMPONENTS OF NOMINAL GDP SECTORAL (% of GDP), 2012
COMPONENTS OF NOMINAL GDP EXPENDITURE (% of GDP), 2012
Manufacturing 20.7 Private Consumption 39.2
Finance & Insurance 11.9 Public Consumption 9.7
Business Services 14.6 Private Gross Fixed Capital Formation 20.0
Construction 4.4 Public Gross Fixed Capital Formation 4.1
Transportation & Storage 7.7 Increase in Stocks 2.9
Information & Communications 3.8 Net Exports of Goods & Services 22.2
Wholesale & Retail Trade 17.0 Statistical Discrepancy 1.9
Accommodation & Food Services 2.5
MAJOR EXPORT DESTINATIONS (% SHARE), 2012
MAJOR ORIGINS OF IMPORTS (% SHARE), 2012
Total Exports (S$ Billion) 510.3 Total Imports (S$ Billion) 474.6
Malaysia 12.3 Malaysia 10.6
Hong Kong 11.0 China 10.3
China 10.8 US 10.2
Indonesia 10.6 South Korea 6.7
US 5.4 Taiwan 6.7
ASEAN 31.8 ASEAN 21.0
NIEs 18.6 NIEs 14.2
EU 8.9 EU 12.5
Source: IE Singapore
MAJOR DOMESTIC EXPORTS BY COMMODITY (% SHARE), 2012
MAJOR IMPORTS
BY COMMODITY (% SHARE), 2012
Domestic Exports (S$ Billion) 285.1 Total Imports (S$ Billion) 474.6
Mineral Fuels 37.5 Mineral Fuels 32.6
Electronics 21.0 Electronics 24.8
Chemicals 17.8 Machinery & Transport Equipment (ex. Electronics) 16.6
Machinery & Transport Equipment (ex. Electronics) 9.7 Manufactured Articles 7.2
Manufactured Articles 8.2 Chemicals 6.8
Manufactured Goods 2.1 Manufactured Goods 6.2
Source: IE Singapore
OVERALL ECONOMY 2011 2012 Q3 11 Q4 11 Q1 12 Q2 12 Q3 12 Q4 12 Dec-12 Jan-13
GDP at current prices (S$ bil) 334.1 345.6 83.1 85.5 85.8 86.2 85.2 88.3 na na GDP (US$ bil) 265.6 276.5 67.8 66.4 67.9 68.2 68.3 72.2 na na Real GDP Growth (YOY % change) 5.2 1.3 5.7 3.6 1.5 2.3 0.0 1.5 na na Real GDP Growth (QOQ SAAR % change) na na 3.4 -2.3 7.8 0.1 -4.6 3.3 na na
By Sector (YOY % change):
Manufacturing 1/ 7.8 0.1 8.9 9.3 -1.2 4.1 -1.4 -1.1 1.3 -0.4
Electronics 2/ -12.8 -11.3 -23.1 -23.9 -17.2 -8.4 -8.3 -10.5 -16.8 -3.4 Non-electronics 2/ 22.3 6.1 35.2 35.5 8.3 10.6 1.9 4.1 9.8 0.9 Finance & Insurance 8.9 0.5 13.5 -0.1 0.9 0.7 -2.9 3.3 na na Business Services 3.0 3.9 3.1 2.6 3.6 4.8 4.0 3.3 na na Construction 6.3 8.2 10.1 9.2 9.4 11.4 6.7 5.8 na na Transportation & Storage 3.8 2.7 4.2 1.7 4.3 1.7 1.7 3.2 na na Information & Communications 3.6 2.6 5.4 1.8 3.8 1.8 1.1 3.8 na na Wholesale & Retail Trade 1.6 -0.7 -0.3 2.5 -0.3 -0.7 -0.2 -1.5 na na Accommodation & Food Services 8.2 2.8 7.8 3.7 4.2 2.7 2.1 2.2 na na
By Expenditure Component (YOY % change):
Consumption 3.7 0.9 5.6 0.6 2.1 1.1 -0.1 0.7 na na Private 4.6 2.2 6.1 2.7 4.7 1.6 0.5 2.0 na na Public 0.5 -3.6 3.8 -6.4 -4.4 -2.0 -2.4 -4.6 na na Gross Fixed Capital Formation 6.3 6.6 13.9 4.3 23.7 3.7 -3.8 5.8 na na Private 5.2 6.9 14.3 3.4 30.2 3.0 -5.5 5.2 na na Public 12.3 5.3 11.7 9.6 -0.7 7.8 5.9 9.2 na na External Demand 3.5 0.3 1.4 1.6 2.6 2.7 -2.1 -1.9 na na
TRADE
Total Exports, fob (YOY % change) 7.5 -0.9 4.7 5.8 4.8 1.4 -4.2 -5.1 -13.8 2.2 Non-Oil Domestic Exports 2.2 0.5 -1.2 -2.7 6.0 3.7 -3.2 -4.2 -16.3 0.5 Re-Exports 1.4 -3.5 -5.7 2.2 -1.3 -4.1 -0.2 -8.1 -13.3 6.9 Total Imports, cif (YOY % change) 8.6 3.2 6.2 9.9 10.5 4.6 -1.3 -0.4 -1.5 0.6
WAGE-PRICE INDICATORS
Unemployment Rate (SA,%) 2.0 2.0 2.0 2.0 2.1 2.0 1.9 1.8 na na Average Nominal Wages (S$ per month) 4,334 4,433 3,956 4,655 4,717 4,162 4,078 4,773 na na Consumer Price Index Inflation (YOY % change) 5.2 4.6 5.5 5.5 4.9 5.3 4.2 4.0 4.3 3.6 MAS Core Inflation (YOY % change) 2.2 2.5 2.2 2.4 3.1 2.7 2.4 2.0 1.9 1.2
FINANCIAL INDICATORS 3/ S$ Exchange Rate Against: (end-period)
US Dollar 1.3007 1.2221 1.3003 1.3007 1.2572 1.2737 1.2254 1.2221 1.2221 1.2389 100 Japanese Yen 1.6777 1.4214 1.6975 1.6777 1.5321 1.6056 1.5799 1.4214 1.4214 1.3631 Euro 1.6835 1.6151 1.7593 1.6835 1.6782 1.6023 1.5844 1.6151 1.6151 1.6816 Interest Rates (end-period, % p.a.)
3-month Fixed Deposit Rate 0.14 0.14 0.16 0.14 0.13 0.14 0.14 0.14 0.14 0.14 3-month Domestic Interbank Rate 0.38 0.38 0.25 0.38 0.38 0.38 0.38 0.38 0.38 0.38 Prime Lending Rate 5.38 5.38 5.38 5.38 5.38 5.38 5.38 5.38 5.38 5.38 Money Supply (end-period)
Broad Money, M2 (YOY % change) 10.0 7.2 11.2 10.0 9.7 6.5 6.1 7.2 7.2 8.5 Straits Times Index (end-period) 2,646.4 3,167.1 2,675.2 2,646.4 3,010.5 2,878.5 3,060.3 3,167.1 3,167.1 3,282.7 YOY % change -17.0 19.7 -13.6 -17.0 -3.1 -7.8 14.4 19.7 19.7 12.9
GOVERNMENT BUDGET 4/
Operating Revenue (S$ mil) 50,986 54,284 14,113 11,391 12,001 14,700 14,554 13,030 na na Total Expenditure (S$ mil) 46,771 47,271 11,160 11,221 15,590 9,149 10,745 11,787 na na Operating Expenditure 35,011 34,810 8,165 8,415 12,088 6,055 8,113 8,555 na na Development Expenditure 11,761 12,461 2,995 2,806 3,502 3,094 2,632 3,232 na na Primary Surplus/Deficit (S$ mil) 4,214 7,013 2,953 171 -3,589 5,551 3,809 1,243 na na % of GDP 1.3 2.0 3.6 0.2 -4.2 6.4 4.5 1.4 na na
BALANCE OF PAYMENTS
Current Account Balance (% of GDP) 24.6 18.6 25.9 23.7 20.8 19.3 19.9 14.5 na na Goods Balance 27.4 22.0 27.6 28.3 22.4 23.3 24.2 18.4 na na Services Balance 0.3 0.1 1.3 -0.3 1.1 -0.5 0.1 -0.1 na na Primary Income Balance -0.8 -1.1 -0.8 -2.0 -0.2 -1.3 -1.9 -1.1 na na Secondary Income Balance -2.2 -2.4 -2.3 -2.3 -2.4 -2.2 -2.5 -2.6 na na Capital & Fin Account Balance (% of GDP) -16.6 -10.3 -12.0 -22.1 -15.4 -15.0 -10.4 -0.6 na na Direct Investment 11.2 12.1 14.2 11.6 12.5 10.7 13.5 11.9 na na Portfolio Investment -4.8 -17.8 -22.6 7.1 -14.0 -10.3 -20.4 -26.3 na na Financial Derivatives -4.5 -5.8 -5.4 -3.6 -4.9 -5.0 -6.2 -6.9 na na Other Investment -18.5 1.1 1.8 -37.4 -8.9 -10.4 2.7 20.6 na na Overall Balance (% of GDP) 6.4 9.4 12.1 -0.4 7.4 5.6 9.2 15.3 na na Official Foreign Reserves (US$ mil) 5/ 237,737 259,307 233,621 237,737 243,583 243,383 252,148 259,307 259,307 258,844 Months of Imports 7.8 8.2 7.9 7.8 7.8 7.7 8.1 8.2 8.2 8.1
Source:
1/
Monthly data from Index of Industrial Production, EDB
2/
Data from Index of Industrial Production, EDB
3/
Straits Times Index from SGX. All other indicators from MAS.
4/ Ministry of Finance 5/
MAS na: Not available