Evaluation of the
Washington State
Target Zero Teams
Project
DISCLAIMER
This publication is distributed by the U.S. Department of Transportation, National Highway Traffic Safety Administration, in the interest of information exchange. The opinions, findings, and conclusions expressed in this publication are those of the authors and not necessarily those of the Department of Transportation or the National Highway Traffic Safety Administration. The United States Government assumes no liability for its contents or use thereof. If trade or manufacturers’ names or products are mentioned, it is because they are considered essential to the ob-ject of the publication and should not be construed as an endorsement. The United States Government does not endorse products or manufacturers.
Suggested APA Format Citation:
Thomas, F. D., Blomberg, R. D., Masten, S. V., Cicchino, J., Tippets, A. S., Korbelak, K. T., Fell, J. C., & Lacey, J. H. (2015, January). Evaluation
the of Washington State Target Zero Teams project. (DOT HS 812 097).
Technical Report Documentation Page
1. Report No.
DOT HS 812 097 2. Government Accession No. 3. Recipient’s Catalog No. 4. Title and Subject
Evaluation of the Washington State Target Zero Teams Project
5. Report Date January 2015
6. Performing Organization Code 251
7. Authors
F. Dennis Thomas, Richard D. Blomberg, Scott Masten,1 Jessica Cicchino,2 Scott Tippetts, Kristopher T. Korbelak, James Fell,3 and John Lacey3
8. Performing Organization Report No. 251-2
9. Performing Organization Name and Address Dunlap and Associates, Inc.
110 Lenox Avenue Stamford, CT 06906
10. Work Unit No. (TRAIS) 11. Contract or Grant No.
DTNH22-09-D-00138, Task Order 1 12. Sponsoring Agency Name and Address
National Highway Traffic Safety Administration Office of Behavioral Safety Research, NTI-131 1200 New Jersey Avenue SE.
Washington, DC 20590
13. Type of Report and Period Covered Final Report
5/4/10– 7/3/13
14. Sponsoring Agency Code 15. Supplementary Notes
Scott Masten1 is with Compass Statistical Consulting. Jessica Cicchino is with the Insurance Institute of Highway Safety (formerly with NHTSA).2 James Fell and John Lacey3 are with PIRE. Dereece Smither was the NHTSA Project Manager.
16. Abstract
As part of its “Target Zero” strategic highway safety plan that has the goal to reduce traffic fatalities in Washington to zero by the year 2030, the State of Washington established three detachments of Washington State Patrol (WSP) troopers to focus on nighttime impaired-driving offenses. These detachments stationed in King, Pierce, and Snohomish counties were named Target Zero Teams (TZT). Each included one sergeant and six troopers funded by the Washington Traffic Safety Commission (WTSC). It is important to note that Snohomish also served as the pilot site for the successful Night Emphasis Enforcement Team (NEET) project that began in late 2006 and was the model for the TZT program. In addition to the WSP detachments, the TZT program also involved local law enforcement on overtime funded by WTSC. Researchers chose 3 other counties in Washington (Clark, Spokane, and Yakima) to serve as comparison sites since they did not have any formal, WTSC-funded TZT activities taking place. Overall, during the TZT period, there were notable countywide net increases in the number of DUI arrests by troopers in the TZT counties with Pierce increasing 47.21 percent, King 13.63 percent, and Snohomish 13.28 percent. The Snohomish increase is noteworthy since it represents a net gain above and beyond that achieved by the NEET program. The TZT detachments in King, Pierce, and Snohomish showed significantly higher percentages of trooper contacts resulting in DUI arrests (15.38%, 10.83%, and 9.78% respectively) than the non-TZT troopers in those counties (1.75%, 2.02, and 1.61%), and WSP troopers in the comparison counties (2.56%, 1.98%, and 1.91%) and the rest of the State (1.22%). The study results suggested that TZT led to reduced non-fatal crashes of all types in Pierce County, reduced crashes of some types in King County, but limited crash reductions in Snohomish County where the NEET program had already achieved significant reductions as reported previously by WTSC. Results showed that relative to the comparison counties the TZT counties had a reduction of 24.8 percent in driver alcohol involvement (BAC > .01) in fatal crashes and a relative reduction of 22.4 percent for high driver BAC (BAC > .15) involvement in fatal crashes. Using conservative assumptions, researchers compared projected driver alcohol-involved fatality data with observed fatality data to estimate that TZT saved 11 lives that would have been lost in driver alcohol-involved crashes in the TZT counties if TZT had not been in operation. Based on these fatalities avoided alone, TZT was highly cost-effective. Overall, the study results suggest the TZT approach markedly increased the DUI enforcement productivity of the law enforcement agencies in the intervention counties which led to safety gains in these counties during the study time period.
17. Key Words
Target Zero Teams TZT DUI DWI Drunk Driving Crashes
Enforcement Driving Under the Influence
18. Distribution Statement
Document is available to the public from the National Technical Information Service www.ntis.gov
19. Security Classif. (of this report)
Unclassified
20. Security Classif. (of this page) Unclassified
21. No. of Pages 67
22. Price
ii
ACKNOWLEDGEMENTS
The authors acknowledge the extensive support received from the Washington Traffic Safety Commission (WTSC) and the various agencies in Washington State who provided evaluation data. This study would not have been possible without their cooperation and hard work.
The opinions, findings, and conclusions expressed in this publication are those of the authors and do not necessarily reflect the views of the National Highway Traffic Safety Administration or the above listed contributors.
Table of Contents
Executive Summary ... vi
Background ... 1
The Target Zero Teams Program ... 2
The NEET Program ... 3
Expansion of NEET Program to TZT ... 3
Geo-Mapping Crashes and Arrests to Guide Enforcement ... 5
Objective ... 7
Methods, Analyses, and Results ... 7
Citation/Law Enforcement Activity Data ... 7
TZT trooper activity data ... 7
Local law enforcement activities ... 13
AOC data ... 14
Special prosecution staff ... 20
Media Activities ... 20
Paid media ... 22
Earned media ... 23
Statewide Crash Data ... 24
Crude crash rates ... 25
Total crashes ... 25 Nighttime crashes ... 25 Daytime crashes ... 26 Injury crashes ... 26 Single-vehicle crashes ... 26 Multi-vehicle crashes ... 26
Single-vehicle nighttime crashes ... 26
Summary of crash findings ... 26
Driver BACs ... 28
Driver Alcohol Involvement in Fatal Crashes ... 31
Driver BACs ≥ .01 in fatal crashes ... 32
Driver BACs ≥ .15 in fatal crashes ... 33
Driver alcohol-involved fatalities avoided ... 34
Summary of driver alcohol involvement in fatal crashes ... 34
Public Awareness and Self-Reported Behavior ... 35
Cost/Benefit to State ... 41
Discussion ... 43
References ... 46
iv
List of Tables
County Characteristics ... 4 Table 1.
WSP DUI Arrests by County for TZT and Non-TZT Troopers ... 9 Table 2.
Net Change in Number of WSP DUI Arrests During TZT by County ... 10 Table 3.
WSP Warnings by County for TZT and Non-TZT Troopers ... 11 Table 4.
WSP Speeding Citations by County for TZT and Non-TZT Troopers ... 12 Table 5.
Local Law Enforcement Hours Worked on TZT ... 13 Table 6.
Local Law Enforcement Contacts, Citations, and Arrests ... 14 Table 7.
WTSC Paid DUI Media Campaigns During TZT ... 22 Table 8.
Earned Media by Type ... 23 Table 9.
ARIMA Results Comparing Crash Rates per 100,000 Population Before and Table 10.
After Target Zero Team Implementation ... 27 Crude Monthly BAC Tests Administered and Mean BACs in TZT and
Table 11.
Comparison Counties, January 2006–June 2012 ... 29 ARIMA Results Comparing Monthly BAC Tests Administered and Mean
Table 12.
BACs Before and After Target Zero Team Implementation ... 30 Modeling Approach for Driver Alcohol Involvement in Fatal Crashes ... 32 Table 13.
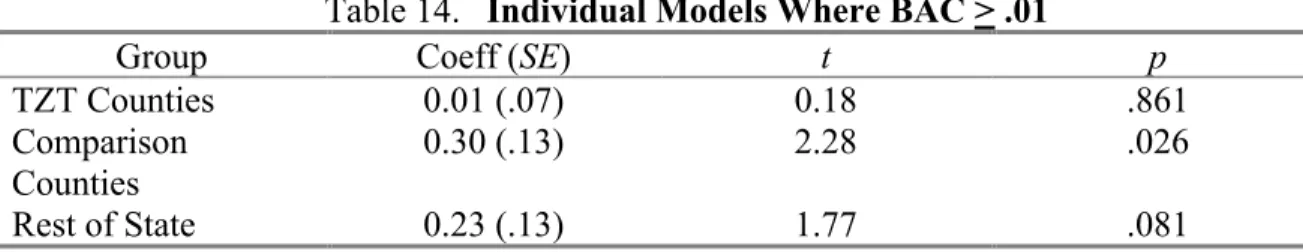
Individual Models Where BAC ≥ .01 ... 32 Table 14.
BAC ≥ .01, Contrasts Between TZT Counties and Other Groups ... 32 Table 15.
Covariate Model Where BAC ≥ .01 ... 33 Table 16.
Individual Models Where BAC ≥ .15 ... 33 Table 17.
BAC ≥ .15, Contrasts Between TZT Counties and Other Groups ... 33 Table 18.
Covariate Model for BAC ≥ .15 ... 34 Table 19.
Number Of Surveys Collected ... 37 Table 20.
In The Last 30 Days, Have You Noticed Increased Police Traffic Enforcement Table 21.
In This Area? ... 38 Percentage Who Heard or Saw Message by Media Type ... 39 Table 22.
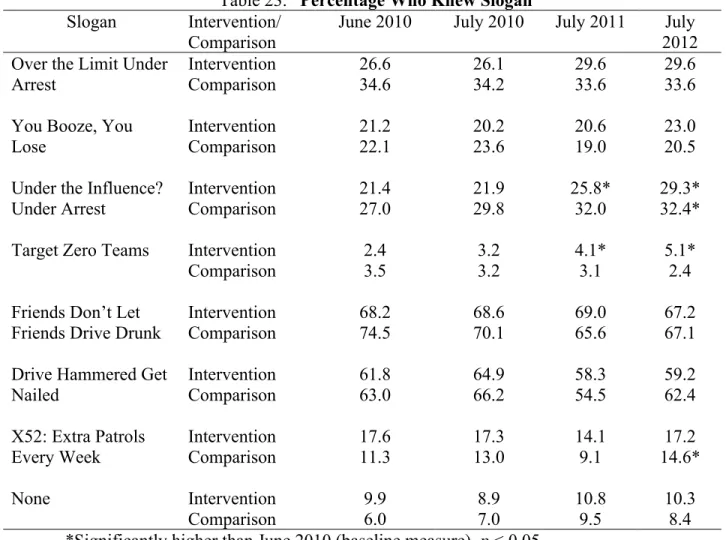
Percentage Who Knew Slogan ... 40 Table 23.
TZT Total Cost and Major Cost Components ... 42 Table 24.
Dollars Saved by TZT and Benefit to Cost Ratios ... 42 Table 25.
List of Figures
TZT Counties and Comparison Counties ... 4 Figure 1.
Example of Hot Spot Mapping ... 6 Figure 2.
Average Number of DUI Citations by County ... 16 Figure 3.
Average Number of Days From Citation to Court Filing by County ... 17 Figure 4.
Average Number of Superior Court DUI Cases by County ... 18 Figure 5.
Average Number of Days From Citation to Court Filing by County ... 19 Figure 6.
Screenshot of TZT Mention in Choose Your Ride Campaign ... 21 Figure 7.
DOL Awareness Questions ... 36 Figure 8.
vi
Executive Summary Background and Objectives
According to the National Highway Traffic Safety Administration, 9,878 people were killed during 2011 in crashes in which at least one driver had a blood alcohol concentration (BAC) of .08 grams per deciliter (g/dL) (NHTSA, 2012) . This represented 31 percent of the total motor vehicle traffic fatalities in the United States during that year, a decrease of 2.5 percent from 2010 when there were 10,136 fatalities in these alcohol-impaired crashes. The alcohol-impaired-driving fatality rate per 100 million vehicle miles traveled (VMT) remained the same from 2010 to 2011 at 0.34 (NHTSA, 2012). Despite a downward trend for several years in the raw number of fatalities, the above numbers show alcohol-impaired driving is still a major problem. As such, there have been numerous attempts across the country to reduce alcohol-impaired driving. Fell, McKnight, and Auld-Owens (2013) provide a review of the activities undertaken by communities at various levels to reduce alcohol-impaired driving. Many of the most successful programs relied on high visibility enforcement (HVE) and the use of
checkpoints. Such programs attempt to increase deterrence by elevating the driving public’s perceived risk of apprehension and sanctioning. Some States, however, cannot conduct sobriety checkpoints due to State statutes, court decisions, or other impediments. The State of
Washington is banned from using checkpoints. As a result, law enforcement agencies in Washington make widespread use of saturation and roving patrols rather than sobriety checkpoints for enforcing impaired-driving laws.
In late 2006, the Washington State Patrol (WSP) assembled a full-time, high-visibility saturation patrol called the Night Emphasis Enforcement Team (NEET). This pilot program, funded by the Washington Traffic Safety Commission (WTSC), included a four-trooper and one-sergeant detachment stationed primarily in Snohomish County, a suburb of Seattle that includes the City of Everett. The NEET detachment troopers focused their efforts almost exclusively on the enforcement of impaired driving and related traffic offenses (e.g., nonuse of seat belts and speed) on weekend nights and were relieved of their other routine duties while assigned to NEET. The NEET troopers were specially selected based upon their training, experience, and motivation in enforcing impaired driving laws. A NHTSA Research Note (Cicchino, 2012) indicated that traffic fatalities decreased by 40.3 percent in Snohomish County from 2005 (the year before the NEET program began) to 2008. In contrast, traffic fatalities in the same period decreased by only 17.7 percent in the remaining counties in Washington that did not have NEET patrols.
Washington expanded upon the NEET program by establishing three detachments of WSP troopers to focus on nighttime impaired-driving offenses. WTSC and the Washington State Patrol named these detachments Target Zero Teams (TZT) since they supported Washington’s “Target Zero” strategic highway safety plan that includes the goal to reduce traffic fatalities in Washington to zero by the year 2030. For this new TZT project, Washington deployed three detachments consisting of one sergeant and six troopers in each of the three largest counties in the State—King, Pierce, and Snohomish. In addition to the WSP detachments, the TZT program also involved local law enforcement funded by WTSC. These agencies received grant funding to conduct overtime enforcement focused on driving under the influence (DUI) offenses. For research purposes, researchers chose three counties (Clark, Spokane, and Yakima) to serve as comparison sites since they did not have any formal WTSC-funded TZT activities taking place.
NHTSA funded this evaluation effort independent from the TZT enforcement program. The evaluation focused on the program’s effectiveness in increasing DUI enforcement and whether TZT resulted in decreased alcohol-involved driving, crashes, and fatalities in the intervention counties in relation to the chosen comparison counties and statewide. The research objectives were to:
1. Evaluate the effectiveness of Washington State’s TZT project in King, Pierce, and Snohomish counties;
2. Assess public awareness and media coverage of the project;
3. Examine the degree of cooperation between TZT troopers and local law enforcement in TZT counties; and
4. Calculate the cost/benefit of the project to the State of Washington.
Method
The study effort was impact and outcome-focused. For the evaluation, researchers gathered information and data on:
• Citation and law enforcement activities (e.g., contacts, arrests, hours worked) from
o The WSP Trooper Time and Activity System (TAS),
o Local law enforcement grant reports, and
o Administrative Office of the Courts (AOC) records;
• Number of BAC tests conducted by WSP,
• Special prosecution activities,
• Earned and paid media,
• The timing of WTSC efforts to develop and implement the TZT program,
• Likely cost/benefit to the State,
• Crash data,
• Driver BAC data,
• Driver alcohol involvement in fatal crashes, and
• Public awareness.
Results
WSP DUI Arrests. During the TZT period the TZT detachments in King, Pierce, and Snohomish showed significantly higher percentages of trooper contacts resulting in DUI arrests (15.38%, 10.83%, and 9.78% respectively) than the non-TZT troopers in those same counties (1.75%, 2.02, and 1.61%), troopers in the comparison counties (2.56%, 1.98%, and 1.91%) and troopers in the rest of the State (1.22%). Overall, during the TZT period there were notable countywide net increases in the number of DUI arrests by troopers in the TZT counties with Pierce increasing 47.21 percent, King 13.63 percent, and Snohomish 13.28 percent (even after the foundation provided by the NEET project).
viii
DUI/Alcohol Arrests (0.10 per duty hour), Pierce County 521 (0.14 per duty hour), and Snohomish County 296 (0.07 per duty hour) across the 2-year TZT period.
Administrative Office of the Courts Records of DUI Citations/Arrests.
Administrative Office of the Courts (AOC) provided data on DUI citations/arrests for both the Courts of Limited Jurisdiction (CLJ) and Superior Courts in the entire State. Most notably for the CLJ data, King and Pierce counties showed an overall increase in citation activity when TZT efforts began while Snohomish stayed relatively stable compared to the 2-year period before when citations levels already had been elevated by the NEET efforts. The increases in King and Pierce tended to drop off slightly over time. This could be an artifact of the lag from the issuance of a citation to entry in AOC’s database or a possible decrease in impaired driving due to
deterrence created by TZT. The comparison counties showed virtually no change in citation activity after TZT began.
Earned and Paid Media. WTSC’s first year media plan did not include any paid radio or television advertisements, although it did include some billboard and bus advertising purchases. In the second year they integrated some TZT mentions into paid media activities, but the
activities primarily utilized variations of national messages. TZT most frequently generated newspaper coverage as well as significant television news coverage. TZT also generated social media coverage. The great majority of the earned media coverage appears to have taken place during the first year of the project while the paid campaigns were spread across the entire two years of the project.
Special Prosecution Staff. As part of the TZT program, WTSC funded additional prosecution staff in King and Snohomish counties. In Snohomish, an additional prosecutor was hired while multiple support staff members were added in King County. Reports documenting the numbers of TZT DUI arrests coming through the prosecutors’ offices were consistent with the data from the TAS system regarding trooper DUI arrest activities and AOC records. The reports suggest that many cases were pending and that charges were often reduced to negligent or reckless driving.
Public Awareness and Self-reported Behaviors. The Washington Department of Licensing (DOL) conducted an awareness survey of its customers. Many of the WTSC/DOL public awareness measures showed very little change. However, the intervention sites also showed a small, but significant increase in recognition of “Target Zero Teams,” but the highest rate achieved was 5.1 percent during July 2012. One item on the DOL survey suggests
respondents in the TZT counties may have reduced their driving while intoxicated. The item asked, “About how many times in the past 30 days did you drive when you thought you HAD
TOO MUCH TO DRINK?” The percentage saying “0” increased from 92.9 percent at baseline,
to 96.5 percent in July 2010, 96.4 percent in July 2011, and 96.7 percent in July 2012 at the intervention sites. The comparison sites did not show a similar increase.
Driver BACs. WSP’s Toxicology Division maintained a database of the measured BAC of all drivers who were required to complete a breath test. This includes all of the breath alcohol tests conducted in the State by both WSP and by local agencies since all breath tests must be processed on instruments owned and calibrated by WSP. The results of the analyses indicated that 14.4 percent more drivers were BAC tested in King County and 23.5 percent more in Pierce County after the program was implemented. The number of drivers BAC tested was not reliably different before-and-after the TZT program was implemented in Snohomish County despite the
increase in DUI arrests in the county. The results also indicated the mean BAC was lower in all three of the TZT counties after the program was implemented. Specifically, the mean BAC of tested drivers was 1.1 percent lower in King County (.135 to .133), 3.0 percent lower in Pierce County (.138 to .135), and 1.6 percent lower in Snohomish County (.134 to .132) while the mean BAC increased in the comparison counties by 0.7 percent (.142 to .143).
Crash Data. The Washington Department of Transportation (WDOT) provided the study with statewide crash data for the period from January 1, 2002, to May 30, 2012. The types of crashes examined from this data set included total, daytime, nighttime, single-vehicle,
multivehicle, injury, and single-vehicle at night. Driver-alcohol-involved fatal crashes were examined separately using data provided by WTSC. For all crash types examined, there were significant downward trends present before the start of TZT that the statistical analyses took into account. For total crashes the results indicated that after TZT began, and accounting for the decline already underway, total crashes decreased 7.1 percent in King County, 7.0 percent in Pierce County, and 3.8 percent across the TZT counties combined (p < .05). Total crashes did not reliably change in Snohomish County after TZT (p > .05). The results also indicated that after TZT began, nighttime crashes decreased 3.8 percent in King County, 8.7 percent in Pierce County, and 6.0 percent across the TZT counties combined (ps < .05). Nighttime crashes did not reliably change in Snohomish County after TZT (p > .05). Analyses indicated that after TZT began, single-vehicle nighttime crashes decreased 8.7 percent in Pierce County (p < .05), but did not reliably change in King and Snohomish counties, or across the TZT counties combined (p > .05). Overall, the findings supported a conclusion that the deployment of Target Zero Teams in King and Pierce counties was associated with reduced crashes. The failure to find a relationship between the TZT implementation and a crash reduction in Snohomish County may have been because the NEET program had already reduced crash rates for several years before the start of TZT.
Driver Alcohol Involvement in Fatal Crashes. Researchers examined the ratio of alcohol-involved drivers in fatal crashes to non-alcohol-involved drivers in fatal crashes in the TZT and comparison counties. For the TZT counties, there was virtually no change in the ratio of fatal crash involved drivers with any BAC greater than or equal to .01 while the rate in the
comparison counties and the rest of the State increased. This represented a relative reduction of 24.8 percent for driver alcohol involvement (BAC ≥.01) in fatal crashes for the TZT counties. Results showed the ratio of fatal crash involved drivers with high BACs (BAC ≥ .15) to drivers with a zero BAC increased in the TZT counties after TZT began, but at a rate less than that of the comparison counties and the rest of the State. This represented a 22.4 percent relative reduction in high-BAC driver alcohol involvement in fatal crashes. Both results suggest that while TZT does not appear to be associated with absolute reductions in the ratios of alcohol-involved drivers in fatal crashes, it was associated with relative reductions since the comparison counties and the rest of the State were showing greater increases during the same time period.
Driver Alcohol Involved Fatalities Avoided. Analyses compared the projected number of alcohol-involved fatal crashes based on the period before TZT with the actual data for the TZT operational period in the intervention counties using the comparison counties as a covariate. Using conservative assumptions, the analyses estimated that TZT saved 11 lives that would have been lost in driver alcohol-involved fatal crashes in King, Pierce, and Snohomish counties if TZT had not been in operation.
x
Cost/Benefit to State. Various studies (e.g., FHWA, 1994, National Safety Council, n.d., Cambridge Systematics, 2011) suggested the cost to society of a fatality is $2.6 million to $6 million. Using the National Safety Council’s intermediate estimate of $4,459,000 as the cost of a fatality, the avoidance of the 11 fatals in the TZT counties saved $49,049,000. WTSC reported direct expenditures of $6,038,362.55 on TZT. Thus, based on just savings in fatalities alone, TZT had a benefit:cost ratio of 8.12:1.
Summary and Discussion
The data show the TZT program led to increased DUI enforcement activities by the WSP and participating local agencies in the TZT counties. Analyses of WSP’s TAS and BAC
databases, local agency grant logs, and AOC’s citation/arrest records showed increases in traffic stops for DUI, and subsequent increases in BAC testing. The TAS data also revealed the TZT troopers had substantially higher percentages of contacts resulting in DUI arrests than did their non-TZT counterparts in the same and other counties. Therefore, from a process standpoint, TZT achieved one of its goals—increasing DUI enforcement. This increase also likely heightened the visibility of enforcement and, hence, the potential for creating increased general deterrence to drinking and driving.
The results of the crash analyses suggested that TZT was related to reductions of non-fatal crashes of all types in Pierce County and certain types of crashes in King County. Most notably, the time series analyses indicated that after TZT began, total crashes decreased 7.1 percent in King County, 7.0 percent in Pierce County, and 3.8 percent across the three TZT counties combined, as compared to comparison counties. Nighttime crashes decreased 3.8 percent in King County, 8.7 percent in Pierce County, and 6.0 percent across the three TZT counties combined. Analyses also showed single-vehicle nighttime crashes (a widely used alcohol-involved crash surrogate measure) decreased 8.7 percent in Pierce County, but did not reliably change in King County or Snohomish County.
The TZT counties showed virtually no change in the ratio of drivers in fatal crashes with positive BACs (> .01), but the rate in the comparison counties and the rest of the State increased. This represented a relative reduction of 24.8 percent for driver alcohol involvement (BAC ≥ .01)
in fatal crashes for the TZT counties. The ratio of driver alcohol-involved crashes with high BACs (> .15) increased in the TZT counties, but at a rate less than that of the comparison
counties and the rest of the State. This represented a 22.4 percent relative reduction in high-BAC driver alcohol involvement in fatal crashes. Both results suggest that while TZT does not appear to be associated with absolute reductions in the ratios of alcohol-involved drivers in fatal crashes, it was associated with relative reductions since the comparison counties and the rest of the State were showing greater increases during the same time period. While the relative reductions in alcohol-involvement in fatal crashes appeared to be fairly substantial, the small number of fatalities in the TZT counties likely prevented the reductions from being statistically significant. The projections of fatalities avoided used in the cost/benefit analysis suggest a substantial benefit to the State even though the calculations were very conservative.
Finally, many of the WTSC/DOL public awareness measures showed very little change. However, the intervention and comparison sites both showed statistically significant increases in recognition of "Over the Limit; Under Arrest" by July 2012. The intervention sites also showed a significant increase in recognition of "Target Zero Teams," but the highest rate achieved was only 5.1 percent. This may have been due to the design of TZT, which did not include the
extensive media efforts characteristic of traditional high visibility enforcement programs. The results also provided an encouraging suggestion of a reduction in self-reported drinking and driving behaviors in the TZT counties after the start of the TZT program.
Overall, the study results suggest the TZT approach markedly increased the DUI
enforcement productivity of the law enforcement agencies in the intervention counties that led to safety gains in at least two of the three TZT counties during the study time period. For
Snohomish, the operation of the NEET program in the prior years may have mitigated the impact of TZT. The TZT process clearly produced operational gains in parameters that should relate to improved and lasting safety as general deterrence builds. Given that WTSC plans to continue the TZT program in the three counties, future research may wish to conduct follow-up efforts to see if the benefits achieved in the TZT counties continue to increase, plateau, or recede.
1
Background
This report summarizes the methods and results of impact and process evaluations of the Target Zero Teams high-visibility enforcement program conducted by the State of Washington. Dunlap and Associates, Inc., and the Pacific Institute for Research and Evaluation performed the evaluation. The study included multiple data collection activities encompassing examinations of citation data, crash data, fatalities, driver BACs, law enforcement activities across the State, media activity, public awareness, program implementation and processes, and an analysis of cost/benefit to the State. This report describes each data collection activity and available results.
According to the National Highway Traffic Safety Administration (2012), there were 9,878 people killed in alcohol-impaired-driving crashes (defined as at least one driver having a BAC of .08 g/dL) during 2011, which represented 31 percent of the total motor vehicle traffic fatalities in the United States during that year. This was a decrease of 2.5 percent from 2010 when there were 10,136 fatalities for alcohol-impaired crashes. The alcohol-impaired-driving fatality rate per 100 million VMT remained the same from 2010 to 2011 at 0.34 (NHTSA, 2012). NHTSA (2012) also found substantial differences in alcohol impairment based on time of day of a crash and day of the week. Most notably, the rate of alcohol impairment among drivers
involved in fatal crashes in 2011 was much higher at night (36% of drivers in crashes) than during the day (8% of drivers in crashes). In addition, 31 percent of all drivers involved in fatal crashes on weekends exhibited alcohol impairment compared to 15 percent of drivers during the week. In 2011, 48 percent of drivers in single-vehicle nighttime crashes were impaired compared to 17 percent for single-vehicle daytime crashes.
Data from the Washington Traffic Safety Commission (2011) also showed a decrease in Washington for the number of impaired driving fatalities in 2010 with 230 (out 460 total
fatalities or 50.0%) compared to 265 (out of 495 total fatalities or 53.5%) in 2009. The rate of impaired driving crashes per 100 million VMT decreased from 0.47 in 2009 to 0.40 in 2010. Similar to the national data, Washington showed an overrepresentation of alcohol-impaired crash fatalities on the weekends and at night. Serious injury crashes showed similar trends for the same time period.
Despite the downward trends in Washington and the United States as a whole, the residual numbers indicate alcohol-impaired driving is still a major problem. As such, there have been numerous attempts across the country at the Federal, State, and local levels to reduce alcohol-impaired driving. Fell, McKnight, and Auld-Owens (2013) provide a review of the activities undertaken by communities at various levels to reduce alcohol-impaired driving. Many of the most successful programs relied on HVE and the use of checkpoints. Such programs increase general deterrence because they increase the driving public’s perceived risk of apprehension and sanctioning. Not all States, however, have the ability to conduct sobriety checkpoints due to prohibitive State statutes, court decisions, or other impediments. In Washington, the legislative ban on checkpoints is particularly strong, and safety officials
Those localities that cannot use checkpoints tend to employ saturation and roving patrols as an alternative for enforcing impaired-driving laws. These strategies involve sending more officers than normal to patrol areas where alcohol related crashes frequently occur and/or areas where there have been a high number of arrests for driving under the influence (DUI). Saturation patrols appear to be effective in reducing impaired driving if they are highly publicized (Stuster & Blowers, 1995). For example, Michigan, which like Washington does not permit checkpoints, achieved a significant reduction in drinking driver fatal crashes through the use of weekly high-visibility saturation patrols and highly publicized mobilizations (Fell, Tippetts, & Levy, 2008).
The Target Zero Teams Program
The TZT program concept emerged from one of Washington State’s global highway safety objectives and a pilot project called the Night Emphasis Enforcement Team (NEET) program in a single county. The major milestones leading to the implementation of the TZT program included:
• 2000 – Washington State conceives Target Zero as a global State objective
o Plan aims to reduce traffic fatalities in Washington to 0 by 2030,
o Reducing alcohol-involved crashes is a top priority;
• November 2006 – NEET pilot project started in Snohomish County;
• January 2009 – Based on success of NEET project, WTSC begins developing TZT concept to expand into other counties. WTSC asks NHTSA to sponsor an independent evaluation of TZT;
• May 2010 – Evaluation contract awarded to Dunlap and Associates and PIRE;
• July 2010 – TZT launches in King, Pierce, and Snohomish counties with funding for two years of operation; and
• July 2012 – TZT receives additional State funding to continue and expands to include Yakima and Spokane counties..
In addition to these milestone events, the WTSC TZT management team provided a more detailed timeline that documents the steps in the conceptualization, project design,
implementation, and project management activities conducted from February 2009 to the program start in July 2010 (see Appendix).
This timeline summarizes the hours worked by management and the nature of the efforts undertaken as an example of the steps and associated levels of effort required to develop a program of this scale to the point at which it is operational and potentially effective.
3
The NEET Program
The Washington State Patrol has primary responsibility for enforcing traffic safety regulations, including DUI, on the State’s highways. In late 2006, WSP assembled a full-time, high-visibility saturation patrol they called NEET. This pilot program, funded by WTSC, supported a dedicated detachment of four troopers and a sergeant stationed primarily in
Snohomish County, a suburb of Seattle that includes the City of Everett. The NEET detachment troopers focused their efforts primarily on the enforcement of impaired driving and related traffic offenses (e.g., nonuse of seat belts and speed) on weekend nights and were relieved of their other routine duties as WSP troopers during this time. The NEET troopers were specially selected based upon their training, experience, and motivation in enforcing impaired driving laws. A NHTSA Research Note (Cicchino, 2012) indicated that the raw count of traffic fatalities
decreased by 40.3 percent in Snohomish County from 2005 (the year before the NEET program began) to 2008. In contrast, traffic fatalities in the same period decreased by only 17.7 percent in the remaining counties in Washington that did not have NEET patrols.
Expansion of NEET Program to TZT
Washington expanded the NEET pilot project concept by establishing three detachments of WSP troopers to focus on nighttime impaired-driving offenses. They named these
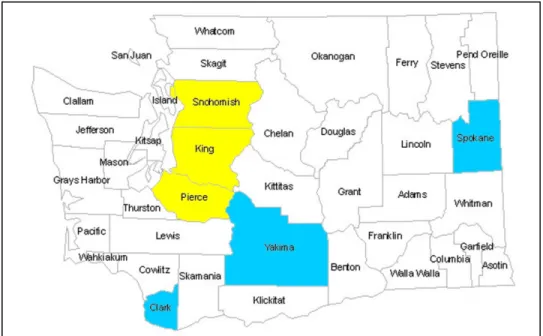
detachments Target Zero Teams in support of Washington’s strategic highway safety plan that included the goal to reduce traffic fatalities in Washington to zero by the year 2030. A top priority area in the overall “Target Zero” approach involved reducing impaired driving. The program deployed a TZT detachment of a sergeant and six troopers in each of the counties of King (Seattle area), Pierce (Tacoma area), and Snohomish (Everett area north of Seattle). The detachments came from WSP Districts 2, 1, and 7, respectively. Researchers chose Clark, Spokane, and Yakima counties to serve as comparison sites since they did not have any formal WTSC-funded TZT activities taking place. It must be noted, however, that King, Pierce, and Snohomish are the three largest counties in the State. Therefore, even though Clark, Spokane, and Yakima represented large counties, they did not match the TZT counties well with respect to population. Researchers also used the rest of the State, which largely consists of small, more rural counties, as a second comparison when statewide data were available.
Figure 1 contains a map of Washington with the intervention and selected comparison counties highlighted. Table 1 presents the basic characteristics of the 3 intervention and 3 comparison counties.
Note: The map indicates TZT intervention counties in yellow and comparison counties in blue. TZT Counties and Comparison Counties
Figure 1.
County Characteristics
Table 1.
County Population Land Area (mi2) Population Density (persons/mi2)
INTERVENTION King 1,931,249 2,126 908.4 Pierce 795,225 1,679 473.7 Snohomish 713,335 2,089 341.5 COMPARISON Clark 425,363 628 677.1 Spokane 471,221 1,764 267.2 Yakima 243,231 4,296 56.6 STATE TOTAL State Total 6,724,540 66,544 101.1
Note: All data retrieved from 2010 US Census
Similar to the pilot NEET program, WSP relieved TZT troopers of their regular duties and assigned them to focus their efforts primarily on enforcement of alcohol-involved driving. Since Washington prohibits checkpoints, the patrols had to use a roving patrol approach to target specific areas selected based on arrest and crash data as detailed in the next section. The WSP strategy included backfilling the positions of the TZT troopers with new hires or transfers to ensure the maintenance of previous levels of effort on normal WSP activities.
5
In addition to the WSP detachments, the TZT program also involved local law enforcement in the three intervention counties. These agencies received grant funding from WTSC to conduct overtime enforcement focused on DUIs. In general, the local law enforcement agencies acted independently of the WSP detachments and focused on locales within their jurisdictions known to be associated with DUIs (e.g., local bars). WSP shared historical data on areas of high DUI activity with the local agencies who provided activity reports to WTSC. The results section includes a summary of their activities.
Geo-mapping Crashes and Arrests to Guide Enforcement
From the beginning of the program, TZT relied heavily on the use of geo-mapping to target areas with high concentrations of crashes and arrests related to alcohol-involved driving. Geo-mapping displays data such as crashes or DUI arrests on a map of the location at which they occurred. Geo-maps indicate clusters of events using vivid colors or dense spots often called “hot spots.” WSP data analysts used geo-mapping techniques to identify hot spots of impaired driving activities as the program progressed. As shown in Figure 2, the hot spots changed over time as new information on crashes and arrests became available. The TZT teams received this dynamic information via monthly meetings with their sergeants and other TZT stakeholders. The
sergeants then used the information at their own discretion to direct their teams to areas where they might be most productive in catching impaired drivers and preventing alcohol-related crashes.
Example of Hot Spot Mapping
7
Objective
The evaluation effort was independent from the TZT enforcement program. The
evaluation focused on the program’s effectiveness in increasing DUI enforcement and whether TZT resulted in decreased alcohol-involved driving, crashes, and fatalities in the intervention counties in relation to the chosen comparison counties and statewide. The research objectives included:
1. Evaluate the effectiveness of Washington State’s TZT project in King, Pierce, and Snohomish counties;
2. Assess public awareness and media coverage of the project;
3. Determine the degree of cooperation between TZT troopers and local law enforcement in TZT counties; and
4. Calculate the cost/benefit of the project to the State of Washington.
Methods, Analyses, and Results
The sections below describe the methods for each data collection activity, the data analysis approach, and any noteworthy results. All data collection efforts were initiated by Washington State; the data analyses were performed by the authors. The discussion in each section also highlights any problems experienced during the data collection efforts.
Citation/Law Enforcement Activity Data
The evaluation examined changes in citations/arrests, particularly alcohol-related traffic citations, in the three intervention counties versus the three comparison counties and the
remainder of the State. Without a notable increase in alcohol-related citations/arrests, it would be difficult to attribute any changes in crashes or fatalities to the TZT program. The current project acquired citation and arrest data from four separate sources. These included WSP’s trooper activity database, WTSC’s database of local law enforcement grant activities, the files of the Washington Administrative Office of the Courts, and activity reports from prosecutors’ offices to WTSC.
TZT trooper activity data. WSP maintains a detailed “Time and Activity System” (TAS) consisting of Time and Activity Reports (TARs) completed by WSP troopers for every activity in which they engaged while on duty. WSP provided TAS data for 2 years prior to the start of TZT (July 1, 2008, to June 30, 2010) and for the 2-year TZT program period (July 1, 2010, to June 30, 2012). TAS data included the identity of the detachment to which a trooper was assigned when a particular activity took place. In order to identify Trooper activities engaged in by the TZT detachments, WSP created new detachment codes for the TZT special DUI
enforcement units. As troopers moved in and out of the TZT detachments, the system changed their detachment codes so that TZT-related actions could be identified. Due to the structure of the database and the movement of troopers in and out of the TZT detachments, the actions of
individual troopers could not be followed. Researchers could therefore not calculate measures of arrests/citations rates per hour or shift. In place of these measures, researchers used counts of the overall number of contacts made and an assessment of what percentage of those contacts resulted in various types of arrests, citations, or warnings for the TZT detachments versus troopers on regular duty.
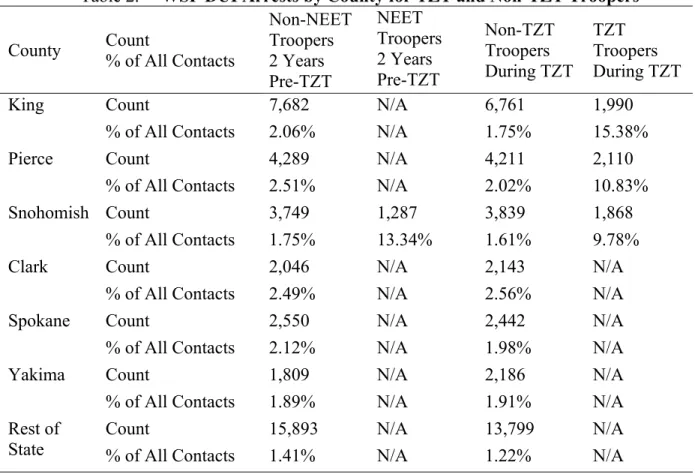
Table 2 presents the number of DUI arrests made during the 2-year periods before and after the start of TZT by county and whether the arresting troopers were TZT (or NEET) members. The table also shows what percentage of the overall contacts these DUI arrests represented within each county by TZT membership category. Table 2 shows that during the TZT period the TZT detachments in King, Pierce, and Snohomish showed significantly higher percentages of contacts resulting in DUI arrests (15.38%, 10.83%, and 9.78% respectively) than did the non-TZT troopers in those counties (1.75%, 2.02, and 1.61%) and the troopers in the comparison counties (2.56%, 1.98%, and 1.91%) and the rest of the State (1.22%), χ2 (9, N =
2,333,895) = 32,399.69, p < 0.001.1 In addition, column proportions Z-tests showed the King
County TZT detachment’s DUI arrest rate was significantly higher (p < 0.05) than that of Pierce and Snohomish, but it should be noted TZT Troopers in King County had fewer stops overall, compared to the other two TZT counties.
1 When sample sizes are as large as those found here, the chi square statistic will almost always indicate significant differences. The actual differences in counts and proportions should be examined to determine the operational
9
WSP DUI Arrests by County for TZT and Non-TZT Troopers
Table 2.
County Count % of All Contacts
Non-NEET Troopers 2 Years Pre-TZT NEET Troopers 2 Years Pre-TZT Non-TZT Troopers During TZT TZT Troopers During TZT
King Count 7,682 N/A 6,761 1,990
% of All Contacts 2.06% N/A 1.75% 15.38%
Pierce Count 4,289 N/A 4,211 2,110
% of All Contacts 2.51% N/A 2.02% 10.83%
Snohomish Count 3,749 1,287 3,839 1,868
% of All Contacts 1.75% 13.34% 1.61% 9.78%
Clark Count 2,046 N/A 2,143 N/A
% of All Contacts 2.49% N/A 2.56% N/A
Spokane Count 2,550 N/A 2,442 N/A
% of All Contacts 2.12% N/A 1.98% N/A
Yakima Count 1,809 N/A 2,186 N/A
% of All Contacts 1.89% N/A 1.91% N/A
Rest of
State Count % of All Contacts 15,893 1.41% N/A N/A 13,799 1.22% N/A N/A
Table 3 shows that during the TZT period, the intervention counties exhibited notable net increases in the number of countywide DUI arrests as compared to the control counties and the rest of State. Pierce had a particularly large increase (47.21%) while King County showed a smaller net increase of 13.63%. The pattern of data in King County suggests the non-TZT troopers in King County may have actually decreased their arrest rates during the program. For Snohomish, there was an increase of 13.28 percent during the TZT period which is notable because the successful NEET program had been in operation prior to the start of TZT. Of the three comparison counties, only Yakima (20.84% increase) showed a notable net increase for DUI arrests, while the rest of the State showed a fairly substantial decrease of 13.18 percent during the TZT timeframe. Analysis showed that each of the TZT counties (and Yakima) accounted for a greater percentage of the DUI arrests across the entire State during the TZT period than they did before the TZT period, χ2(6, N = 80,654) = 637.06, p < 0.001. Anecdotal
reports indicated that Yakima had independently mounted some TZT-like activities to increase their DUI enforcement. These may have accounted for the observed data pattern.
Net Change in Number of WSP DUI Arrests During TZT by County
Table 3. County
All Troopers 2 Years
Pre-TZT All Troopers During TZT Net Change During TZT
King 7,682 8,729 1,047 (13.63%) Pierce 4,289 6,314 2,025 (47.21%) Snohomish 5,036* 5,707 669 (13.28%) Clark 2,046 2,143 97 (4.74%) Spokane 2,550 2,442 -108 (-4.24%) Yakima 1,809 2,186 377 (20.84%) Rest of State 15,893 13,799 -2,094 (-13.18%)
*Includes DUI arrests made by NEET Troopers
WSP officers could issue official warnings to drivers for a variety of reasons when a traffic stop was made. When a trooper issued a warning, he or she also generated a TAS entry. Table 4 displays the number of warnings of any type issued during the 2-year periods by county and TZT (or NEET) detachment membership. The table also shows what percentage of the overall contacts these warnings represented within each county by TZT involvement. Table 4 shows that during the TZT period, there were notable differences in warning rates with the TZT detachments in King, Pierce, and Snohomish showing significantly higher percentages of contacts resulting in warnings (80.12%, 70.97%, and 66.04%, respectively) than the non-TZT troopers in those counties (44.26%, 42.88%, and 46.01%), the troopers in comparison counties (42.94%, 45.83%, and 58.3%), and troopers in the rest of the State (50.06%), χ2(9, N =
2,333,895) = 24,363.33, p < 0.001. In addition, column proportions Z-tests showed the King County TZT detachment’s warning rate was significantly higher (p < 0.05) than that of Pierce and Snohomish, and Pierce was significantly higher than Snohomish.
11
WSP Warnings by County for TZT and Non-TZT Troopers
Table 4.
County Count % of All Contacts
Non-NEET Troopers 2 Years Pre-TZT NEET Troopers 2 Years Pre-TZT Non-TZT Troopers During TZT TZT Troopers During TZT
King Count 154,917 N/A 170,900 10,364
% of All Contacts 41.64% N/A 44.26% 80.12%
Pierce Count 70,292 N/A 89,410 13,825
% of All Contacts 41.21% N/A 42.88% 70.97%
Snohomish Count 94,533 7,036 109,515 12,617
% of All Contacts 44.23% 72.93% 46.01% 66.04%
Clark Count 39,077 N/A 35,936 N/A
% of All Contacts 47.48% N/A 42.94% N/A
Spokane Count 54,828 N/A 56,529 N/A
% of All Contacts 45.60% N/A 45.83% N/A
Yakima Count 54,574 N/A 66,813 N/A
% of All Contacts 57.07% N/A 58.30% N/A
Rest of
Table 5 shows significant variations in rates of speeding citation issuance, χ2(9, N =
2,333,895) = 34,738.38, p < 0.001, with column proportions Z-tests showing that King and Pierce counties had smaller percentages of contacts made by TZT troopers resulting in speeding citations, compared to their non-TZT counterparts within their respective counties and the troopers working in the other studied counties during the TZT time period. TZT trooper contacts in Snohomish resulted in similar rates of speeding citation issuance, compared to their non-TZT counterparts in the county and the rest of the State. Counts of other violations (e.g., failure to wear a seat belt), were too small relative to the overall number of contacts to show any meaningful changes over time.
WSP Speeding Citations by County for TZT and Non-TZT Troopers
Table 5.
County Count % of All Contacts
Non-NEET Troopers 2 Years Pre-TZT NEET Troopers 2 Years Pre-TZT Non-TZT Troopers During TZT TZT Troopers During TZT
King Count 63,026 N/A 62,117 1,637
% of All Contacts 16.94% N/A 16.09% 12.93 %
Pierce Count 29,367 N/A 40,344 1,658
% of All Contacts 17.22% N/A 19.35% 8.51%
Snohomish Count 60,989 1,918 65,107 5,139
% of All Contacts 28.53% 19.88% 27.35% 26.90%
Clark Count 12,563 N/A 16,164 N/A
% of All Contacts 15.26% N/A 19.31% N/A
Spokane Count 30,866 N/A 27,395 N/A
% of All Contacts 25.67% N/A 22.21% N/A
Yakima Count 19,202 N/A 22,788 N/A
% of All Contacts 20.08% N/A 19.88% N/A
Rest of
13
Local law enforcement activities. In addition to the enforcement activities of the WSP troopers, local Police and sheriff’s departments participated in overtime DUI enforcement efforts funded by WTSC as part of TZT. The agencies receiving grants from WTSC to participate in TZT reported their efforts to WTSC through periodic activity logs. The logs included number of hours worked (paid overtime and regular time donated by the agencies) and all activities
conducted during those hours such as the number of traffic stops, citations issued, or arrests made. Participating agencies only completed the logs for times when they funded their
operations with grant funds provided by WTSC. Thus, researchers had no baseline enforcement data for these agencies similar to the information on WSP troopers derived from TAS. Table 6 displays the overtime and regular hours worked by county on TZT. As shown in the table, the great majority of hours came from the paid overtime purchased by WTSC.
Local Law Enforcement Hours Worked on TZT
Table 6.
King
(12 agencies) (9 agencies) Pierce (15 agencies) Snohomish Total
Overtime 4,931.6 3,668.8 3,954.5 12,554.9
Regular 348.0 8.0 252.8 608.8
Total 5,279.6 3,676.8 4,207.3 13,163.7
Table 7 provides the reported tallies of the contacts made by local law enforcement agencies in each county and counts of selected citations issued and arrests made as a result of those contacts during the paid overtime efforts. Overall, the counties displayed similar rates of contacts made per hour, with King at 1.89 contacts per hour worked, Pierce at 1.81, and Snohomish at 2.1. Of most interest for this project, local agencies in King County reported making 525 DUI/alcohol arrests (0.10 per hour worked), 521 in Pierce County (0.14 per hour worked), and 296 in Snohomish County (0.07 per hour worked) across the 2-year TZT period. Other common infractions included speeding, financial responsibility (e.g., no insurance), equipment violations, failure to wear a seat belt (or use a child restraint), and driving while suspended/revoked. In addition to the citations and arrests, officers and deputies issued a substantial number of warnings in each TZT intervention county, with 6,533 in King, 3,546 in Pierce, and 5,597 in Snohomish. The law enforcement officers did not document the reasons for issuing the warnings. Again, these data represent only the most frequent violation types
Local Law Enforcement Contacts, Citations, and Arrests
Table 7.
King Pierce Snohomish Total
Total Contacts 9,966 6,655 8,830 25,451
Per hour worked 1.89 1.81 2.1 1.93
DUI/Alcohol Arrests 525 521 296 1,342
Per hour worked 0.10 0.14 0.07 0.10
Speeding Citations 1,081 1,014 678 2,773
Per hour worked 0.20 0.28 0.16 0.21
Seat Belt Citations 124 39 88 251
Per hour worked 0.02 0.01 0.02 0.02
No Insurance Citations 696 899 711 2,306
Per hour worked 0.13 0.24 0.17 0.18
Equipment Citations 416 427 373 1,216
Per hour worked 0.08 0.12 0.09 0.09
Drive Susp/Rev Citations 330 405 281 1,016
Per hour worked 0.06 0.11 0.07 0.08
Total Warnings 6,533 3,546 5,597 15,676
Per hour worked 1.24 0.96 1.33 1.19
AOC data. The AOC provided the project with alcohol-related citation/charge data for the entire State for both the Courts of Limited Jurisdiction (CLJ) and the Superior Courts. These data supported an examination of the alcohol citations/charges filed in the TZT counties, the comparison counties, and the rest of the State over time. However, some issues arose that limited the utility of the data. First, AOC indicated they purge many records from the CLJ database 3 years after a case is closed. The database also failed to include many newer cases due to a lag from initial infraction to entry into AOC files. After examining data for January 1, 2002 through June 30, 2012, researchers determined that only the period from January 1, 2008 through
December 31, 2011 had sufficiently complete data to warrant inclusion in the analyses. A second issue arose because, while most alcohol citations represented infractions, a significant minority of the alcohol and driving offenses constitute more serious charges adjudicated in Superior Court. AOC maintained Superior Court cases in a totally separate database that had a different structure than the CLJ database. Because of the incompatibility between the databases, researchers had to analyze the two sources separately since no basis existed for merging the files.
Third, AOC designed its databases for operational query purposes and not primarily for research. As a result, extracting data suitable for research analyses involved high workload for
15
the AOC staff. Therefore, researchers could not obtain possibly relevant non-alcohol infractions (e.g., speeding, seat belt) from the database. This limited the evaluation to an examination of only alcohol-related citations/charges. AOC asked the researchers to use the same list of alcohol charges of interest used by McCartt, Leaf, Farmer, & Eichelberger (2012) in a previous study in Washington to AOC to guide the data extraction and limit AOC workload.
Finally, a single citation/charge could have resulted in multiple entries in either the CLJ or Superior Court databases as local courts sent in new information regarding a citation/charge (e.g., amended charges). A single key variable linked all of these database cases, and researchers had to reduce the dataset to identify unique initial DUI citation/charge events and avoid double counting.
Given the foregoing limitations, researchers produced only descriptive results for the CLJ and Superior Court data, and the reader should interpret the following results with caution. Figure 3 displays, from the CLJ database, the average number of DUI citations per quarter in the TZT counties, comparison counties, and the rest of the State. King and Pierce counties show an increase in citation activity when TZT efforts began while Snohomish stayed relatively stable compared to the prior years when NEET had been operating and presumably had increased DUI citation activity. The increases in King and Pierce tended to drop off slightly over time, but this could simply be an artifact of the lag from the issuance of a citation to entry in AOC’s database. The comparison counties showed virtually no change in citation activity after TZT began. The rest of the State had been on a downward trend since 2008 but showed a small spike after the start of TZT, which was followed by a drop in the fourth quarter of 2010.
Average Number of DUI Citations by County
17
A potential downside to increasing DUI arrests involves added workload for the prosecutors and courts. To offset the potential increased workload for the courts, WTSC provided funding to the prosecutors’ offices in King County and Snohomish County to hire additional staff. Given that TZT appeared to increase the number of DUI cases in King and Pierce counties during the first five quarters of the project, researchers decided to examine how the program impacted the time it took to process the additional cases as one measure of the TZT process impact. Figure 4 shows the average number of days from citation issuance to the date prosecutors filed that citation in court. As shown in the figure, King County had a much higher pre-TZT average than the other counties, but evidenced a downward trend in filing time the year before TZT. Once TZT began, the average number of days to filing in King initially increased, likely due to the increase in citation issuance, but the average again fell in the first quarter of 2011. This latter fall may be attributable to the increased number of prosecution staff supported by TZT.
Average Number of Days From from Citation to Court Filing by County
Figure 4.
Unlike King, Snohomish County showed a relatively flat trend before TZT, but began a gradual downward trend in average number of days to filing after the program began. Pierce County showed a slight spike in the fourth quarter of 2010, but returned to pre-TZT levels in the following quarters. The comparison counties and the rest of the state showed no major changes over time. Again, the later quarters presented in this figure should be interpreted with caution due to the lag from filing in court to actual entry into AOC’s database. This lag could artificially lower the average for these later quarters if cases with longer times from citation to filing did not make it into the database by the time researchers accessed it.
The additional arrests due to TZT also may have affected the time to the final disposition of a DUI charge. Researchers could not perform an analysis of time to final disposition reliably because larger percentages of filed cases in the more recent quarters did not have final
disposition information entered compared to the earlier time periods. Excluding cases without dispositions would lead to an artificially low average number of days to disposition for the more recent time periods and an analysis data set with unknown sampling properties. Similarly, researchers could not reliably explore the rates of amended charges because of the unavailable final disposition data for more recent cases. This database needs more time to mature before it can support a comparison of pre-TZT plea rates to those after TZT began. As described later, however, the reports provided by the prosecutors suggested they allowed a substantial percentage of violators to plead to lesser charges.
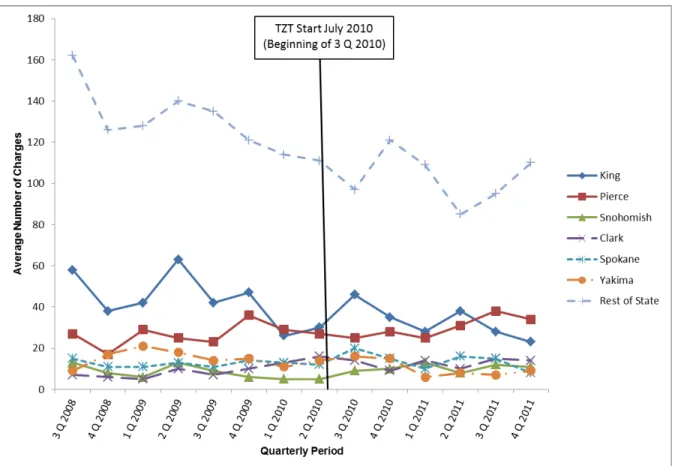
Figure 5 displays the average number of DUI charges in the Superior Court database by county and quarter. Superior Court cases generally involve more serious felonies and gross misdemeanors. The same limitations detailed for the CLJ data apply to this data set, and, as with the CLJ results, the reader also should interpret the results presented below with caution. In addition, the relatively small number of cases in some of the counties further limits the ability to interpret any observed trends. Examining Figure 5, King County showed a small increase in the number of charges immediately after the start of TZT followed by a drop off. Pierce County displays a slight increase in number of charges near the end of 2011. Snohomish County and the comparison counties showed very few charges at all. The rest of the State exhibited a downward trend before TZT, and showed a spike in cases during the fourth quarter of 2010, followed by a drop-off in the subsequent quarters before spiking again in the fourth quarter of 2011.
Average Number of Superior Court DUI Cases by County
19
Researchers next examined the average number of days from charge to filing in Superior Court (Figure 6). Due to the rather small numbers of cases for most counties, researchers
aggregated data for the TZT counties for comparison to the control counties and the rest of the State. In general, the TZT counties had a higher average number of days from charge to filing in Superior Court before TZT, but were on a downward trend. After TZT began, there was a sharp increase followed by a return to the downward trend. The comparison counties and the rest of the State exhibited an upward trend before TZT. Right before TZT began, however, the comparison counties saw a large drop in the average number of days to filing, but resumed the upward trend until the first quarter of 2011, after which another drop was observed. The rest of the State saw a steady decline after TZT began. Similar to the CLJ data, the later quarters presented in this figure should be interpreted with caution due to the lag from filing in court to actual entry into AOC’s database. This lag could artificially lower the average number of days from charge to filing for these later quarters if cases with longer times from charge to filing had yet to be entered into the database.
Average Number of Days from Citation to Court Filing by County
Special prosecution staff. At the start of the TZT program, WTSC funded additional prosecution staff in King and Snohomish counties for the entire 2-year period. In Snohomish, a single additional prosecutor was hired while multiple support staff members were added in King County. WTSC funded these additional staff members to assist with the prosecution of DUIs in the counties and make sure the already backlogged system did not get even further backlogged because of the elevated enforcement efforts. In addition to these duties, they were asked to keep records of all DUI related activities at the prosecutors’ offices and report those to WTSC.
The types of information reported varied among the counties, and no statistical analyses could be conducted. Most notably, the information provided on numbers of DUI arrests made by TZT detachments was consistent with that found in the TAS database provided by WSP. Also, the reports confirmed the finding from the AOC data that many DUI cases had their disposition status as “pending” which meant no final disposition had taken place for the cases. For those TZT cases with a final disposition, a King County report showed that, for the period from July 2010 – September 2011, only 20 percent of the TZT cases actually resulted in a final disposition of DUI, while 2 percent were dismissed, and the rest were pled down to lesser charges such as reckless driving or negligent driving. The reports did not include the final disposition proportions for non-TZT cases. The reader should note that the availability of prosecutorial staff with a motivation to process cases may not be sufficient to produce a reduction in disposition time. For example, legal maneuvers by a cited driver’s attorneys can still produce a considerable delay in disposition.
Media Activities
WTSC’s first-year (July 1, 2010 – June 30, 2011) TZT media plan did not include any TZT-specific paid radio or television advertisements, although it did include some billboard and bus advertising purchases. Second year (July 1, 2011 – June 30 2012) media activities included some integration of TZT into the media messages, particularly as part of the Internet campaign (Figure 7). The main messages of the paid activities, however, were derivatives of current or former national campaigns using the “Under the Influence, Under Arrest” and “Drive
Hammered, Get Nailed” tag lines for the great majority of the paid television and radio advertisements. Aside from these statewide campaigns, other media and outreach activities included:
• “We’re on the Team” PSAs,
• Home Safe Bar Program,
• Target Zero Teams Facebook page,
• waTikileaks.com Web site,
• Billboards and bus ads,
• Earned media coverage by newspapers, and radio and television stations, and
21
Screenshot of TZT Mention in Choose Your Ride Campaign
Paid media. Table 8displays the DUI-related paid media activities conducted by WTSC during the TZT time period. As mentioned above, TZT was not generally the focus of these DUI paid media efforts, and most of the efforts covered the major population centers of the State, not just the TZT intervention counties. Therefore, the comparison counties for the current project would have received the same paid media messages as the TZT counties.
WTSC Paid DUI Media Campaigns During TZT
Table 8.
Campaign Dates Medium Target Audience Markets Amount Spent Drive Hammered,
Get Nailed 8/2/10-9/5/10 TV, Radio Men 18-34
Seattle, Spokane, Yakima, Tri Cities, Olympia, Moses Lake, Aberdeen, Longview, Ellensburg, Bellingham, Centralia, Port Angeles, Walla Walla, Wenatchee $200,200 Impaired Driving 4/11/11-7/31/11 Outdoor Posters and Bulletin Men 18-34 Seattle/Tacoma $14,612 Impaired Driving Holidays 11/16/11-1/1/12 TV, Radio, Outdoor Posters, Internet Men 18-34
Seattle, Spokane, Yakima, Tri Cities, Olympia, Moses Lake, Aberdeen, Longview, Ellensburg, Bellingham, Centralia, Port Angeles, Walla Walla, Wenatchee $262,310 Impaired Driving St. Patrick's Day Campaign 3/2/12 - 3/18/12 Radio Men 18-34
Seattle, Spokane, Tri Cities, Yakima, Olympia, Moses Lake, Aberdeen, Longview, Ellensburg, Bellingham, Centralia, Port Angeles, Walla Walla, Wenatchee $46,490 Impaired Driving Summer 6/18/12-7/8/12 TV, Radio, Outdoor Posters, Internet Men 18-34
Seattle, Spokane, Yakima, Tri Cities, Olympia, Moses Lake, Aberdeen, Longview, Ellensburg, Bellingham, Centralia, Port Angeles, Walla Walla, Wenatchee
$150,346
23
Earned media. WTSC and WSP instituted wide monitoring to detect earned media activities and e-mailed all TZT stakeholders via a listserv when the monitored media mentioned TZT or when WTSC or WSP issued a press release. Overall, researchers reviewed 126 messages posted to the TZT communications listserv and identified 11 earned media outlets based on the content of the listserv messages. From the 126 messages, researchers identified 74 unique earned media events or unique placements and then classified them according to the earned media outlets that carried them. Table 9 lists the earned media outlets and their frequency of occurrence in the listserv.
As shown in Table 9, TZT most frequently generated both major (e.g., front or full-page story) and minor (e.g., smaller back-page story) newspaper coverage as well as television and social media coverage. Newspaper stories appeared in The News Tribune, USA Today, The
Herald, and The Seattle Times. Television coverage included King5 News (an NBC affiliate),
KOMO News (an ABC affiliate), Q13 (a FOX affiliate), and KIRO (a CBS affiliate). With respect
to social media, posts on the TZT listserv indicated Twitter tweets about TZT activities, YouTube video clips of troopers in training and TZT’s anniversary activities, a Facebook page for TZT, and a waTikiLeaks Web site designed to generate social media buzz by “leaking” TZT activity in the target counties.
Earned Media by Type
Table 9.
Earned Media Outlet Frequency
Newspaper Minor 19 Social Media 13 TV 13 Press Release 10 Newspaper Major 7 Ride-Along 4 Grass Roots 3 Radio 3 Meetings 1
Other Print Media 1
Statewide Crash Data
The Washington Department of Transportation (WDOT) provided the study with
statewide crash data for the period from January 1, 2002 to May 30, 2012. The WDOT indicated there was a four to five month lag between when a crash occurs and when it is entered into the database. At the time of the data request, WDOT believed that May 30, 2012 was the latest date for which it had complete data. The types of crashes examined included:
• Total crashes, • Daytime (6 a.m. to 5:59 p.m.), • Nighttime (6 p.m. to 5:59 a.m.), • Injury, • Single-vehicle, • Multivehicle, and • Single-vehicle at night.
All crash variables entered the analysis as rates per 100,000 population rather than as raw counts in order to account for the differing county sizes. Researchers obtained population estimates used for the analyses from the Washington State Office of Financial Management, Forecasting
Division Web site (2013). Driver alcohol-involved fatal crashes are examined in a later section using separate fatality data made available by WTSC.
Researchers used Auto-Regressive Integrated Moving Average (ARIMA) interrupted time series analysis (Box & Jenkins, 1970; Box & Tiao, 1975) to determine whether reliable changes existed in the crash outcomes after the implementation of the TZT program. Using this analytic method, the monthly outcomes in each TZT county were first statistically adjusted for any preexisting secular trends, autocorrelation, and historical variations prior to estimating any changes associated with implementing the TZT program. Researchers used a comparison series in the ARIMA analyses to adjust for historical variation over time, such as enforcement, fuel prices, new traffic safety laws, and other unknown factors (Liu, 2006). Specifically, researchers used the outcome series for the three combined comparison counties (Clark, Spokane, and Yakima) in the analyses to adjust for historical factors that could potentially affect all
Washington counties and might otherwise be mistaken for an intervention effect. The analyses included individual ARIMA models for each of the three TZT counties and also for all three TZT counties combined. Researchers ran each model with and without the comparison series. The examination of each intervention county separately as well as the combination permitted
researchers to examine effects with and without Snohomish which almost certainly was affected previously by the NEET activities.
The intervention point used in each ARIMA model was the date that the TZT program was implemented (July 2010). Snohomish analyses used the same intervention point in spite of the prior NEET activities because TZT was the program of interest for the evaluation.
Researchers modeled this data as a sudden-permanent intervention, which only requires one parameter (ω) to be estimated for the intervention (Yaffee, 2000). The comparison series and intervention parameters were retained in the models regardless of their level of statistical