Gartner
ProactiveNet 5.1 Solution for Web Performance Management
Summary
ProactiveNet 5.1 is an application performance measurement and analysis product for Web applications. It delivers thresholding and filtering technology to refine root-cause analysis.
Table of Contents Overview Analysis Pricing Competitors Strengths Limitations User Opinion
Recommended Gartner Research Insight
List Of Tables
Table 1: Overview: ProactiveNet 5.1 Solution Table 2: ProactiveNet Solutions
Corporate Headquarters ProactiveNet Inc.
2041 Mission College Blvd., Suite 260 Santa Clara, CA 95054
Tel: +1 877 277 6686; +1 408 935 6800 Fax: +1 408 935 6888
www.proactivenet.com Overview
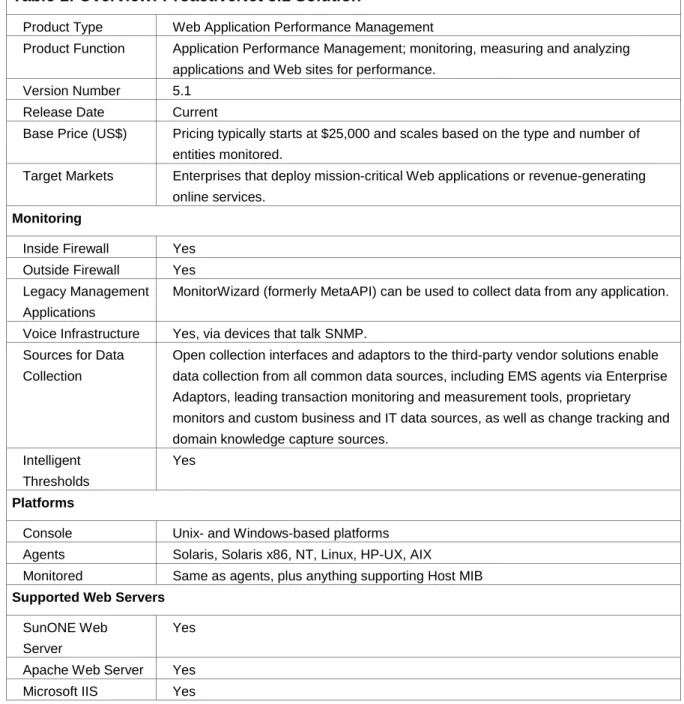
Table 1: Overview: ProactiveNet 5.1 Solution
Product Type Web Application Performance Management
Product Function Application Performance Management; monitoring, measuring and analyzing applications and Web sites for performance.
Version Number 5.1 Release Date Current
Base Price (US$) Pricing typically starts at $25,000 and scales based on the type and number of entities monitored.
Target Markets Enterprises that deploy mission-critical Web applications or revenue-generating online services.
Monitoring
Inside Firewall Yes Outside Firewall Yes Legacy Management Applications
MonitorWizard (formerly MetaAPI) can be used to collect data from any application.
Voice Infrastructure Yes, via devices that talk SNMP. Sources for Data
Collection
Open collection interfaces and adaptors to the third-party vendor solutions enable data collection from all common data sources, including EMS agents via Enterprise Adaptors, leading transaction monitoring and measurement tools, proprietary monitors and custom business and IT data sources, as well as change tracking and domain knowledge capture sources.
Intelligent Thresholds
Yes
Platforms
Console Unix- and Windows-based platforms Agents Solaris, Solaris x86, NT, Linux, HP-UX, AIX
Monitored Same as agents, plus anything supporting Host MIB Supported Web Servers
SunONE Web Server
Yes
Apache Web Server Yes Microsoft IIS Yes
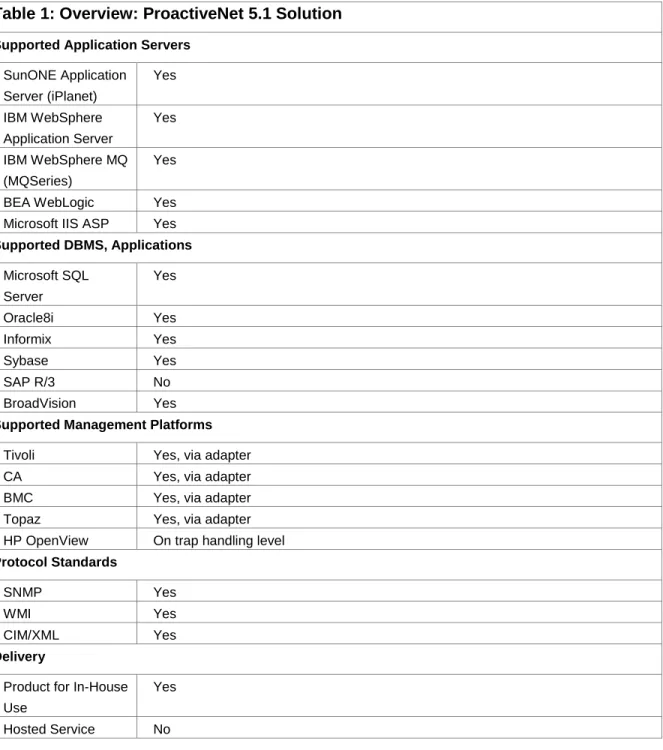
Table 1: Overview: ProactiveNet 5.1 Solution Supported Application Servers
SunONE Application Server (iPlanet) Yes IBM WebSphere Application Server Yes IBM WebSphere MQ (MQSeries) Yes
BEA WebLogic Yes Microsoft IIS ASP Yes Supported DBMS, Applications Microsoft SQL Server Yes Oracle8i Yes Informix Yes Sybase Yes SAP R/3 No BroadVision Yes Supported Management Platforms
Tivoli Yes, via adapter
CA Yes, via adapter
BMC Yes, via adapter
Topaz Yes, via adapter HP OpenView On trap handling level Protocol Standards
SNMP Yes
WMI Yes
CIM/XML Yes
Delivery
Product for In-House Use
Yes
Hosted Service No Analysis
The privately held ProactiveNet, founded in 1997, offers the ProactiveNet 5.1 application performance measurement and analysis product. This patented technology is designed to provide the administrator with the information required to maintain good performance in a distributed environment, especially a Web environment. It aggregates statistics about devices, applications and network components and presents a logical view of the enterprise to the administrator and IT managers, who can view the results and take corrective action as necessary. ProactiveNet supplements traditional systems management and monitoring tools by providing end-to-end visibility into the source of application performance issues. For example, administrators can view the enterprise infrastructure and its components within a digital dashboard, offering a logical, ordered approach, by application or component type (such as Web servers or databases). The administrator can then drill down through successive levels of detail. This drill-down
capability also features color-coded alert and alarm icons to help the administrator identify critical problems and related cause for poor performance.
Innovations in Root-Cause Analysis
The task of determining appropriate threshold values for generating alerts can be frustrating. Setting these values too high means that performance will degrade considerably before IT notices. Setting the values too low will cause too many alerts to go off, requiring time-consuming follow-up. Furthermore, “normal” performance can vary by time of day, day of the week and day of the month. Clearly, rigid thresholds can be very inefficient. Furthermore, setting appropriate threshold values requires intimate knowledge of performance patterns over time.
ProactiveNet addresses each of these dilemmas with its Intelligent Thresholds and SmartFilter technologies. First, its thresholds can vary by time of day. Its engine “understands,” for example, that performance slows down during peak hours. Intelligent Thresholds compensate for this pattern and refrain from generating an unneeded or false alarm during peak hours. Second, ProactiveNet thresholds can be a range rather than a single value.
Third, the ProactiveNet correlation engine is self-learning and continuously refines its definition of normal/abnormal situations. ProactiveNet can set thresholds based on the normal performance of each attribute on every device and application within an application environment. ProactiveNet learns the normal operating band for each monitored attribute of a device or application by hour of day and day of week. By continually refining these thresholds, ProactiveNet expands its understanding for the normal operating range for each element within the infrastructure.
Even with this refined treatment of thresholds, many possible causes of a problem may still remain. ProactiveNet uses proprietary statistical quality control technology to sift through real-time performance data, correlating current performance with the normal performance expectations for each attribute. In this way, ProactiveNet works to narrow the field of potential underlying root causes to a few prime candidates. Data Collectors
ProactiveNet’s Java-based agents and monitors collect data from targeted Web servers (such as Microsoft IIS or SunONE), application servers (such as WebSphere or WebLogic), DBMS (such as Oracle8i, SQL Server or Informix), hardware devices, operating systems, management platforms, middleware and applications. ProactiveNet also offers monitors for directories (such as LDAP), IP Services (such as NFS), mail (such as POP3), networks (such as F5 BIG) and security (such as Checkpoint). ProactiveNet is also a self-monitoring system that reports on its own status.
In addition, ProactiveNet offers open collection interfaces and adaptors to third-party vendor products. They enable data collection from common data sources, including EMS agents via Enterprise Adaptors (such as BMC Patrol, CA Unicenter and Tivoli), such products as Mercury Interactive Topaz, leading transaction monitoring and measurement tools (such as Rational Robot and Keynote) and custom business and IT data sources.
The Monitor Wizard is a graphical user interface (GUI)-based tool for creating customized integrated script-based monitors to collect data from proprietary and legacy applications, custom scripts, various databases, Windows performance counters and internal business metric data. For example, users can visually track connections per hour against sales per hour. In this way, ProactiveNet lets the user visually correlate infrastructure performance to business performance. Once a custom monitor is integrated into ProactiveNet, users can initiate data collection, set Intelligent Thresholds and generate graphs to help correlate and pinpoint problems, leveraging relevant business metrics.
ProactiveNet also offers a separate product called the Software Development Kit (SDK), which enables clients and developers to build custom scalable monitors for any device or application, independent of the ProactiveNet Server. The SDK is best used when a specific need arises that cannot be addressed through the MonitorWizard, such as the need for asynchronous monitors.
With Diagnostic Wizard, administrators can obtain additional detail about a monitored device or process when an alarm or abnormality is detected. The suite of diagnostics include Top 10 EJB for WebSphere, Top 10 Servlets for WebSphere, Top 10 process by CPU, a Logfile Dump mechanism and ActiveSocket Dump for WebLogic. Also, custom Detailed Diagnostics can be created to collect supplementary data to help users gain insight into their environment when the alarm or abnormality was detected.
The Domain Knowledge Capture allows administrators to add documents or expert advice that display when specific conditions are met. In this way, the administrator can integrate company-specific operating procedures and advice from domain experts into the ProactiveNet system. Depending on the cause of the issue, ProactiveNet can provide recommendations on how to resolve the issue, contact the appropriate technical expert, or offer links to red books or other relevant manuals.
Presentation Tools
ProactiveNet 5.1 provides a customizable real-time digital dashboard view of mission-critical devices, transactions and applications environment, in which the administrator can view the enterprise and its components from a variety of formats. The digital dashboard gives companies the ability to create customized displays for whoever may need them, including IT operations or executive management. The administrator can view performance data at any chosen level of detail in the form of graphs, reports, views and alarms. Up to six metrics can be displayed in a single graphic.
ProactiveNet’s alarm views provide the ability to drill from identification of a problem down to the individual device or process that is causing the problem, using color-coded alerts reflecting the level of severity. The administrator can research through successive levels of detail, following the icon through the layers of detail down to the root cause.
ProactiveNet’s customizable reporting tools allow the administrator to select the parameters to view in real time and track them on-screen. For example, by selecting the appropriate graphs, the administrator can tie business metrics to performance metrics, correlating Web-site uptime with sales transactions. Administrators can also customize performance data views for various internal groups protected by secure log ins.
Products
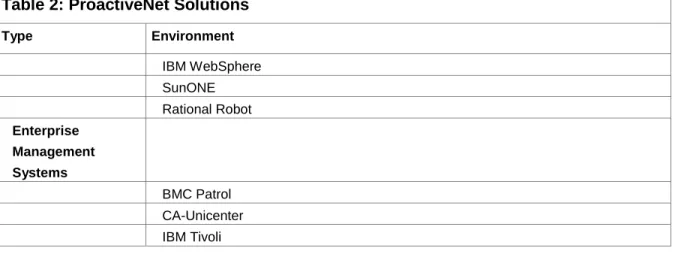
ProactiveNet products for specific application and management environments are listed in the table “ProactiveNet Solutions.” These products customize the ProactiveNet base product with environment-specific terminology (such as WebSphere Gets from Pool vs. SunONE Requests queued) and technology. Products for BMC Patrol include an adapter for Oracle and the ability to create new agent-less monitor types for BMC Patrol Knowledge Modules. The product for Rational Robot provides integration with a pre-deployment development and testing environment.
Table 2: ProactiveNet Solutions
Type Environment
Application Infrastructure
Table 2: ProactiveNet Solutions Type Environment IBM WebSphere SunONE Rational Robot Enterprise Management Systems BMC Patrol CA-Unicenter IBM Tivoli Customer Support
Technical support professionals are available via e-mail or phone. The customer support phone lines are available from 6 a.m. to 5 p.m. PDT. Web-based support is also available, allowing customers to search our online knowledge base and submit technical support questions via e-mail.
Pricing
The ProactiveNet Enterprise Solution base product consists of the intelligence engines, console and report writers, one agent and approximately 20 monitors that cover basic operating system characteristics. This base product is priced on usage, which is measured as a combination of Web transmissions or uniform resource locators (URLs), business metrics scripts, ping monitors and concurrent user sessions.
Table 3: Price List: ProactiveNet Enterprise Solution
Product Base Price (US$)
Entry Level, 25 Devices 12,500
Typical Configuration, With 25 Devices 35,000 Each Additional Monitor or Managed Device (average) 1,000
Education Discount No Leasing No Multicopy Discount No Site License No Pricing as of September 2003. GSA Pricing Yes. Competitors
• Empirix OneSight, FarSight • Mercury Interactive Topaz • Resonate Commander Solutions Strengths
The software features self-learning thresholds that become more accurate over time. It also sets threshold values, reducing startup time.
Integrates Data From Other Sources
ProactiveNet provides an application programming interface (API) for integrating performance data collected by legacy and custom applications.
Low Price
The software is priced reasonably with a low entry point and relatively inexpensive increments. Flexible Architecture
The product uses an agent-based architecture to reduce the number of servers that must be purchased. Limitations
Challenging Market
The Application Performance Management (APM) space is getting more crowded every day; vendors must demonstrate differentiation to break through the confusion related to this emerging market. Vendors are challenged with diluted and misunderstood terms and overlapping positioning messages from competitors and market consolidation.
New Technology
Self-learning and self-monitoring systems are still immature technology, and their automation capabilities have yet to gain administrators’ confidence.
User Opinion
Hoover’s Online reports that they were able to replace 95 percent of their monitoring tools with ProactiveNet. The software was used productively immediately upon installation by virtue of its self-configuring monitors for a few devices. They look forward to the improved reporting options that will be available in the next release.
Recommended Gartner Research
Web Performance Management: An Overview, DPRO-117384 Empirix OneSight Web Performance Management, DPRO-117408 Insight
As a young company with innovative technology, ProactiveNet continues to prove its return on investment (ROI) value to clients in the real world. As an APM, the ProactiveNet Solution is an efficiency tool, where clients can expect to save money by increasing the efficiency of their operations and Web system administration teams, as well as their investment in Web hardware and software infrastructure. ProactiveNet is worthy of consideration for current and emerging enterprise architectures with a need to improve operational efficiencies for their critical online business services.
Hedy Alban began her IT career as a programmer, reconstructing a relational database structure by analyzing hex dumps. Today, she brings to her customers almost two decades of experience in programming, system administration, research analysis and publication development. In addition to managing several publications targeting IT professionals, she has managed the delivery of information
services to major vendors in the IT industry. Hedy is a member of the OASIS Management Protocol Technical Committee.