Ananda Sankaran
Storage Infrastructure and Solutions
Dell Product GroupJuly 2010
Dell EqualLogic Best Practices Series
Sizing and Best Practices for
Deploying Microsoft Exchange
Server 2010 on VMware
vSphere and Dell EqualLogic
Storage
THIS WHITE PAPER IS FOR INFORMATIONAL PURPOSES ONLY, AND MAY CONTAIN
TYPOGRAPHICAL ERRORS AND TECHNICAL INACCURACIES. THE CONTENT IS PROVIDED AS IS, WITHOUT EXPRESS OR IMPLIED WARRANTIES OF ANY KIND.
© 2010 Dell Inc. All rights reserved. Reproduction of this material in any manner whatsoever without the express written permission of Dell Inc. is strictly forbidden. For more information, contact Dell.
Dell, the DELL logo, and the DELL badge, PowerConnect
™
, Dell™ EqualLogic™
, PowerEdge™
andPowerVault
™
are trademarks of Dell Inc. Broadcom™
is a registered trademark of Broadcom Corporation. Intel™
is a registered trademark of Intel Corporation in the U.S. and other countries.Microsoft®
™
, Windows™
, Windows Server™
, and Active Directory™
are either trademarks or registered trademarks of Microsoft® Corporation in the United States and/or other countries.Table of Contents
1 Introduction ... 1
1.1 Audience ... 1
1.2 Using an EqualLogic SAN in a Virtualized Exchange Environment ... 1
1.3 The Rest of this Paper ... 2
2 Mailbox Server I/O Profiling ... 3
2.1 Test System Configuration ... 4
2.1.1 VMware ESX Host Configuration ... 5
2.2 Baseline I/O Profile Study using Windows 2008 R2 iSCSI Initiator ... 11
2.3 Array Type Study using Windows 2008 R2 iSCSI Initiator ... 15
2.4 RAID Type Study using Windows 2008 R2 iSCSI Initiator ... 16
2.5 Database Volume Layout Study using Windows 2008 R2 iSCSI Initiator ... 18
2.6 SAN Scalability Study using Windows 2008 R2 iSCSI Initiator ... 20
2.7 I/O Profiling using the ESX Software iSCSI Initiator and Advanced Multipathing Plug-In (MEM) for VMware vSphere 4.1 VMFS ... 22
3 Sizing EqualLogic Storage for Exchange Server 2010 Mailbox Role in a Virtualized Environment.... 27
3.1 Exchange Random IOPS and EqualLogic Storage ... 27
3.1.1 Disk Drive Rotational Speed ... 27
3.1.2 Number of Disk Drives in the Array ... 27
3.1.3 RAID Policy ... 27
3.2 EqualLogic Storage – Usable Capacity ... 28
3.3 Sizing EqualLogic Storage for Microsoft Exchange ... 29
3.3.1 Microsoft Guidelines for Storage Capacity Sizing ... 29
3.3.2 Microsoft Guidelines for Storage Performance Sizing ... 30
3.3.3 Database Capacity Sizing Process ... 31
3.3.4 Log Capacity Sizing Process ... 32
3.3.5 Database I/O Performance Sizing Process ... 33
3.3.6 Log I/O Performance Sizing Process ... 34
3.4 Choosing EqualLogic Array ... 34
3.4.1 Selection Process ... 35
3.4.2 Sizing Example for an Exchange 2010 Environment Supporting 5000 users ... 36
4 Exchange 2010 Database Availability Group (DAG) Studies ... 38
4.2 Test Configuration ... 38
4.3 Active/Passive Configuration ... 41
4.3.1 Active/Passive Configuration Test Results ... 41
4.4 Active/Active Configuration ... 43
4.4.1 Active/Active Configuration Test Results ... 44
5 Best Practice Recommendations ... 47
5.1 Storage ... 47
5.2 SAN Design ... 48
5.3 Configuring Host Server Resources ... 49
5.4 ESX Host Configuration ... 50
5.5 Virtual Machine and Guest OS Configuration ... 50
5.6 Exchange Server Configuration ... 52
1 Introduction
Many organizations will be looking to move to Microsoft® Exchange 2010 to achieve lower TCO while taking advantage of new capabilities that enhance performance, reliability and scalability of the platform. Key innovations in the core Exchange 2010 platform focus on providing enhanced mailbox resiliency. To achieve optimal use of new Exchange 2010 mailbox resiliency features such as Database Availability Groups and online mailbox moves, it is critical that your database storage infrastructure be properly designed and sized to meet storage and I/O performance requirements.
IT organizations are also continuing to improve the efficiency and availability of enterprise applications through the use of datacenter virtualization architectures. With the release of VMware® vSphere™ 4.1, VMware has included new functional enhancements that improve integration and performance of Storage Area Networks (SANs).
The goal of this paper is to present the results of a series of Exchange 2010 storage I/O performance tests conducted by Dell Labs, and provide storage sizing guidance and best practices based on those results for designing and running Microsoft® Exchange 2010 hosted by VMware vSphere 4.1 running on Dell PowerEdge blade servers and Dell™ EqualLogic™ SAN. This paper also provides generalized storage sizing formulas for planning storage requirements, and an example reference configuration for supporting a 5000 user Exchange environment.
1.1 Audience
This paper is intended for Solution Architects, Storage Network Engineers, System Administrators and IT Managers who need to understand how to design, properly size and deploy Microsoft® Exchange Server 2010 running on the VMware vSphere virtualization platform and Dell EqualLogic storage. It is expected that the reader has working knowledge of Microsoft® Exchange deployment and operation, VMware system administration and EqualLogic based iSCSI SAN operation.
1.2 Using an EqualLogic SAN in a Virtualized Exchange Environment
Using an EqualLogic SAN as your storage infrastructure in virtualized Exchange environments provides multiple benefits:Dynamic Infrastructure EqualLogic PS Series SAN coupled with Dell PowerEdge™ servers running VMware ESX Server enable quick provisioning, high
performance, scalability, and the flexibility to dynamically deploy server, storage and application stacks.
Seamless Scalability SAN storage can easily be expanded to accommodate for increased capacity or performance needs. Similarly, hardware resources and operating systems for Exchange servers can be quickly deployed in the virtualized server infrastructure as needed.
Data Protection EqualLogic SAN features such as volume cloning and Exchange aware snapshots with Auto Snapshot Manager/Microsoft® Edition (ASM/ME)
can provide comprehensive protection and granular recovery of Exchange data at no additional cost.
Efficient Management Instead of managing disconnected pools of Direct Attached Storage (DAS), an EqualLogic SAN can be managed as one single entity with pools of data allocated for specific purposes. With virtualized storage and server infrastructure, there are fewer physical assets to manage, hence overall cost of managing and supporting the physical infrastructure is reduced over time.
Path Redundancy EqualLogic Multi-Path I/O software for Microsoft® Windows Server 2008 and the Advanced Multipathing Extension Module (MEM) for VMware vSphere 4.1 allow you to take full advantage of multiple network adapters to provide network path redundancy and I/O load balancing.
High Availability Using built-in HA and DR features of Exchange 2010, customers can improve availability of their Exchange environment in case of a local or a site failure. By encapsulating exchange roles in virtual machines, dissimilar hardware can be used at DR sites to support failover from production sites. Redundant, hot serviceable components in all of the infrastructure solution components improve component level availability, thus maximizing application uptime.
1.3 The Rest of this Paper
The rest of this paper contains the following sections: Section 2, Mailbox Server I/O Profiling on page 3
Section 3, Sizing EqualLogic Storage for Exchange Server 2010 Mailbox Role in a Virtualized Environment on page 27
Section 4, Exchange 2010 Database Availability Group (DAG) Studies, on page 38 Section 5, Best Practice Recommendations, on page 47
2 Mailbox Server I/O Profiling
To support development of this paper we deployed and tested a full-scale virtualized Microsoft® Exchange server configuration running within a VMware vSphere v4.1 virtual machine environment at Dell Labs.
In the first phase of our lab tests we conducted a series of I/O profiling studies to establish baseline Exchange Server 2010 mailbox server I/O load profiles. We used Jetstress1 to simulate Exchange I/O workloads.
In all test cases, Jetstress was run with the following load attributes:
• Background database maintenance was turned on while simulating the mailbox users I/O
• Test duration was 2 hours for each simulation run
• Database checksum was executed after completion of each test
• The maximum cache memory used by Jetstress for each database in test was 256MB Jetstress response time criteria or latency requirements for I/O:
• Database read latency threshold: 20ms
• Log write latency threshold: 10ms
1
Jetstress 2010 Beta, version 14.00.0639.013 with Exchange 2010 RTM binaries
Note: Jetstress is typically used to validate performance and stability of I/O storage subsystems before putting Exchange systems into production. Jetstress uses Exchange database (ESE – Extensible Storage Engine) binaries to simulate Exchange I/O. For more information on Jetstress, see:
Microsoft® Exchange Server Jetstress 2010:
2.1 Test System Configuration
Configuration details for the major system components in our test system configuration are provided in Appendix A on page 53. The iSCSI SAN network and test system components2 are shown in Figure 1.
2
Instead of PowerConnect M6348, PowerConnect M6220 switches can also be used for Fabric B. Figure 1 Baseline I/O Profiling Test System Configuration
2.1.1 VMware ESX Host Configuration
VMware ESX Server v4.1 was installed on the Dell PowerEdge M710 server shown in Figure 1.
Microsoft® Windows Server 2008 R2 Enterprise Edition was installed in a guest virtual machine running on the ESX host.
ESX host configuration overview:
• The mailbox VM was configured to use four virtual CPUs and 48GB of reserved memory at the ESX hypervisor layer.
• The blade server local storage was configured using the two installed disk drives configured as a RAID 1 set. A portion of this local storage was used for installation of the VMware ESX server software. The remaining local storage was formatted as a VMFS partition.
• The guest VM operating system images were created on the local VMFS data store. The
Exchange Server databases and logs were stored in volumes hosted by the externally connected EqualLogic PS6000XV array shown in Figure 1.
• Microsoft® software iSCSI initiator installed within the Exchange VM is used to directly access the database and log volumes on the EqualLogic SAN. Direct access of Exchange data and log volumes using the iSCSI initiator within the VM enables using EqualLogic features such as Exchange consistent snapshots and clones and Exchange protection tools such as Auto-Snapshot Manager (ASM)/Microsoft® Edition. Using these features is not possible when Exchange data and log volumes are exposed as VMware virtual disks (using the software or hardware initiator at the VMware ESX layer).
Physical Networking Details
In this section we describe the physical configuration of the network components shown in Figure 1 in more detail.
• Four Fabric A NIC ports on the M710 server are connected to the server LAN via a pair of stacked PowerConnect M6220 switch modules installed in the M1000e blade chassis (I/O modules A1 and A2).
• Four Fabric B NIC ports on the M710 server are connected to the iSCSI SAN via a pair of PowerConnect M6348 switch modules installed in the M1000e blade chassis (I/O modules B1 and B2). (Note: In this test configuration PowerConnect M6220 or M6348 switches could have been used in both Fabric A and Fabric B)
• Each of the M6348 switches is connected to the top-of-rack PowerConnect 6248 switches via Link Aggregation Groups (LAG). The LAGs combined two 10GbE uplinks to create 20Gbps total bandwidth using the uplink modules on respective switches.
• The two top-of-rack 6248 switches are also connected via a 20Gbps LAG group using a second uplink module installed in each switch.
Note: For more details describing Exchange 2010 support requirements for Hardware Virtualized environments, see the following Microsoft® TechNet article:
Exchange 2010 System Requirements:
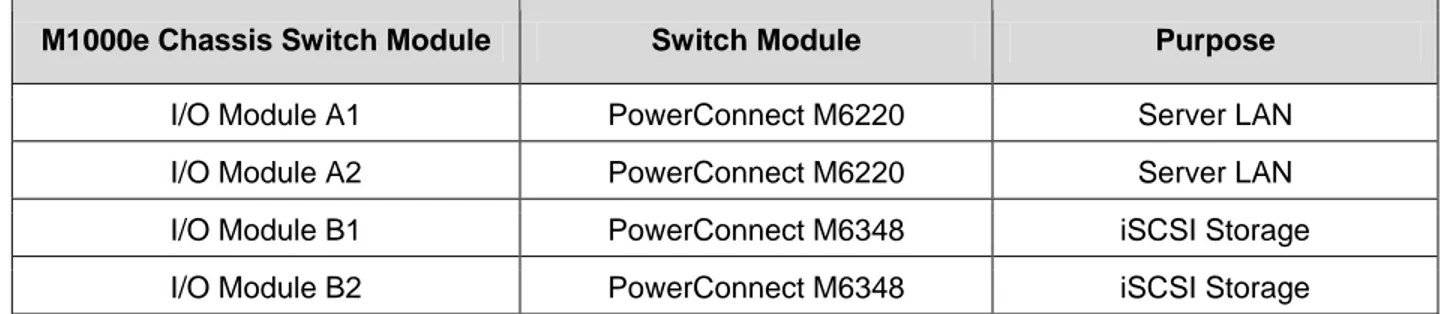
Table 1 and Table 2 show the functional assignment of blade server switch fabric modules and server NIC port assignments.
M1000e Chassis Switch Module Switch Module Purpose
I/O Module A1 PowerConnect M6220 Server LAN
I/O Module A2 PowerConnect M6220 Server LAN
I/O Module B1 PowerConnect M6348 iSCSI Storage
I/O Module B2 PowerConnect M6348 iSCSI Storage
Table 1 Blade Server Fabric Switch Assignments
Blade Server I/O Module Number of NIC Ports (via
a Mezzanine card) Purpose
PowerEdge M710
I/O Module A1 2
Server LAN
I/O Module A2 2
( Total ports on Fabric A = 4 )
I/O Module B1 2
iSCSI Storage
I/O Module B2 2
( Total ports on Fabric B = 4 ) Table 2 Blade Server NIC Port Assignment Details
ESX Virtual Network Details
On the ESX host, the virtual switches were configured as follows:
• One virtual switch was configured for iSCSI SAN access, with the four M710 NIC ports on Fabric B as uplinks.
• One virtual switch was configured for server LAN access with the four M710 NIC ports on Fabric A as uplinks.
The vSwitch configuration on ESX host and blade server NIC port assignments to those vSwitches is listed in tables below. It is recommended to enable jumbo frames on the host vSwitch. The Broadcom 5709 NICs installed on blade servers support jumbo frames. Note: In ESX 4.1, Jumbo Frames are not supported when using hardware iSCSI initiators at the ESX layer.
vSwitch vmnics assigned Purpose
vSwitch0 vmnic0, vmnic1, vmnic2, vmnic3 Server LAN vSwitch1 vmnic6, vmnic7, vmnic8, vmnic9 iSCSI Storage Note: vmnics 4, 5, 11 and 12 connected to fabric C were not used in test. More information on vmnic enumeration within vSphere hosts on the Dell PowerEdge M1000e can be found
here:
Table 3 vSwitch and vmnic assignments
As a best practice, different kinds of network traffic should be physically or logically segregated. In our environment, we segregate network traffic by using VLANs for different classes of traffic (tagged packets) at the virtual switch layer3
Table 4
. VLAN and port group assignments (on vSwitch0, the Server LAN) for the vSphere host were assigned as shown in .
VLAN ID Port Group Label Port Group Type Purpose
101 Service Console Service Console Service console management traffic 102 VMkernel VMkernel Kernel level traffic (e.g. vMotion) 103 VM Network – Public Virtual Machine Guest VM traffic (Exchange
client/server LAN)
104 VM Network – Private Virtual Machine Guest VM traffic (ie. Exchange server private replication) Table 4 vSwitch0 VLAN and Port Group Assignments
3
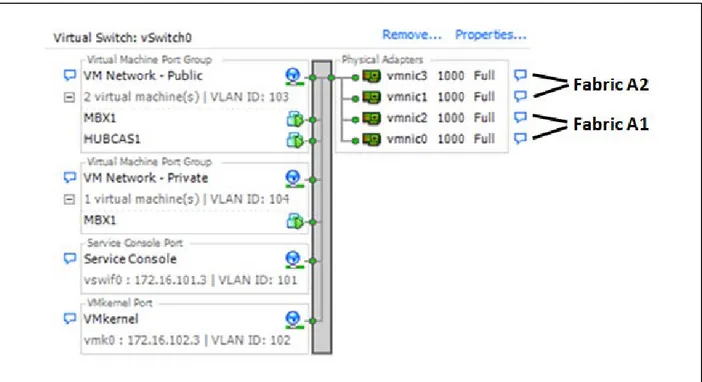
The vSwitch0 configuration on the ESX host is shown in Figure 2.
The vSwitch1 configuration on the ESX host is shown in Figure 34
4
Only virtual machine MBX1 was used in the Jetstress studies. HUBCAS1 VM was shut down.
. The iSCSI initiator in the Exchange mailbox VM was used to access the database and log volumes on the EqualLogic SAN in this
configuration.
Figure 2 vSwitch0 Configuration
Virtual Machine NIC Assignments and Networking
The virtual network adapter assignments for the mailbox server VM (using the Windows 2008 R2 iSCSI initiator within the VM) are as follows:
• The native OS iSCSI initiator within the guest OS VM was used to connect the data volumes on EqualLogic iSCSI storage.
• Two virtual NICs were configured within the mailbox server VM connecting to the virtual switch (vSwitch0) configured for server LAN access on respective VLANs.
• Four virtual NICs were configured within the mailbox server VM connecting to the virtual switch (vSwitch1) configured for storage.
• The EqualLogic Host Integration Toolkit5 (HIT) was installed in the VM to provide the EqualLogic DSM (Device Specific Module) and enable MPIO (Multi-path I/O) to storage.
Table 5 shows the virtual machine NIC assignments.
Virtual Network Adapter
Adapter Type vSwitch Port Group VLAN
# 1
E1000 vSwitch0 VM Network - Public 103
# 2 VM Network - Private 104
# 3
VMXNET 3 vSwitch1 VM Network – iSCSI N/A # 4
# 5 # 6
Table 5 Exchange mailbox VM NIC Assignments
5
The EqualLogic Host Integration Toolkit is available at the following download location (support login ID required):
Note: The load balancing policy was configured at the vSwitch for load balancing across the multiple NIC uplinks. The default policy was used, which is ‘Route based on the originating virtual switch port ID’. For further information, see the following VMware Information Guide article:
VMware Virtual Networking Concepts,
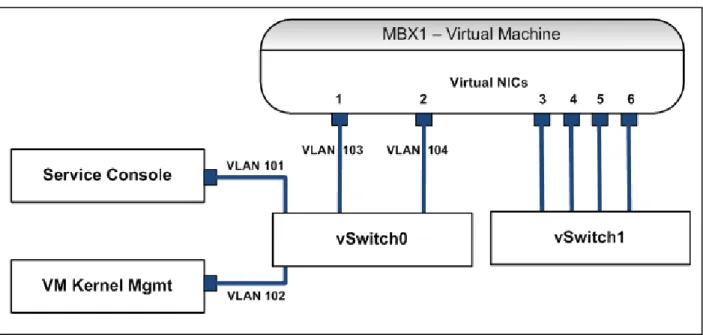
The Exchange mailbox virtual machine virtual network adapter and VLAN connectivity described in Table 5 is shown in Figure 4.
Figure 5 shows the Exchange mailbox VM hardware device configuration, including the network adapters for the configuration shown in Figure 4.
2.2 Baseline I/O Profile Study using Windows 2008 R2 iSCSI Initiator
The goal of this test was to establish baseline I/O performance characteristics of the test system configuration in support of Microsoft® Exchange Server 2010 end-user mail operations (via Microsoft® Outlook or other mail clients).In the baseline I/O profile study, we simulated Exchange Server 2010 user mailboxes with different IOPS requirements per user profile. A single EqualLogic PS6000XV array configured using RAID 50 was used for hosting the database and log volumes. The test system topology is shown in Figure 1 on page 4. The EqualLogic Array configuration used corresponds to that shown for “Volume Layout Test #1” in Table 9 on page19.
Exchange Server 2010 mail operations generate a certain amount of IOPS (I/O Operations per Second) per operation between server and storage. Microsoft® has provided a TechNet article6
For example, a user mailbox with 150 messages sent or received per day with 9MB Database cache allocated per user mailbox correlates to 0.18 IOPS if the database is configured in the stand-alone mode, and correlates to 0.15 IOPS if the database is configured in copy mode (Exchange Database Availability Group, or “DAG”). These values correspond to the IOPS generated on the database only, 2GB mailbox size and for an average message size of 75KB. They do not include the IOPS required for other
Exchange mailbox server activities such as log writes, log replication and database maintenance. Mailbox which includes tables for estimating Exchange 2010 Mailbox IOPS based on different user profiles. The user profile is defined by how much database cache is used per user, and how many messages each user sends and receives per day.
6
Understanding Database and Log Performance Factors: Figure 5 MBX 1 Virtual Machine Properties
databases can have replicated database copies configured if the mailbox servers hosting them are configured as part of a DAG. The servers in a DAG can host copies of mailbox databases from other servers in the DAG. Each server can host multiple databases but only one copy instance per database. Test parameters for this configuration are shown in Table 6.
Microsoft Exchange:
Simulated # of Users 5000 Simulated mailbox size 512MB
Mailbox databases 4 x standalone, 1250 users per database
Database volumes 1024GB each, one per mailbox database (4 total), GPT Disks, 64KB NTFS allocation unit size
Log volumes 150GB each, one per mailbox database), GPT Disks, 64KB NTFS allocation unit size
Storage Array
PS6000XV: 15K 450Gb SAS disks, 14 disks as RAID 50, 2 x 450GB as hot spares A single (default) was pool used
Table 6 Test Configuration Parameters for I/O Baseline Profile
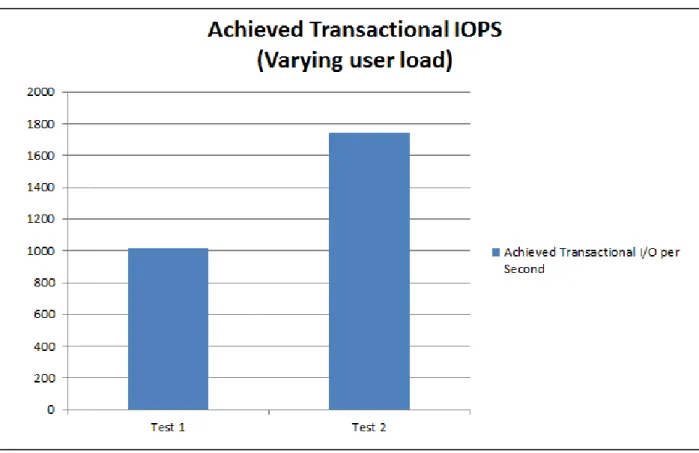
Test results for two user profiles that met the latency requirements of Jetstress are illustrated in Figure 6 below. The two user loads that were simulated were for 5000 users running at 0.2 IOPS per user and 0.35 IOPS per user respectively. A 0.2 IOPS per user load corresponds to a user profile of 150 messages sent /received per day with 9MB cache allocated per mailbox if the database is configured in a stand-alone mode, or 200 messages sent / received per day with 12 MB cache allocated per mailbox if
database is in copy mode. A 0.35 IOPS per user load corresponds a user profile of almost 300 messages sent / received per day with 18MB cache allocated per mailbox in standalone mode, or 350 messages sent / received per day with 21MB cache allocated per mailbox in the copy mode.
The achieved transactional IOPS includes both read and write database IOPS during the test. Additional IOPS were incurred on storage for log write operations and database background maintenance read activity. These additional IOPS are not included7 in the results shown in Figure 6 as these IOPS support achieving the effective transactional I/O. The achieved transactional IOPS is generally used for
communicating user profile IOPS. As seen in Figure 6, the average IOPS increases with applied user load.
7
Database IOPS is the standard metric for sizing mailbox users based on the IOPS per mailbox profile. Figure 6 Measured IOPS: Comparison for Two Different Mailbox Profiles (User Loads)
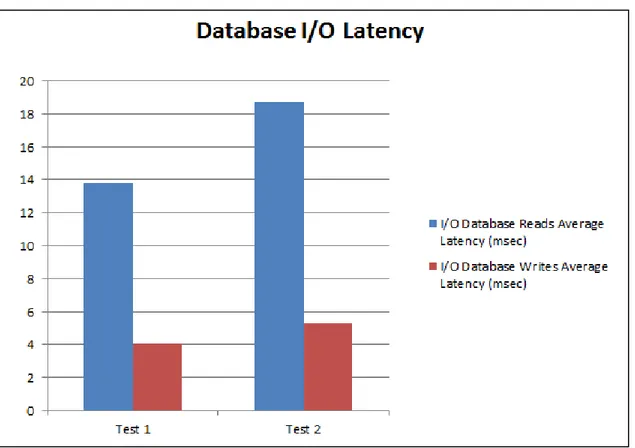
Database I/O latencies are illustrated in Figure 7 below for each test.
As the generated load increases, the total measured IOPS from storage increases. The corresponding latency also increases with IOPS, but within acceptable limits. The results of this test show that the PS6000XV array configured with RAID 50 can provide up to 1750 IOPS within acceptable latency limits for Exchange 2010 hosted on VMware vSphere. This translates to 5000 users with an IOPS profile of 0.35 IOPS per mailbox, or 10000 users with an IOPS profile of 0.17 IOPS per mailbox. The IOPS requirement per user mailbox will depend on the number of messages sent/received per day, database configuration (stand-alone or DAG copy) and the amount of mailbox memory cache allocated per user8.
8
The IOPS requirements for a range of user profiles is illustrated in the following Microsoft® TechNet article:
2.3 Array Type Study using Windows 2008 R2 iSCSI Initiator
The goal of this test was to measure variation in storage I/O performance for different EqualLogic PS Series array types. Each array type supports a different disk drive type and drive count. The
configurations were identical to the configuration in section 2.2 except for the array type, disk drive type and in the case of the PS6500E the number of disk drives.
The Microsoft® iSCSI initiator was used within the mailbox VM for connecting to the iSCSI volumes on the storage array. Test parameters for this configuration are shown in Table 7.
Microsoft Exchange:
Simulated # of Users 5000 Simulated IOPS per user mailbox 0.35
Mailbox databases 4 x standalone
Database volumes 1024GB each, one per mailbox database (4 total), GPT Disks, 64KB NTFS allocation unit size
Log volumes 150GB each, one per mailbox database (4 total), GPT Disks, 64KB NTFS allocation unit size
Storage Arrays
Test #1: • 15K 450GB SAS disks
PS6000XV:
• 14 disks as RAID 50
• 2 disks as hot spares
Test #2: • 7.2K 1024GB SATA II disks
PS6500E:
• 46 disks as RAID 50
• 2 disks as hot spares
Test #3: • 10K 600GB SAS disks
PS6000X:
• 14 disks as RAID 50
• 2 disks as hot spares Table 7 Test Configuration Parameters for Array Type Study
The average database IOPS obtained with the different array types are shown in Figure 8. The disk latency response times stayed within a 17ms - 20ms range for all configurations.
As shown in Figure 8, the PS6000XV array provides more IOPS than the PS6000X array. This is due to use of the 15K RPM SAS drives, as compared to the 10K RPM SAS drives in the PS6000X. The PS6500E array with SATA II drives produced similar IOPS as the PS6000XV. This was due to the increased drive count in the PS6500E (46 x 7.2K SATA II drives, two hot spares) as compared to the PS6000XV (14 x 15K SAS drives, two hot spares). Random IOPS performance over time depends on the rotational speed of the available drives. In general, higher RPM drives yield more IOPS.
2.4 RAID Type Study using Windows 2008 R2 iSCSI Initiator
The goal of this test was to measure the difference in storage I/O performance when comparing RAID 10 to RAID 50 volumes. In Test #1, a single EqualLogic PS6000XV array configured using RAID 10 hosted both the database and log volumes. In Test #2 a single EqualLogic PS6500E array configured using RAID 10 hosted both the database and log volumes. The configuration used for these tests is identical to the configuration used for the Baseline I/O Profile Study (Section 2.2), with the following exceptions:
• RAID 10 is used instead of RAID 50
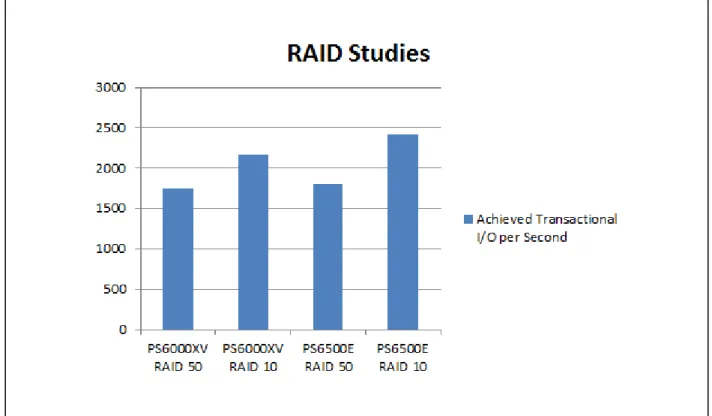
• Database volume sizes are 650GB each instead of 1024GB each on the PS6000XV array The average database IOPS obtained using both RAID 10 and RAID 50 are shown in Figure 9 below. The disk latency response times stayed within a 17ms - 20ms range for both configurations.
• Using the PS6000XV, the RAID 10 configuration provided up to 2166 IOPS and RAID 50
provided up to 1750 IOPS. RAID 10 provided approximately 25% greater IOPS for the same user Figure 8 Array Types Study - Average Database IOPS
load. RAID 50 incurs additional disk I/O overhead for parity calculations and additional reads/writes to disk (4 disk I/O operations) to support a single application write operation. In comparison, RAID 10 just mirrors an application write operation to a second disk drive
(generating an additional 2 disk I/O operations). Using the PS6500E, RAID 10 supported up to 2414 IOPS and RAID 50 supported up to 1805 IOPS. RAID 10 provided approximately 33% greater IOPS for the same user load.
• Using the same EqualLogic PS6000XV array, we were able to configure 1024GB database volumes in the RAID 50 test, and smaller 650GB database volume sizes for the RAID 10 test. This was due to the fact that, for a given volume size, the data mirroring policy in RAID 10 will consume more physical disk space than the parity data policy implemented in RAID 50.
2.5 Database Volume Layout Study using Windows 2008 R2 iSCSI Initiator
The goal of this test was to measure variation in storage I/O performance for different database volume and log volume placement strategies. A single EqualLogic PS6000XV array configured with RAID 50 was used for hosting both the database and log volumes. The physical test configuration used was identical to the configuration used in the Baseline I/O Profile test (Section 2.2).Exchange mailbox test parameters for this configuration are shown in Table 8 below.
Microsoft Exchange:
Simulated # of Users 5000 Simulated IOPS per user mailbox 0.35
Mailbox databases 4 x standalone
Database volumes See Table 9
Log volumes See Table 9
Storage Array
PS6000XV: 15K 450GB SAS disks, 14 disks as RAID 50, 2 x 450GB as hot spares A single (default) pool was used.
Table 8 Test Configuration Parameters for Database Volume Layout Study
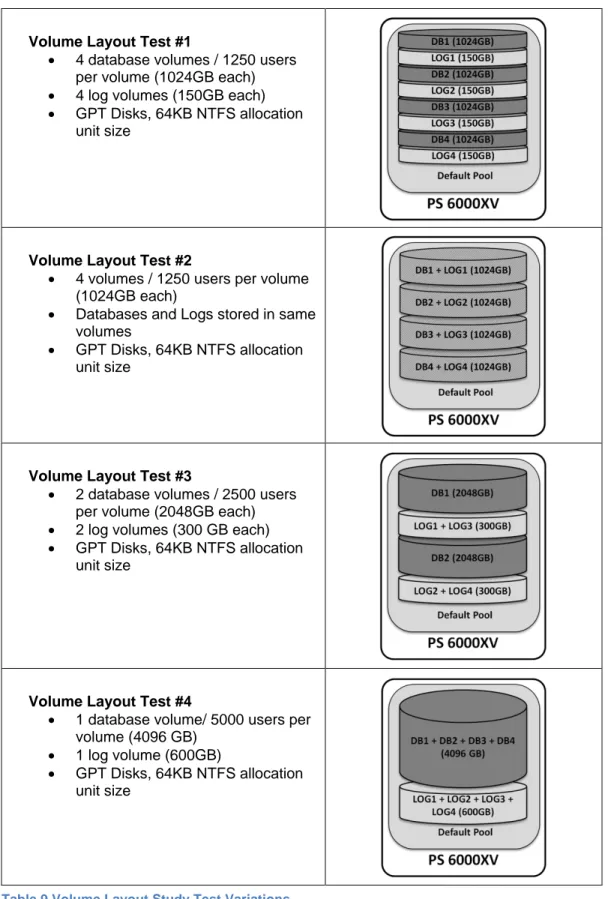
We tested four variations for placement and size of database and log volumes. These test variations are shown in Table 9.
Volume Layout Test #1
• 4 database volumes / 1250 users per volume (1024GB each)
• 4 log volumes (150GB each)
• GPT Disks, 64KB NTFS allocation unit size
Volume Layout Test #2
• 4 volumes / 1250 users per volume (1024GB each)
• Databases and Logs stored in same volumes
• GPT Disks, 64KB NTFS allocation unit size
Volume Layout Test #3
• 2 database volumes / 2500 users per volume (2048GB each)
• 2 log volumes (300 GB each)
• GPT Disks, 64KB NTFS allocation unit size
Volume Layout Test #4
• 1 database volume/ 5000 users per volume (4096 GB)
• 1 log volume (600GB)
• GPT Disks, 64KB NTFS allocation unit size
Table 9 Volume Layout Study Test Variations
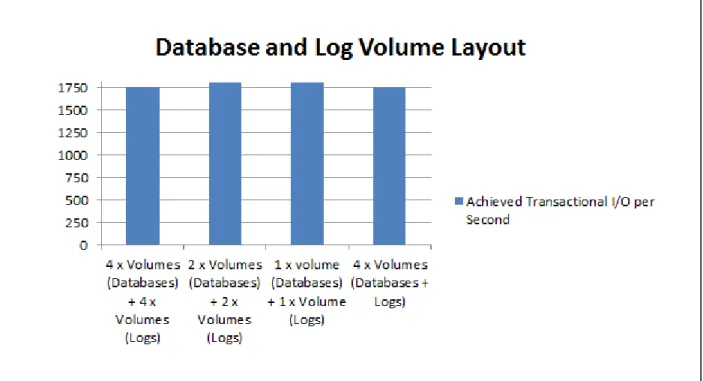
The average database IOPS obtained for each of the volume layout test configurations are shown in Figure 10. The disk latency response times stayed within a 17ms - 20ms range.
All four volume layout configurations achieved IOPS in the same range (all results within 5%). It can be inferred that for a given number of databases, the placement within one or more volumes will not cause noticeable changes in average IOPS.
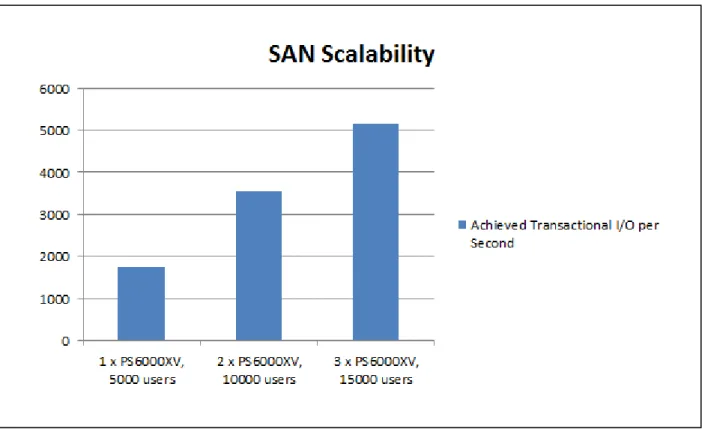
2.6 SAN Scalability Study using Windows 2008 R2 iSCSI Initiator
The goal of this test was to measure how I/O performance scales as you increase the number of EqualLogic PS Series storage arrays (members) with a group. The configurations tested included one, two and three EqualLogic PS6000XV members with the group. User mailbox transactional I/O load was increased linearly during the tests.Test parameters for this configuration are shown in Table 10.
Microsoft Exchange:
Simulated # of Users 5000 Simulated IOPS per user mailbox 0.35
Mailbox databases 4 x standalone
Storage Arrays:
Disk configuration for each PS6000XV: 15K 450GB SAS disks, 14 disks as RAID 50, 2 hot spares
Test #1:
• 1 x PS6000XV
• 5,000 users
• Database volumes: 4 x 1024GB each
• Log volumes: 4 x 150GB each
Test #2:
• 2 x PS6000XV (in one EqualLogic storage pool)
• 10,000 users
• Database volumes: 4 x 2048GB each
• Log volumes: 4 x 300GB each
Test #3:
• 3 x PS6000XV (in one EqualLogic storage pool)
• 15,000 users
• Database volumes: 4 x 3072GB each
• Log volumes: 4 x 450GB each Table 10 Test Configuration Parameters for Array Scalability Study
The average database IOPS obtained with the different array quantities is shown in Figure 11. The disk latency response times stayed within a 17ms - 20ms range for all configurations.
Figure 11 shows that average database IOPS scaled almost linearly between the one, two and three member test configurations. This is because the EqualLogic Peer Storage architecture scales the available storage resources linearly to provide the required IOPS. The storage processing resources in EqualLogic storage architecture that linearly scale as we add more arrays include: the number of disk drives, the number storage processing controllers including on-board cache, and the number storage network interfaces. The number of network interfaces on the server side was kept constant and this did not matter since the workload was random I/O and therefore was more disk bound and storage processor bound. The network switches were capable of supporting the arrays under test. If additional arrays are deployed for scalability, a different network switch configuration may be required based on port count requirements and workload characteristics.
2.7 I/O Profiling using the ESX Software iSCSI Initiator and Advanced
Multipathing Plug-In (MEM) for VMware vSphere 4.1 VMFS
The I/O profiling tests described in the previous sections used the Microsoft® Windows 2008 R2 iSCSI initiator within the Exchange mailbox VM to connect to the Exchange data volumes on the EqualLogic SAN. Those volumes were directly accessed by the Windows 2008 VM and natively formatted as NTFS. In this section, we describe and compare the results for a similar I/O profiling test with the following main differences in the iSCSI initiator stack:
• The VMware ESX software iSCSI initiator at the host (hypervisor) level was used instead of the Windows 2008 iSCSI initiator.
• The volumes on the EqualLogic SAN were directly accessed by the ESX hypervisor using the ESX software iSCSI initiator and were natively formatted using the VMware VMFS3 filesystem. Figure 11 SAN Scalability Study - Average Database IOPS
• Virtual hard drives were created on the VMFS3 formatted volumes. These virtual hard drives were formatted with NTFS file system by the guest OS (Windows Server 2008 R2).
• Instead of Native Multipathing (NMP) available in ESX, the EqualLogic Multipathing Extension Module (MEM) for vSphere was used to handle iSCSI connection management and load balancing.
Except for the main differences described above and additional changes (described later in this section) to the ESX virtual networking configuration to support use of the ESX software iSCSI initiator, we used the same system configuration in this test that was used for the previous I/O profiling tests (see Section 2.1). A separate vSwitch was configured for ESX iSCSI traffic and configured with four 1GbE (M710 Fabric B) NICs as uplinks as shown in Figure 12 and Figure 13.
To take advantage of EqualLogic aware multi-path I/O, the EqualLogic Multipathing Extension Module9
• Automatic connection management
(MEM) for VMware vSphere was installed on the ESX host. The EqualLogic MEM provides the following enhancements to the standard VMware vSphere multipathing functionality:
• Automatic load balancing across multiple active paths
• Increased bandwidth
• Reduced network latency
As a general best practice, you should install the EqualLogic MEM on ESX hosts connected to
EqualLogic SAN. Detailed steps for configuring the MEM plug-in and ESX host initiator with EqualLogic storage volumes can be found in the MEM installation guide10.
9
EqualLogic Multi-path Extension Module for VMware vSphere is available for download at:
10
See the VMware Integration page on the Dell EqualLogic Support site (support ID required):
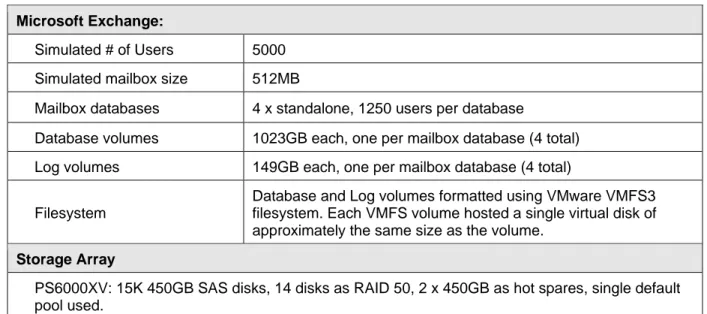
The test parameters are shown in Table 11.
Microsoft Exchange:
Simulated # of Users 5000 Simulated mailbox size 512MB
Mailbox databases 4 x standalone, 1250 users per database
Database volumes 1023GB each, one per mailbox database (4 total) Log volumes 149GB each, one per mailbox database (4 total) Filesystem
Database and Log volumes formatted using VMware VMFS3 filesystem. Each VMFS volume hosted a single virtual disk of approximately the same size as the volume.
Storage Array
PS6000XV: 15K 450GB SAS disks, 14 disks as RAID 50, 2 x 450GB as hot spares, single default pool used.
Table 11 Test Configuration Parameters for ESX iSCSI Initiator I/O Profile
The configuration of the virtual switch (“vSwitchISCSI”) for iSCSI access is shown in Figure 12. In this configuration, the software iSCSI initiator provided by the ESX host was utilized. Four VMkernel ports were created and attached to the ESX iSCSI software initiator. Each physical NIC uplink was exclusively assigned to each port. Figure 13 shows the virtual machine virtual network adapter and VLAN
connectivity using the software iSCSI initiator provided by the VMware ESX server.
The average database IOPS obtained in this test configuration is shown in Figure 14. By comparison, results for the same user profile I/O load using the Windows 2008 R2 based iSCSI initiator configuration are also shown. The disk latency response times stayed within a 17ms - 20ms range for both
configurations. Approximately 10% more database IOPS within required latency limits were achieved using the ESX software iSCSI initiator in conjunction with the EqualLogic MEM. This difference could be translated to more IOPS per user, or support for more users before reaching the design latency limit. In both modes four 1GbE NICs were used for storage connectivity while the physical memory and
processing resources remained constant. The difference in performance can be attributed to other differences in the storage stack configurations.
The choice for which iSCSI initiator you use may depend on other factors such as backup and recovery process requirements and compatibility. The Windows iSCSI initiator allows for use of the Equallogic Auto Snapshot Manager (ASM) / Microsoft Edition (ME). ASM/ME provides the ability to create consistent Exchange aware snapshots or clones of data volumes using storage hardware based snapshots or clones. It also enables other third party backup solutions based on Windows VSS (Volume Shadow copy Services) to utilize storage hardware based snapshots or clones for Exchange Server data backup. If you use the ESX software initiator on the host then it is not possible to utilize application consistent snapshots or clones provided by the EQL VSS provider. Other backup methods should be investigated and
deployed in this case.
If you choose to use the iSCSI initiator in the Windows guest VM for Exchange Server deployment, it would still be beneficial to use the ESX software initiator on the host, along with the EqualLogic MEM, for other virtual machines and applications. In cases where both guest and host based initiators are used, we recommended you configure separate virtual switches for each storage type access path as follows: one vSwitch with its own set of NIC uplinks for iSCSI guest initiators, and one vSwitch with a second set of uplinks for the ESX software or hardware initiator.
3 Sizing EqualLogic Storage for Exchange Server
2010 Mailbox Role in a Virtualized Environment
In an Exchange 2010 environment, storage sizing will depend on capacity and performance (IOPS) requirements of the mailbox servers. These requirements are determined mainly by the number of users, the mailbox sizes and the mailbox IOPS profiles that need to be met. Other operational factors within Exchange Server 2010 systems described later in this section can also affect sizing requirements. The primary storage components that need to be sized correctly are the databases and the logs. The results from I/O Mailbox Profile studies in Section 2 were used for determining the sizing guidance in this section.3.1 Exchange Random IOPS and EqualLogic Storage
Exchange 2010 uses 32KB block I/O and the I/O pattern is random. The acceptable latency limits for Exchange Server database read IOPS is 20ms and for Log write IOPS is 10ms11
The maximum number of random IOPS that an EqualLogic PS Series storage array can provide will depend on the disk drive rotational speeds, the number of drives in the array and the RAID type.
.
3.1.1 Disk Drive Rotational Speed
As shown in Section 2.3, higher RPM drives can provide higher array IOPS. Among the three drive types offered in PS Series arrays, SAS 15K drives offer the highest level of random I/O performance
measurable as IOPS. The EqualLogic PS6000XV array supports 15K RPM SAS drives. SAS 10K drives offer lower level of random I/O performance than SAS 15K drives. EqualLogic PS6000X and PS6500X arrays support 10K RPM drives. SATA II drives are the lowest performing drives offered in EqualLogic PS Series arrays. The PS6000E and PS6500E arrays support 7.2K SATA II drives.
If your IT department has standardized on a particular type of drive for deployments, then the choice would be pre-determined. If there is no preference for a particular drive type, then our recommendation would be to use the sizing process guidelines in this document.
3.1.2 Number of Disk Drives in the Array
Another factor that can affect array IOPS is the number of drives in the array. EqualLogic PS Series storage arrays come in two drive count form factors: the PS65x0 series (supports 48 drives per enclosure) and the PS60x0 series (supports 16 drives per enclosure).
3.1.3 RAID Policy
PS arrays support various RAID levels that include RAID 5, RAID 50, RAID 10 and RAID 6. RAID 50 offers a good combination of useable capacity and performance as compared with RAID 5 or RAID 6. In RAID 50, application writes are balanced across multiple RAID 5 sets to reduce write overhead
performance impact. Hence RAID 50 is recommended as compared with RAID 5.
RAID 10 provides more IOPS than RAID 50 for the same type of workload. This is because RAID 50 incurs parity calculation along with necessary reads and writes to disk (4 disk I/O operations) to support a
11
Temporary spikes up to a maximum of 100ms are considered acceptable. Reference:
single application write operation. In comparison RAID 10 just mirrors or writes an application write operation to a second disk drive (2 disk I/O operations per application write operation).
Table 12 shows measured Exchange 2010 database IOPS levels for EqualLogic PS Series arrays that will meet the maximum latency requirements12 for Exchange Server 2010 database I/O deployed in a VMware vSphere virtualized environment.
Measured Transactional IOPS(a)
Model(b) RAID 50 RAID 10
PS6000XV 1745 2165
PS6000X 1100 1365
PS6500E 1800 2400
(a) Transactional IOPS in this table are based on tests run with background database maintenance (up to 4 databases). The values in this table correspond to use of a single EqualLogic PS Series array which is dedicated to hosting Exchange data only. If other applications in the virtual environment share the same array(s) for hosting data, then these values should not be used.
(b) SSD drives supported by the EqualLogic PS6000S are not considered due to the reduced IOPS requirement with Exchange Server 2010 as compared to earlier versions, plus cost economics and lower SSD drive capacity levels.
Table 12 Recommended Exchange Database IOPS Based on RAID Policy and Array Type Other RAID policy factors that you should consider:
• Degraded mode operation due to drive failure: RAID 10 provides better response times than RAID 50 in degraded situations when one of the drives in a RAID set fails.
• RAID 10 sets complete rebuilds faster than RAID 50 sets when a failed disk is replaced with a new one.
3.2 EqualLogic Storage – Usable Capacity
Useable capacity available from a storage array will depend on the drive size within array, drive count and RAID type primarily. Generally SATA II drives offer higher levels of capacity per drive as compared to SAS 15K or 10K RPM drives. The PS6500 series supports a total of 48 drives as compared to PS6000 series with 16 drives.
RAID 50 offers more useable space than RAID 10, since half the number of disk drives in RAID 10 set is used for mirroring. On the contrary, only a few disk drives are used in RAID 50 for storing parity
12
The acceptable latency limits for Exchange Server database read IOPS is 20ms and for Log write IOPS is 10ms.
Note: The values in Table 12 are based on the results of the Jetstress tests run on the specific system configurations described in Section 2. In other environments, measured IOPS will vary based on the actual configuration deployed. These values should be used as a starting point for validating results of further testing using Exchange parameters (mailbox profile
information. Table 13 shows the useable space available on each array type with corresponding disk drive sizes based on model type.
Model Disk Drive Size & (Model)
RAID 50 Useable Capacity (GB)
RAID 10 Useable Capacity (GB)
PS6000 Series
250GB (E) 3000 1750
300GB (X , XV) 3600 2100
400GB (X) 4800 2800
450GB (XV) 5400 3150
500GB (E) 6000 3500
600GB (X, XV) 7200 4200
1TB (E) 12000 7000
2TB (E) 24000 14000
PS6500 Series
500GB (E) 19500 11500
600GB (X) 23400 13800
1TB (E) 39000 23000
2TB (E) 78000 46000
Table 13 Usable Capacity - PS Series Arrays
3.3 Sizing EqualLogic Storage for Microsoft Exchange
In this section we discuss general guidelines for Exchange storage capacity sizing. We also present sizing processes and formulas that can be used to calculate storage capacity and IOPS requirements. 3.3.1 Microsoft Guidelines for Storage Capacity Sizing
Mailbox server database capacity will depend primarily on mailbox quota size, database white space and mailbox database recoverable items. Together, these factors along with storage quota and associated overheads determine the actual mailbox size for a user. Additional operational factors impacting database size are space for content indexing, offline database maintenance space, recovery database needs and overhead space for future growth or contingency. Backup SLA time requirements and space for database copies to support high availability will also impact capacity calculations. Mailbox server log capacity primarily depends on the user messaging activity profile (messages sent/received per day).
Each transaction log file in Exchange 2010 has a size of 1MB. Per Microsoft® guidelines, the number of log files increase by a factor 1.9 if the average message size doubles to 150KB and by factor 3.8 if message size is above 150KB. Other log capacity factors include:
• Log retention requirements to support backup schedules
• Move mailbox operations
Additional factors13
• Additional log capacity for database copies per mailbox server include:
• Replay lag space for copies
• Log truncation mechanisms
3.3.2 Microsoft Guidelines for Storage Performance Sizing
Database storage performance sizing depends on the messaging profile. The messaging profile is defined as the average number of messages sent/received by each user per day. The messaging profile determines the number of IOPS generated by each user. Estimated IOPS values also depend on the database cache and memory allocated per user. Microsoft® provides tables for estimating database cache and IOPS per mailbox based on messaging activity. The guidelines14 provided by Microsoft® are for users running in Outlook cached mode and include database and content indexing IOPS.
Additional IOPS estimation factors can include:
• Desktop search engines on client machines
• Third-party applications including mobile messaging, client outlook mode (online / cached)
• Content indexing I/O for search cataloging.
Non-transactional (non-user related) I/O impacts on the database can include:
• I/ O for background maintenance
• Online maintenance and message records management (MRM) activities.
Overhead IOPS for contingency or future growth need to be considered as well (20% recommended). If database copy is enabled, then log write I/O can typically comprise 40% to 50% of database write IOPS in Exchange 2010. Additional log I/O will be incurred for database copies for logs to be read and replicated to copy servers. This is typically 10% of active log writes per database copy. Overhead IOPS (typically 20%) need to be considered as well.
13
More details are available in the following Microsoft® TechNet article:
14
S
Note: Microsoft® provides a detailed discussion of database and log performance factors, including the IOPS generated for a range of messaging profiles, in the following TechNet article:
Understanding Database and Log Performance Factors:
Note: Microsoft® provides detailed capacity sizing guidelines for databases and logs in the following TechNet article:
Understanding Mailbox Database and Log Capacity Factors:
3.3.3 Database Capacity Sizing Process
The goal of this process is to calculate an estimated total database size. Table 14 shows the recommended process to follow.
Variable(units )
Formula Definition/notes
Step #1: determine user profile variables:
NU Number of mailbox users (including future growth)15
MQ (MB) Mailbox storage Quota or limit, per user
MSR Number of Messages Sent/Received per day (the mailbox profile)
AMS (KB) Average Message Size Step #2: calculate White Space per User (WSU):
WSU (MB) = MSR x AMS/1024 White space per user. Step #3: Calculate Dumpster Size per User (DSU):
DSU (MB) = MSR * AMS/1024 * 14 + (0.012 * MQ)
+ (0.058 * MQ)
• By default, Exchange 2010 stores deleted items for 14 days. • Single item recovery requires 1.2% additional space16 • Calendar version logging (enabled by default) adds 5.8%
additional space.
.
Step #4: Calculate Mailbox size per User (MBU):
MBU (MB) = MQ + WSU + DSU Actual mailbox size per user Step #5: Calculate estimate for Total Database Size (DBS):
DBS (MB) = NU * MBU * 1.2 Projected total database size. We recommend using a 20% overhead factor.
Step #6: Calculate estimate for Individual Database Size (IDBS):
IDBS (MB) = DBS / DB Count See the section “Estimating Database Count” following this table. Step #7: Calculate estimate for Database Volume Size (DVS):
DVS (MB) = IDBS * 1.1 * 1.2 • Content indexing requires an additional 10% of space per database within the same volume.
• After all factors are considered 20% overhead space within the database volume is recommended.
Additional sizing factors to consider:
• Offline database maintenance, if required, will require an additional 110% of volume space.
• Recovery databases, if planned, will need additional space based on the number of databases to be recovered in the separate space.
Table 14 Calculation Process - Total Database Size Estimation
15
Excludes mobile user requirements 16
For more details, see Microsoft® TechNet Article “Understanding Mailbox Database and Log Capacity Factors”:
Estimating Database Count
Before you can calculate IDBS, you need to determine the database count. The number of databases is typically determined based on backup requirements. The size of a single database can be determined based on backup needs such as backup throughput and SLAs. If you are not performing full daily backups or using Exchange Server 2010 DAG (Database Availability Groups) for high availability and restore, then the requirements calculator17
In a DAG model, Microsoft® recommends database sizes up to 2TB. In standalone mode, the database size recommendation is 100GB. Sometimes, instead of size, the maximum number of users to be managed per database may determine the database count. Also, the increased manageability of multiple database configurations could be a factor in determining database count. The particular edition (Standard or Enterprise) of Exchange server 2010 will limit the database count as well. If 24 x 7 background
database maintenance is enabled, additional I/O will be incurred per database deployed. If the number of databases is high, then the background database maintenance I/O will have an impact on normal mailbox I/O. With high database counts, this becomes an important consideration.
provided by Microsoft® can be used to determine database count.
Additional optional factors: Offline database maintenance, if required, will need 110% of target volume space. Recovery databases, if planned, will need additional space based on the number of databases to be recovered in separate space.
3.3.4 Log Capacity Sizing Process
The goal of this process is to calculate an estimated Log Volume Size. Table 15 shows the recommended process to follow. Additional considerations for the calculation process shown in Table 15:
• Different backup models such as weekly full backups would warrant log retention for more than 3 days. In that case, more space needs to be provisioned based on the backup period.
• In a DAG model, the database copy can have a lag in replicated log content from the source database specified by number of lagged days (the replay lag time). Based on this, more space will need to be provisioned for logs depending on the replay lag period.
• Move mailbox operations will require more log space based on the number of mailboxes to be moved across databases periodically for maintenance operations.
17
S
Recommendation: After determining database count, deploy one database per volume in EqualLogic Storage. This enables isolation of management and backup operations for each database to a single volume. In this case, the number of storage volumes required is equal to the database count determined above.
Variable(units) Formula Definition/notes
Step #1: Define process inputs:
LFS (MB) = 1.0 (constant) Exchange 2010 log file size is 1MB.
DB Count
(from database capacity sizing process)
See the section “Estimating Database Count”
NU Number of mailbox Users (including future growth)
MSR Number of Messages Sent/Received per day (the mailbox profile)
AMS (KB) Average Message Size
Step #2: Define Number of transaction Logs generate per User per day (NL):
NL = MSR * 0.2
Step #3: Calculate Message Size Factor (MSF):
MSF = 1.0 (AMS <= 75KB) = 1.9 (AMS <= 150KB) = 3.8 (AMS > 150KB)
Step #4: Calculate Number of users per Database (NDB):
NDB = NU / DB Count
Step #5: Calculate Total Log Capacity per day per Database (TLC):
TLC (MB) = NDB * NL * MSF * LFS
Step #6: Calculate estimate for Log Volume Size (LVS):
LVS (MB) = TLC * 3 * 1.2 • Total log capacity per volume will affected by backup and high availability options.
• If daily backups are taken, then it is a best practice to provision space for 3 days of logs. The same recommendation applies if a DAG deployment model is used.
• We recommend using an additional 20% overhead factor. Additional sizing factors to consider:
• Offline database maintenance, if required, will require an additional 110% of volume space.
• Recovery databases, if planned, will need additional space based on the number of databases to be recovered in the separate space.
Table 15 Calculation Process - Log Volume Size Estimation 3.3.5 Database I/O Performance Sizing Process
The goal of this process is to calculate an estimated total database IOPS requirement. Table 16 shows the recommended process to follow.
Recommendation: After determining database count, you should deploy one log volume per database in EqualLogic Storage. This enables isolation of database and logs for management, recoverability and backup operations via hardware snapshot providers such as the EqualLogic Auto-Snapshot Manager (ASM) for Microsoft® Exchange. However, this approach may require more drive letter assignments to mount all volumes, and the use of volume mount points may be necessary. S more information on Exchange LUN architecture.
Variable(units) Formula Definition/notes
Step #1: Define process inputs:
MSR
(from database capacity sizing process)
Number of Messages Sent/Received per day (eg. the mailbox profile)
NU Number of mailbox Users (including future growth)
Step #2: Define Standalone Database Overhead (if not deployed in a DAG) (SDBO):
SDBO = 1.2 (if DAG not used) = 1.0 (if DAG used)
Derived from recommendations provided by Microsoft® TechNet18
Step #3: Calculate IOPS per User (IOPU):
.
IOPU = SDBO * (MSR / 1000)
Step #4: Calculate estimate total Database IOPS required (DBIOP):
DBIOP = NU * IOPU * 1.2 A 20% overhead is recommended for sizing IOPS. Table 16 Calculation Process - Database I/O Performance Sizing
3.3.6 Log I/O Performance Sizing Process
The goal of this process is to calculate an estimated total database IOPS requirement. Table 17 shows the recommended process to follow.
Variable(units) Formula Definition/notes
Step #1: Define process inputs:
DBIOP (from database I/O performance sizing process)
Total database IOPS required
Step #2: Define Total Log IOPS (LIOPS):
LIOPS = ( (DBIOP * 0.5 * 0.5) + (DBIOP * (number of DAG copies – 1) * 0.1) ) * 1.2 LIOPS formula considerations:
• The amount of log I/O is about 50% of the database write I/O.
• Database write I/O is about 40% to 60% of total database I/O based on number of messages per user and database high availability model. An average value of 50% will fit most cases.
• An additional 10% log I/O will be incurred for each additional database copy in a DAG • A 20% overhead factor is recommended.
Table 17 Log I/O Performance Sizing Process
3.4 Choosing EqualLogic Array
Follow these steps to choose an EqualLogic array for Exchange Server 2010 deployments. These steps assume a DAG scenario with at least 2 database copies (primary and secondary).
According to Microsoft® recommended best practices for Exchange 2010, it is okay to host databases and logs on the same RAID set and drives in a DAG scenario. However, copies of a database must be hosted on separate drives or RAID sets.
The following selection process will recommend the same approach, as follows:
• Database and log volumes are hosted on same array(s)
• Two database copies in a DAG deployment model (primary and secondary databases) spread across separate arrays.
3.4.1 Selection Process
1. Determine the RAID type needed (RAID 50 or 10) based on recommendations in Section 3.1. 2. Calculate the total Exchange Server capacity needed using the total number of database and log
volumes needed and the size of each database and log volume. Other storage requirements besides Exchange server capacity requirements need to be considered as well. For example, space required for volume snapshots reserve or volume replication to support backup and restore operations. Also, any space required for cloned volumes would be an additional factor.
3. Based on total capacity needed, use Table 13 to determine type and quantity of storage array(s) required. Choose the appropriate drive size within an array based on useable capacity from the array and total capacity needed.
4. Determine if the number of arrays of the same model chosen in step 3 will satisfy total database IOPS (DBIOP) needed based on the values in Table 12. Consider any additional IOPS needed in the DBIOP value – for example IOPS for mobile users. You may need to add additional arrays of the same model to satisfy the user IOPS needs. Table 12 includes IOPS for logs within the same array as well as database maintenance (for up to four databases). Do not add log IOPS to the total requirement when using this table.
5. If step #4 did not provide satisfactory solution or the array model chosen in step #3 does not match the IOPS needs in step #4, go back to step #3 and choose a different array model. 6. Once an appropriate array model with correct drive size is determined, and the total number of
such arrays is determined, you will need to deploy twice the number of arrays if you require support for database copies. If more than two database copies are required, scale up the number of arrays needed as necessary.
In standalone mode, it is a generally accepted best practice (for recoverability purposes) to have databases and logs deployed on different RAID sets and physical drives. . However this may not be possible in smaller deployments with limited storage resources. In smaller environments using Dell EqualLogic storage arrays, the transaction log volumes can be hosted within the same pool and disk drives as the database volumes without performance loss. EqualLogic arrays provide high reliability via RAID and redundant hot swappable components. Additional data backup solutions for offline data copies can be implemented for supplemental protection. However, if high levels of data protection or
recoverability are required, as is usually the case in large environments, data replication via Exchange DAGs should be used.
3.4.2 Sizing Example for an Exchange 2010 Environment Supporting 5000 users In this example we will use the following User Profile:
• 5000 users
• 2GB mailbox quota size
• 150 messages sent/received per day per user (very heavy user profile)
• Average message size = 75KB We will use the following system parameters:
• The system will be designed for high availability, using Database Aggregation Groups (DAG): 2 copies
• Maximum database size = 1024GB
Using the Database Capacity Sizing Process in 3.3.3:
NU = 5000 MQ = 2048MB MSR = 150 AMS = 75KB
WSU = 11MB White space per user: 150 x 75/1024
DSU = 297MB Dumpster size per user:
(150 x 75 x 14 / 1024) + (2048 x 0.012) + (2048 x 0.058)
MBU = 2356MB Mailbox size per user: 2048MB + 11MB + 297MB
DBS = 11505GB Total database size: 5000 x 2356
DB = 12 Database Count:
(DBS / max DB size: 11505 / 1024 = ~12)
IDBS = 959GB Individual database size: 11505 / 12
DVS = 1266GB Database volume size: 959 x 1.1 x 1.2
Using the Log Capacity Size Estimation process in Section 3.3.4:
DB Count = 12 Therefore number of log volumes = 12
NU = 5000 MSR = 150 AMS = 75KB
NL = 30 Number of transaction logs generated per user per day: 150 * 0.2 = 30
MSF = 1 Message size factor: 1 (AMS <= 75KB)
NDB = 417 Number of users per database: 5000 / 12
TLC = 12510MB Total log capacity per day per database: 30 x 417 x 1 x 1MB
LVS = 48GB Log volume size:
12510 x 1.1 x 3 x 1.2 / 1024
(TLC x 10% for mailbox move x 3 days x 20 % overhead)
• Assume maximum 10% of users moved within log truncation window for maintenance operations.
• Recommended log truncation failure protection (due to backup or replication) is 3 days and overhead space is 20%.
Table 19 Log Volume Capacity Sizing Process
For 12 database volumes and 12 log volumes, the total capacity needed for all volumes can be calculated using values from Table 18 and Table 19 as follows:
Total capacity needed for all volumes = 15768GB (database volume size x 12 + log volume size x 12) To estimate total IOPS required we estimate IOPS required per user = 0.15. Based on that estimate, we calculate total database IOPS required:
Total database IOPS required = 5000 x 0.15 x 1.2 = 900 IOPS (number of users x IOPS per user x 20% overhead)
Based on a total capacity requirement of 15780GB (from Table 13), the PS6500 array with 500GB SATA drives in a RAID 50 configuration can be chosen. Based on a total database IOPS requirement of 900 (from Table 12), the PS6500 can satisfy the IOPS requirement of 900 IOPS for the user profile under consideration. Hence the PS6500 can be a good fit for this profile. Two PS6500 will be needed to support an active and passive copy for each database. The active copy of a database should be hosted on one array and the passive on the other array.
Processor and memory sizing recommendations are provided by Microsoft®,in the following TechNet article:
Mailbox Server Processor Capacity Planning:
4 Exchange 2010 Database Availability Group (DAG)
Studies
In the second phase of our lab tests we conducted a series of I/O profiling studies to characterize mailbox server I/O and Database Availability Group (DAG) replication I/O in an Exchange 2010 environment.
4.1 Workload Simulation and Server Performance Criteria
We used Microsoft® Exchange Load Generator 201019
• We simulated a workload of 5000 simultaneous Outlook 2007 users
(Loadgen) to simulate a client I/O workload in the Exchange test configuration. In all test cases, Loadgen was run with the following loading attributes:
20
• Background database maintenance and scheduled maintenance was turned off.
in online mode, with search operations turned off, for a duration of four hours.
Our Exchange server performance criteria for the Loadgen testing consisted of the following:
• Average disk latency for active database volumes maintained less than 20ms, with maximum measured latency less than 100ms.
• Mailbox server counter “MSExchangeIS\RPC Average latency” less than 10ms on average.
• Mailbox server counter “MSExchangeIS\RPC Requests” less than 70 at all times.
• Mailbox server counter “MSExchangeIS Mailbox(_Total)\Messages Queued For Submission” less than 50 at all times.
4.2 Test Configuration
The test configuration for the Loadgen studies is shown in Figure 15 and Figure 16 below. The actual server connectivity to storage is identical to the test configuration shown in the Jetstress studies (Section 2.1).
• Two PowerEdge M710 servers were deployed for Exchange Server 2010 roles
• Each M710 server hosted two virtual machines – one for the Exchange Server 2010 mailbox role and another for Exchange Server 2010 Hub Transport / Client Access Server (CAS) Roles.
• The Mailbox Server VM was configured with 8 vCPUs and 48 of memory (reserved in ESX host). The Hub / CAS VM was configured with 4 vCPUs and 6GB of memory (reserved). Storage connectivity is similar to the illustration in Jetstress studies above.
• The two mailbox server VMs across the two blade servers were configured as members of an Exchange 2010 DAG (Figure 15 below). If one of the servers incurs failure, the other server in the DAG can continue hosting databases that were active on the failed server via a fail-over process. Passive database copies are maintained on the second server and kept synchronized with the active copies via log replication. One of the Hub/CAS servers was utilized for configuring the file share witness for the DAG.
• The two Hub / CAS VMs were configured as members of a Network Load Balancing (NLB) cluster (unicast mode and single affinity). One virtual NIC was used for NLB and another for public access. NLB was used to load balance the Exchange CAS services (Figure 16 below)
19
See Microsoft® TechNet Article: “Tools for Performance and Scalability Evaluation”,
20
• Each Hub/CAS VM was configured with two virtual NICs for server LAN connectivity – one for public access and other for NLB private connectivity (unicast NLB mode). Also each VM was configured with 4 virtual NICs of type vmxnet3 for iSCSI connectivity. The Hub Transport queue database and logs were hosted on a separate volume on the same group member array used by their respective mailbox servers.
• Each mailbox VM was configured with two virtual NICs for server LAN connectivity – one for public access and other for DAG replication. Also each mailbox VM was configured with 4 additional virtual NICs of type vmxnet3 for iSCSI connectivity using the iSCSI initiator in the VM.
• The Microsoft® iSCSI initiator in the guest Windows Server 2008 R2 OS was used for storage connectivity. The VMs were installed with EqualLogic MPIO DSM (HIT kit) for EqualLogic aware multi-path I/O to the EqualLogic SAN.
• On each ESX host, the server-side LAN virtual NICs for all VMs were connected to vSwitch0 and storage iSCSI virtual NICs of all VMs were connected to vSwitch1. vSwitch0 used the onboard Broadcom 5709 1GbE NICs on server Fabric A to connect to the external M6220 switches for server LAN access. vSwitch1 used the 1GbE Broadcom 5709 NICs on fabric B to connect to the external M6348 switches for storage access.
Two PowerEdge M610 servers on the same blade M1000e chassis were deployed for other test
components. One M610 server hosted the Active Directory VM and the vSphere Virtual Center VM. The second M610 server hosted the client VM used for executing the simulation tool Loadgen and the monitoring VM for running Windows PerfMon and EqualLogic SAN Headquarters.
Figure 15 Test Configuration: DAG Loadgen
4.3 Active/Passive Configuration
In the first test configuration, all active databases in the DAG were hosted on one Mailbox Server and its corresponding PS Series member within the EqualLogic SAN group. The second mailbox server hosted the passive database copies on a second group member. A single EqualLogic PS Group was configured with two storage pools, Pool A and Pool B, with each pool comprised of one storage array. Each of the two mailbox servers in the configuration connected to database and log volumes in respective pools on the EqualLogic SAN. Since Exchange is configured in copy mode, the database and log volumes can be hosted on the same RAID set (EqualLogic member). Four mailbox databases were created with one database and one log volume each within one storage pool. The four database copies also included a database and log volume each on the second storage pool. This database and storage configuration is shown in Figure 17.
4.3.1 Active/Passive Configuration Test Results
Figure 18 shows virtual machine host (ESX) processor and memory utilization levels measured using the VMware esxtop utility. ESX01 is the VMware ESX server hosting the active MBX1 VM. ESX02 is the VMware ESX server hosting the passive MBX2 VM. ESX01 in this test showed slightly higher CPU utilization due to its role as the active mailbox server.