October 30, 2004
Anderson Economic Group
260 East Saginaw
East Lansing, Michigan 48823 Tel: (517) 333-6984
Fax: (517) 333-7058
http://www.AndersonEconomicGroup.com
The Economic Benefits of
Wayne State University
Estimating the net additional income and tax revenue
the University brings to Southeastern Michigan
Prepared by:
Patrick L. Anderson, Principal
Ilhan K. Geckil, Economist
Scott Watkins, Consultant
Table of Contents
I. Executive Summary... 1
Purpose of Report ... 1
Three Benefits of the University ... 1
Overview of Approach ... 2
Conservative Approach to Measuring Net Benefits ... 3
Overview of Findings ... 3
First Benefit: Income from WSU Expenditures ... 4
Second Benefit: Cultural and Knowledge Endowments ... 5
Third Benefit: Human Capital ... 5
Fiscal Impact and State Return on Investment ... 7
II. Overview of Wayne State University... 9
Brief History ... 9
Table: Wayne State School and College Foundations .... 9
WSU Today ... 9
Standing in the Academic World ... 10
Recent Developments ... 10
III. Comparative Analysis ... 12
Enrollment ... 12
Table: Fall Enrollment ... 12
Figure: Fall Enrollment, 2002 v. 2003 ... 13
Student To Teacher Ratio ... 13
Figure: Student to Teacher Ratio, 2003 ... 14
Table: Student to Faculty Ratio, 2003 ... 14
Tuition ... 15
Table: Undergraduate Tuition & Fees ... 15
Composition of Student Body ... 15
Table: Composition of Student Body, 2002-2003 ... 16
Finances ... 16
Table: Revenue and Expenditure, 2002-2003 ... 17
Table: Operating v. Non-Operating Revenues, 2002-2003 ... 18
Table: Major Revenue Sources: 2002-2003 ... 18
Table of Contents
IV. Socio-Economic and Demographic Analysis. 21
Population & Number of Households ... 21
Table: Population ... 21 Table: Households ... 22 Income Figures ... 22 Table: Income ... 23 Labor Market ... 23 Table: Employment ... 24
Figure: Annual Unemployment Rates, 1994-2004 ... 24
Household Expenditure Analysis ... 25
Table: Household Expenditures ... 25
V. Expenditure and Income Analysis ... 27
Definition of “Impact” ... 27
Economic Impacts ... 27
Table: Substitution Effect Parameters ... 29
Table: WSU Net Economic Impact by Region ... 30
VI. Cultural and Knowledge Endowments ... 31
Knowledge Creation ... 31
Technology Transfer ... 31
Quality of life ... 33
Midtown Detroit and Wayne State University ... 34
VII. Human Capital Analysis ... 35
The Third Benefit of the University ... 35
The Economic Benefits of Increasing Human Capital ... 35
Methodology for Human Capital Analysis ... 36
Results ... 38
Figure: Additional Graduates, Retirements, and Net Change ... 40
Figure: Net Increase in Income and State Tax Revenue ... 41
Figure: Human Capital Simulation Model ... 42
VIII. Fiscal Impact Assessment ... 43
Fiscal Impact of Expenditures ... 43
IX. State Return on Investment... 45
Financial Return ... 45
Unquantifiable Returns ... 45
Appendix A: Maps ...A-1
Map: Universities & Community Colleges in the Region ... 2Map: Projected Population Growth and Campus Locations ... 3
Map: Median Household Income, 2003 ... 4
Map: Average Household Tuition Expenditures, 2003 ... 5
Map: Graduate & Undergraduate Students ... 6
Map: Alumni Residence Map ... 7
Map: Residential Location of WSU Employees ... 8
Appendix B: Data Tables ...B-1
Table: Input Data: Expenditures and Income ... 2Table: Direct and Indirect Economic Impact Analysis ... 4
Table: Human Capital Input Data ... 5
Table: Fiscal Impact Analysis ... 7
Table: State Return on Investment ... 8
Appendix C: About Anderson Economic Group C-1
Firm Profile ... 1Past Clients ... 1
Quality Assurance Policy ... 2
List of Figures
List of Figures
FIGURE 1. Fall Enrollment, 2002 v. 2003... 13
FIGURE 2. Student to Teacher Ratio, 2003 ... 14
FIGURE 3. State Appropriations, 2001-2002 v. 2002-2003 ... 20
FIGURE 4. Annual Unemployment Rates, 1994-2004 ... 24
FIGURE 5. Additional Graduates, Retirements, and Net Change ... 40
FIGURE 6. Net Increase in Income and State Tax Revenue ... 41
List of Tables
TABLE 1. Wayne State School and College Foundations... 9
TABLE 2. Fall Enrollment... 12
TABLE 3. Student to Faculty Ratio, 2003... 14
TABLE 4. Undergraduate Tuition & Fees ... 15
TABLE 5. Composition of Student Body, 2002-2003... 16
TABLE 6. Revenue and Expenditure, 2002-2003 ... 17
TABLE 7. Operating v. Non-Operating Revenues, 2002-2003... 18
TABLE 8. Major Revenue Sources: 2002-2003 ... 18
TABLE 9. Change in State Appropriations ... 19
TABLE 10. Population ... 21
TABLE 11. Households ... 22
TABLE 12. Income... 23
TABLE 13. Employment ... 24
TABLE 14. Household Expenditures ... 25
TABLE 15. Substitution Effect Parameters ... 29
TABLE 16. WSU Net Economic Impact by Region ... 30 TABLE 17. Input Data: Expenditures and Income... B-2 TABLE 18. Direct and Indirect Economic Impact
Analysis... B-4 TABLE 19. Human Capital Input Data ... B-5 TABLE 20. Fiscal Impact Analysis ... B-7 TABLE 21. State Return on Investment ... B-8
Executive Summary
I. Executive Summary
PURPOSE OF REPORT This report provides a comprehensive analysis of the net economic and fiscal benefits that Wayne State University (“WSU” or “The University”) provides the regional economy. The report is the culmination of a six-month study of the uni-versity’s operations, expenditures, employment, enrollment, and research activi-ties; the role of the university within the region’s economy, demography, and geography; and the increased earnings that accrue to graduates of the university.
Net Benefits Defined. Throughout the report, we identify, and where possible, estimate the net economic benefits of the University. These are the benefits after
deducting the likely earnings, expenditures, or employment that would other-wise have occurred in the region without the operation of WSU.
Region Defined. We define the region as the seven-county area of Livingston, Macomb, Monroe, Oakland, St. Clair, Washtenaw, and Wayne. We also consider in the report the three-county metro Detroit area.
THREE BENEFITS OF
THE UNIVERSITY In this report, we identify three categories of benefits from the University:1. The expenditure and income benefits, which we estimate as the increase in earnings among area residents due to the expenditures of the university, its employees, and vendors.
In this analysis we also estimate the net impact of WSU, meaning the impact after subtracting out the benefits of the expenditures that would be made by other institutions if WSU were no longer in operation. This is a far more con-servative measure than that used in commonly-exaggerated “economic impact” reports.
Please see“Expenditure and Income Analysis” on page 27 for further discus-sion on the expenditure and income benefits of WSU.
2. The cultural and knowledge endowments, which include the gains in
knowl-edge from research in the University in life sciences, physical sciences, applications in manufacturing, health and medicine, and other fields, as well as the cultural activities and preservation and dissemination of art, literature, and other cultural endowments.
These are impossible to quantify, and easily and quickly move across state and national borders. However, while we do not quantify the cultural and knowledge endowments, they are likely to be the longest-lasting benefits of the university.
“Cultural and Knowledge Endowments” on page 31 provides further discus-sion on these benefits.
3. The human capital benefits, which we measure as the increase in earnings from students that would not otherwise have attended college if WSU were not teaching students in its current locations.
We base our analysis on an estimate of the share of WSU’s student body who would not otherwise attend a comparable higher education institution and gain a comparable increase in earnings, and who furthermore, remain in the area during their working years. Thus, we estimate the net increase in earn-ings in the region, rather than the gross earnearn-ings of all WSU grads.
Please see “Human Capital Analysis” on page 35 for further discussion on these benefits.
Other Benefits. There are other benefits that the University brings to the region. One is the improved visibility of Detroit, and the many positive experiences of visitors, students, and researchers that come to WSU. This “showcasing” benefit is important, but we have not quantified it.
Another benefit is the motivation WSU provides to students that are still in High School. WSU’s continued success in fulfilling its mission as an urban college illustrates to many young people that they can achieve a college degree, if they continue to work in High School, remedial training, or in the workforce. While important, this motivation benefit is not quantified here.
OVERVIEW OF
APPROACH Our analysis included the following steps:1. The collection and management of data from several sources, including the University, the State of Michigan, and our own library of economic and demographic data.
2. A comparison of Wayne State University to other public universities in Michigan.
3. An analysis of the socio-economic and demographic characteristics of the primary market for Wayne State University.
4. An analysis of the expenditures of WSU on payroll to researchers and non-research faculty and staff; direct WSU expenditures to vendors and govern-ments; expenditures of visitors and students; and expenditures of employees.
5. An allocation of the portion of those expenditures that represent bona fide
new or additional expenditures in the region, above those that would other-wise occur if WSU were not in operation.
6. Based on this, an economic impact analysis providing a measure of eco-nomic activity that is directly or indirectly caused by the University.
7. A qualitative analysis of other benefits the University has on the economy, but which could not be quantified.
Executive Summary
9. A fiscal impact analysis to measure new tax revenue to the state government, and identify reduced expenditures that are due directly or indirectly to the additional economic benefits of the University.
10.A calculation of partial Return on Investment on the State’s share of funding for WSU’s operations, using only the additional tax revenue to the State in the calculation.
CONSERVATIVE APPROACH TO MEASURING NET BENEFITS
The approach we take is much more conservative and realistic than most “eco-nomic impact” reports. In each category we estimate only the net benefit, that is, the benefit after subtracting out the income, expenditures, or other benefits that would have otherwise accrued to local businesses, governments, and residents. For example, we calculate the benefit of the University’s expenditures net of the likely expenditures of other institutions that would occupy the facilities if WSU were to cease operations. Similarly, we consider only the earnings of the stu-dents that would not otherwise achieve a comparable higher-education attain-ment if WSU were not in operation.
Our analysis properly accounts for economic costs and benefits, reductions in economic activity due to displacement or substitution effects, and revenue reductions and appropriations by governments. As a result, our findings are much more conservative and realistic than most “economic impact” reports. These often take all related expenditures and then “multiply” them, to derive a figure that would be more accurately called “gross related expenditures.” In contrast, this analysis only considers the net benefits actually caused by WSU’s operations.
OVERVIEW OF
FINDINGS Our comparison of Wayne State University with select other public universities Comparing WSU with Other State Universities in Michigan found that:
•Wayne State has the most diverse student body, by racial heritage, in the group. As one indicator, WSU’s student body is slightly more than 50% white, com-pared to 75% for the next lowest university, Michigan State. Along with other indicators, this indicates that Wayne State’s students are diverse ethnically, cul-turally, and socially.
•Wayne State is among the most affordable of the selected universities. The low tuition and fees make WSU an attractive option for people who might not pur-sue a college education for financial reasons.
•Wayne State relies more heavily on state appropriations than any other compa-rable university.
An analysis of WSU and competing colleges can be found at “Comparative Analysis” on page 12.
WSU’s Regional Economy
We examined the surrounding counties of Livingston, Macomb, Monroe, Oak-land, St. Clair, Washtenaw, and Wayne. This helps us understand how Wayne State’s expenditures affect the surrounding community and region, and to what extent WSU’s operations add to the region’s economy, or merely substitute for other operations. Some prominent socio-economic and demographic character-istics of the area are as follows:
•In the seven-county area, the population and the number of households are growing. Only Wayne County is losing population and households.
•Despite gains in population, the total number of employed persons has
decreased in recent years. The seven-county area lost nearly 200,000 employed people from 2000-2003, dropping from 2.4 million employed persons in the peak economic year of 2000 to 2.2 million in 2003. While employment is now growing again, this underlines the importance of WSU in maintaining an edu-cated workforce.
•Livingston County and Oakland County are the most prosperous of the seven counties. They earn, and spend, far more than any of the other counties. Wayne County is by far the least prosperous, with an average household income approximately $30,000 less than Livingston and Oakland Counties.
See “Socio-Economic and Demographic Analysis” on page 21 for further description of WSU’s regional economy.
FIRST BENEFIT: INCOME FROM WSU EXPENDITURES
Universities such as Wayne State play an important role not only in education, but also within the economies that they operate. Our analysis of the direct and indirect expenditures due to Wayne State University’s operations found that:
• Increased net expenditures of $1,076,418,127 in the 7-County Region sur-rounding WSU, due directly or indirectly to the additional activity caused by WSU in the region.
•The economic benefit of WSU on the Tri-County Region amounted to
$910,412,322. This is slightly smaller than the benefit in the 7-county region as some expenditures occur outside Wayne, Oakland, and Macomb, and also because there is less substitution possible for WSU’s services within the 3-county area than the larger region.
•WSU’s non-payroll expenditures on teaching, operations, and research have a combined net economic benefit (direct and indirect) of $327,500,723 in the 7-County Region, and 261,226,687 on the Tri-7-County Region.
•Other significant economic benefits from WSU on the 7-County Region are generated by expenditures and incomes of students ($386,095,861), faculty and staff ($337,973,332), and visitors ($24,848,210).
Executive Summary
tions in the area if WSU were not in operation. These adjustments reduced the share of expenditures we considered caused by WSU by between 10% to 90%, depending on the category of expenditures.
A more detailed discussion on the economic benefits that stem from Wayne State’s expenditures and incomes can be found in “Expenditure and Income Analysis” on page 27. Please also see Table 17, “Input Data: Expenditures and Income,” on page 2 of Appendix B, and Table 18, “Direct and Indirect Eco-nomic Impact Analysis,” on page 4 of Appendix B.
SECOND BENEFIT: CULTURAL AND KNOWLEDGE ENDOWMENTS
Aside from the quantitative measures of economic impact presented above, Wayne State University provides many other important benefits that are more difficult to quantify because of their wide reaching impacts. These include:
•The creation of new knowledge, which serves as a public good, facilitating new discoveries and methods that can improve business efficiencies, advance medi-cal care, and lead to more environmentally friendly practices, among other things.
•The introduction of new technologies to the public through licensing with pri-vate sector businesses. This, along with the University’s small business assis-tance, helps many start-up companies get off the ground, providing high-skill, high-wage jobs.
•Programs and community services that improve the quality of life in the com-munity. These include free and low cost medical care, legal aid, art and recre-ation, computer and internet access, and much more that helps keep the community healthy, well informed, and cultured.
•An interest in re-developing the Midtown neighborhood, which makes the Uni-versity and the entire area more appealing.
These benefits are difficult to measure in dollars and cents, but they are no less important than those we quantify in this report. Access to a computer may help community members find employment, a medical clinic may help stop the spread of disease, and a smoking prevention program may reduce the number of people needing long term medical care for lung cancer. Arts and cultural attrac-tions encourage businesses to locate in the area, and residents to spend their lei-sure time and money in the region. Knowledgeable individuals are more likely to start new businesses, and those relying on local institutions are more likely to keep their businesses in the region.
More discussion of the cultural and knowledge endowments attributable to WSU is in “Cultural and Knowledge Endowments” on page 31.
THIRD BENEFIT:
HUMAN CAPITAL It is common knowledge that receiving an education from a college or univer-sity can enhance an individual’s economic standing.1 There are even precise measures of this: lifetime earnings for someone with a 4-year degree are
$900,000 higher than someone with only a high school diploma; obtaining a graduate level degree leads to lifetime earnings of $1.3 million more than obtaining only a high school diploma; and those who earn a professional degree can expect to earn $3.2 million more than those who did not continue their edu-cation beyond high school.1
Wayne State’s Impact on Human Capital
Our human capital analysis was done using a sophisticated simulation model, which forecasts the increased earnings over time of the WSU graduates that remain in the regional workforce. As with our economic benefit analysis, we considered only the additional earnings of WSU graduates, and furthermore only considered those earnings of WSU graduates that would likely not have gone on to other higher education institutions. Finally, we subtracted the addi-tional earnings of WSU graduates that moved to other regions, or that retired from the workforce.
Even with these significant reductions, we found a large increase in labor earn-ings among residents in the region due directly to the operation of WSU. In par-ticular, we found that:
1. WSU likely adds about 2,200 net new graduates to the area workforce every year. By “net,” we mean graduates who would not have otherwise attended college if it were not for WSU. Note that we assume the large majority of WSU students (approximately 30,000 out of 32,000) would otherwise attend another institute of higher education.
2. Over time, we anticipate that a share of the graduates in the area retire or move out, and that within 30-40 years all graduates either retire or move out of the area. Taking this into account, over the next 10 years, we expect a total of over 20,000 net additional graduates in the regional workforce due to WSU.
See Figure 5, “Additional Graduates, Retirements, and Net Change,” on page 40.
3. These new grads will earn and spend over $93 million per year within the first 2 years of their graduation. As they grow in number, the amount of addi-tional labor earnings (in constant 2004 dollars) will grow to over $586 mil-lion within 6 years, and to $1.3 bilmil-lion by the end of the decade following the
1. Recent studies have also shown the importance of having an educated workforce to fill the knowledge based jobs that generate high wage and high growth potential. See: Patrick L. Anderson and Scott Watkins, The Life Sciences Industry in Michigan: Employment, Economic, and Fiscal Contributions to the State's Economy, (Grand Rapids, Van Andel Institute, 2003); Lou Glazer and Donald Grimes, A New Path to Prosperity? Manufacturing and
Knowledge-Executive Summary
graduation of the initial class. Note that these earnings are in addition to earnings these graduates would have earned at their lower educational attain-ment, and include only earnings from the net additional graduates due to WSU’s operations.
4. The additional personal income will result in approximately $8.4 million in additional state tax revenue per year within the first two years of graduation, growing to $100.8 million per year by the end of the decade, again in con-stant 2004 dollars.
5. Our human capital and economic benefit analyses both begin in the current year, and compare the earnings and expenditures of a region with WSU against a region without WSU. The human capital analysis, however, focuses on earnings of multiple years of graduates over decades.
Therefore, our estimate of additional earnings from graduates in the region is only accurate when ten or more years of graduates are considered. As Wayne State has been in operation for over 20 years, we observe that the decisions over the past few decades to support WSU are bearing fruit today, with addi-tional earnings among area residents. The amount of these addiaddi-tional earn-ings today is probably smaller than the amount we estimate for 10 years from now, but is still substantial.
Please see “Human Capital Analysis” on page 35 for further details on our Human Capital analysis.
FISCAL IMPACT AND STATE RETURN ON INVESTMENT
The direct fiscal impact of Wayne State University’s operations include the fol-lowing:
1. The additional tax revenues generated as a result of the higher earnings of its graduates. We estimate this in our human capital analysis for years following the current year.
2. The additional tax revenues due to additional earnings and expenditures in the region. We estimated this in our economic benefits analysis.
3. The additional tax revenue from other activity in the area from the economic benefits, cultural and knowledge endowments, and other factors that are not quantifiable or are not estimated in this report.
4. The direct costs to the state and its taxpayers for appropriations to support the University. We considered in the report only the net additional expendi-tures and the net additional earnings due to WSU. Consistent with this con-servative methodology, we consider the fiscal impact of the university to be the additional tax revenue, less the direct taxpayer-funded costs.
Our analysis indicates that the direct state taxes paid on earnings due to WSU expenditures in the area amount to $89.9 million per year. See Table 20, “Fiscal Impact Analysis,” on page 7 in Appendix B, and the discussion in “Fiscal Impact Assessment” on page 43.
As discussed above, there are important benefits of a university that are not quantifiable, and these benefits—such as improving the cultural and knowledge endowments of the area’s residents—are a primary part of the mission of most universities. However, we did attempt a partial analysis of the direct “return on investment” the State of Michigan gets from its expenditures to support WSU. For this, we compared the direct state taxes paid by the net additional earnings of graduates in the state workforce, and the net additional taxes paid due to WSU’s operations, to the direct appropriations costs. This is a conservative comparison, as the state would almost certainly continue to support other insti-tutions if WSU ceased to operate. As a result, the appropriations figure used is higher than it should be for an apples-to-apples comparison with the additional taxes paid on net additional earnings and expenditures.
Even using this conservative approach, our analysis indicates that the State of Michigan receives about $140 million in additional state taxes in the current year due directly to WSU, while appropriating approximately $245.5 million. See “State Return on Investment” on page 45. See also Table 21, “State Return on Investment,” on page 8 of Appendix B.
We recognize that this analysis is partial, as it ignores many of the important benefits of the University, and also ignores some local government costs and some state costs other than the direct appropriations. However, it does indicates an important finding: the ability of the University to attract expenditures, contri-butions, research grants, and economic activity to the area, as well to improve the earnings of its graduates. This results in the generation of direct state taxes that are a substantial portion of the direct cost of the University to the State.
Overview of Wayne State University
II.Overview of Wayne State University
Wayne State University, located in the heart of Detroit, provides a top-notch education for students from Michigan, the United States, and around the world. For geographic illustration, see Map 1, “Universities & Community Colleges in the Region,” in Appendix A.
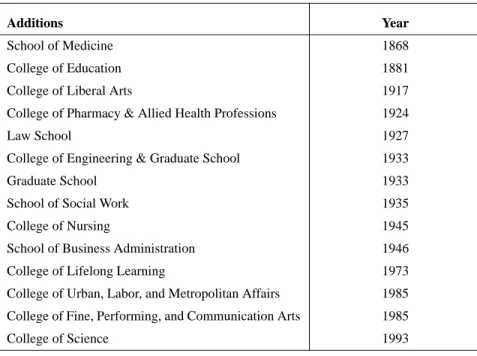
BRIEF HISTORY Wayne State University is the only urban research university in the State of Michigan. In 1933, by action of the Detroit Board of Education, the Colleges of Liberal Arts, Education, Engineering, Medicine and Pharmacy, and the Gradu-ate School were united into a university organization, temporarily called the Colleges of the City of Detroit. The name was changed to Wayne University in 1934, and to Wayne State University in 1956. See Table 1, “Wayne State School and College Foundations,” on page 9 for historical additions data.
WSU TODAY Currently, the University has 13 schools and colleges, including: •Business Administration
•Education
•Engineering
•Fine, Performing, and Communication Arts
•The Graduate School
TABLE 1. Wayne State School and College Foundations
Additions Year
School of Medicine 1868
College of Education 1881
College of Liberal Arts 1917
College of Pharmacy & Allied Health Professions 1924
Law School 1927
College of Engineering & Graduate School 1933
Graduate School 1933
School of Social Work 1935
College of Nursing 1945
School of Business Administration 1946
College of Lifelong Learning 1973
College of Urban, Labor, and Metropolitan Affairs 1985 College of Fine, Performing, and Communication Arts 1985
College of Science 1993
•Law
•Liberal Arts & Sciences
•Library and Information Science
•Medicine
•Nursing
•Pharmacy and Health Sciences
•Social Work
•Urban, Labor, and Metropolitan Affairs
Additionally, Wayne State University offers more than 350 major academic grams, including 126 bachelor's degree programs, 139 master's degree pro-grams, 60 doctoral degree programs and 32 certificate and other professional programs.
STANDING IN THE ACADEMIC WORLD
In the Lombardi Program on Measuring University Performance’s 2003 annual report, Wayne State University tied for 31st for top public research universities in the United States.1
The National Science Foundation's (NSF) annual report on Research and Devel-opment expenditures in the sciences and engineering at U.S. universities for the fiscal year 2002 showed Wayne State advancing two places in the overall rank-ing to 61st among all U.S. universities, and one place to 41st among public uni-versities. The University’s medical sciences program maintained its overall ranking of 22nd.
RECENT
DEVELOPMENTS
In 2002, the School of Medicine was awarded a 10-year, multi-million dollar contract to house and support an intramural branch of the National Institute of Health to conduct studies into maternal and infant health and disease.
Other recent Wayne State University research includes acoustic holography technology, dementia, childhood neuro-psychiatric disorders, and the life sci-ences.
Recently, Wayne State has invested over $300 million in new construction, including a $15 million recreation and fitness center, a $17.1 million Law School addition, and a $64 million Pharmacy and Allied Health Professions building.
Overview of Wayne State University
According to Detroit at 300... Then and Now, published in the summer of 2001
by Crain’s Detroit Business, Wayne State employs nearly 8,000 regular and
more than 2,000 student employees, making it the 10th-largest employer in Detroit.
III.Comparative Analysis
In this section, we compare Wayne State University to other selected universi-ties in the State of Michigan. This comparative analysis shows Wayne State’s relative expenditures and enrollment, when compared with selected universities in Michigan, and helps us understand the relationship between the University’s operations and the economy in which it operates.
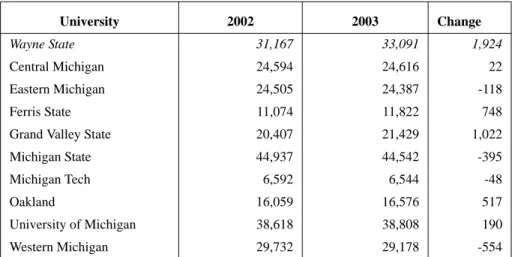
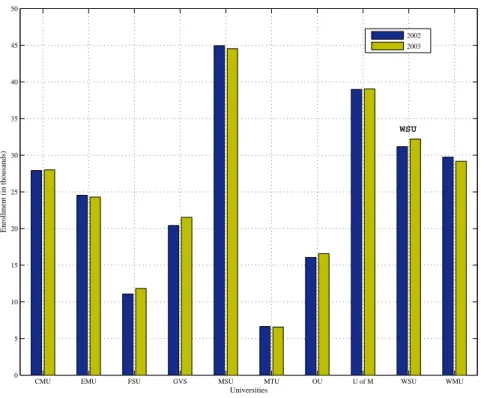
ENROLLMENT One of the most fundamental statistics in determining a university’s impact on the surrounding area is its enrollment. The more students a university has, the more powerful its impact on the area. See Table 2, “Fall Enrollment,” on page 12 for enrollment information for Wayne State and comparable universi-ties. Wayne State is the third largest university in terms of enrollment with 33,091 students in 2003. Only Michigan State University (44,542) and the Uni-versity of Michigan (38,808) are larger.
For graphical illustration, see Figure 1, “Fall Enrollment, 2002 v. 2003,” on page 13.
TABLE 2. Fall Enrollment
University 2002 2003 Change
Wayne State 31,167 33,091 1,924
Central Michigan 24,594 24,616 22
Eastern Michigan 24,505 24,387 -118
Ferris State 11,074 11,822 748
Grand Valley State 20,407 21,429 1,022
Michigan State 44,937 44,542 -395
Michigan Tech 6,592 6,544 -48
Oakland 16,059 16,576 517
University of Michigan 38,618 38,808 190
Western Michigan 29,732 29,178 -554
Source: Presidents Council, State Universities of Michigan. Date: MI Department of Man-agement and Budget, Operating Budget Requests, Appendix A, 2002-2003
Comparative Analysis
FIGURE 1. Fall Enrollment, 2002 v. 2003
STUDENT TO TEACHER RATIO
An important aspect of educational quality is the student to teacher ratio. Fewer students per teacher means greater opportunity for more individual attention. Large student to teacher ratios tend not to facilitate one-on-one interaction. See Table 3, “Student to Faculty Ratio, 2003,” on page 14 and Figure 2, “Student to Teacher Ratio, 2003,” on page 14, for university comparisons. Most of the uni-versities, including Wayne State University, fall into the 15-19 range.1
1. The ratio of full-time-equivalent students to full-time-equivalent faculty during the fall of 2003, as reported by the school to U.S. News & World Report. This excludes faculty and stu-dents of law, medical, business, and other stand-alone graduate or professional programs in which faculty teach virtually only graduate-level students. Faculty numbers also exclude grad-uate or undergradgrad-uate students who are teaching assistants.
CMU EMU FSU GVS MSU MTU OU U of M WSU WMU 0 5 10 15 20 25 30 35 40 45 50
Enrollment (in thousands)
Universities
Source & Analysis: Anderson Economic Group, www.AndersonEconomicGroup.com
Data: National Center for Education Statistics and University websites Generated Date: 12 Aug 2004
WSU 2002 2003
FIGURE 2. Student to Teacher Ratio, 2003
CMU EMU FSU GVS MSU MTU OU U of M WSU WMU 0 5 10 15 20 25 30 Ratio Universities
Source & Analysis: Anderson Economic Group, www.AndersonEconomicGroup.com
Data: Pinceton Review, Wayne State University Generated Date: 12 Aug 2004
WSU
TABLE 3. Student to Faculty Ratio, 2003
University Student to Faculty Ratio
Wayne State 17:1
Central Michigan 21:1
Eastern Michigan 19:1
Ferris State 16:1
Grand Valley State 17:1
Michigan State 19:1
Michigan Tech 12:1
Oakland 23:1
University of Michigan 15:1
Western Michigan 21:1
Comparative Analysis
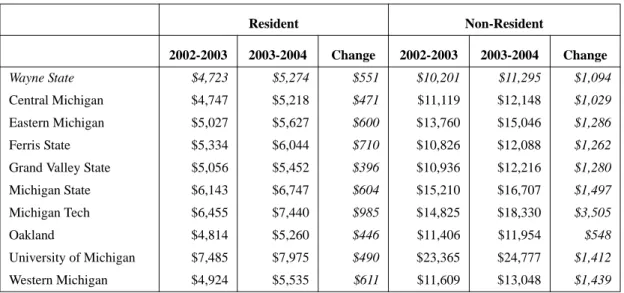
TUITION Table 4, “Undergraduate Tuition & Fees,” on page 15 compares tuition at Wayne State for both resident and non-resident students with that of other state-supported universities. “Tuition” is defined as tuition and fees for full-time, first-time undergraduate (lower division) students. In both 2002-03 and 2003-04, Wayne State was one of the most affordable of all the universities for both resident and non-resident undergraduates.
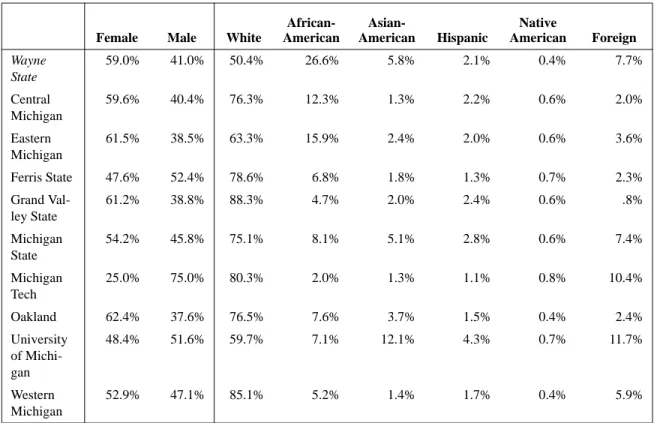
COMPOSITION OF STUDENT BODY
As evidenced in Table 5, “Composition of Student Body, 2002-2003,” on page 16 Wayne State has by far the largest percentage of minority students in Michigan, at nearly 35%. Wayne State’s largest minority group, African-Ameri-cans, account for 26.6% of the students. This is 10.7% larger than Eastern Mich-igan, the university with the next highest percentage of African-American students, at 15.9%.
Wayne State University is 59.0% female, and 41.0% male. Out of the selected universities, Wayne State has the fifth highest percentage of females. However, Michigan State is 54.2% female, and the University of Michigan is only 48.4% female.
TABLE 4. Undergraduate Tuition & Fees
Resident Non-Resident 2002-2003 2003-2004 Change 2002-2003 2003-2004 Change Wayne State $4,723 $5,274 $551 $10,201 $11,295 $1,094 Central Michigan $4,747 $5,218 $471 $11,119 $12,148 $1,029 Eastern Michigan $5,027 $5,627 $600 $13,760 $15,046 $1,286 Ferris State $5,334 $6,044 $710 $10,826 $12,088 $1,262
Grand Valley State $5,056 $5,452 $396 $10,936 $12,216 $1,280
Michigan State $6,143 $6,747 $604 $15,210 $16,707 $1,497
Michigan Tech $6,455 $7,440 $985 $14,825 $18,330 $3,505
Oakland $4,814 $5,260 $446 $11,406 $11,954 $548
University of Michigan $7,485 $7,975 $490 $23,365 $24,777 $1,412
Western Michigan $4,924 $5,535 $611 $11,609 $13,048 $1,439
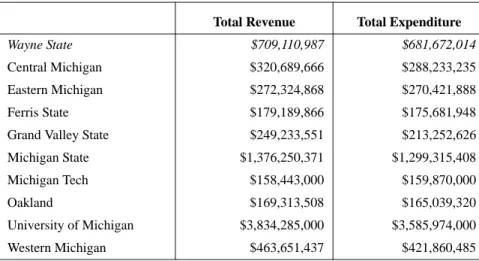
FINANCES Revenue and Expenditure figures describe not only a University’s size, but also its ability to contribute to an economy. In Figure 3, “State Appropriations, 2001-2002 v. 2001-2002-2003,” on page 20 we compare the revenue and expenditure fig-ures of select public universitites in Michigan.
Wayne State University ranks third in both total revenue ($709,110,987) and total expenditure ($681,672,014). Michigan State is second with total revenue of $1,376,250,371 and total expenditure of $1,299,315,408. University of Mich-igan is first by a wide margin, with $3,834,285,000 in total revenue and $3,585,974,000 in total expenditure.
TABLE 5. Composition of Student Body, 2002-2003
Female Male White
African-American Asian-American Hispanic Native American Foreign Wayne State 59.0% 41.0% 50.4% 26.6% 5.8% 2.1% 0.4% 7.7% Central Michigan 59.6% 40.4% 76.3% 12.3% 1.3% 2.2% 0.6% 2.0% Eastern Michigan 61.5% 38.5% 63.3% 15.9% 2.4% 2.0% 0.6% 3.6% Ferris State 47.6% 52.4% 78.6% 6.8% 1.8% 1.3% 0.7% 2.3% Grand Val-ley State 61.2% 38.8% 88.3% 4.7% 2.0% 2.4% 0.6% .8% Michigan State 54.2% 45.8% 75.1% 8.1% 5.1% 2.8% 0.6% 7.4% Michigan Tech 25.0% 75.0% 80.3% 2.0% 1.3% 1.1% 0.8% 10.4% Oakland 62.4% 37.6% 76.5% 7.6% 3.7% 1.5% 0.4% 2.4% University of Michi-gan 48.4% 51.6% 59.7% 7.1% 12.1% 4.3% 0.7% 11.7% Western Michigan 52.9% 47.1% 85.1% 5.2% 1.4% 1.7% 0.4% 5.9%
Comparative Analysis
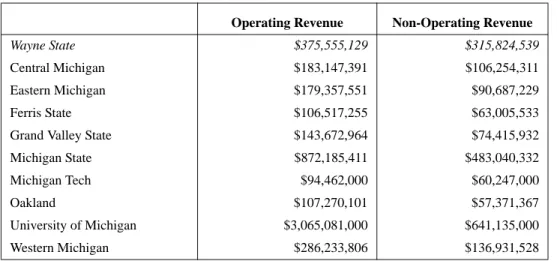
As shown in Table 7, “Operating v. Non-Operating Revenues, 2002-2003,” on page 18 Wayne State is unique in that its non-operating revenue nearly matches its operating revenue. Most universities’ non-operating revenue is only 25-60% of its operating revenue, but Wayne State’s non-operating revenue is 85% of its operating revenue.
The high percentage is due to Wayne State’s high reliance on state appropria-tions. Wayne State ranks third in state appropriations with $245,520,223 in 2002-2003, behind Michigan State ($380,802,125) and the University of Michi-gan ($350,838,000). Although Wayne State’s total revenue is only about 18% of the University of Michigan’s, it collects approximately 70% of the state appro-priations that U of M does.
Table 8, “Major Revenue Sources: 2002-2003,” on page 18 compares revenue from tuition and fees, grants and contracts, and state appropriations for each university. For 2002-2003 grants and contracts revenue, Wayne State,
$237,754,191, is a close third to Michigan State’s $283,894,590. However, both trail the University of Michigan by a wide margin.
TABLE 6. Revenue and Expenditure, 2002-2003
Total Revenue Total Expenditure
Wayne State $709,110,987 $681,672,014
Central Michigan $320,689,666 $288,233,235
Eastern Michigan $272,324,868 $270,421,888
Ferris State $179,189,866 $175,681,948
Grand Valley State $249,233,551 $213,252,626
Michigan State $1,376,250,371 $1,299,315,408
Michigan Tech $158,443,000 $159,870,000
Oakland $169,313,508 $165,039,320
University of Michigan $3,834,285,000 $3,585,974,000
Western Michigan $463,651,437 $421,860,485
TABLE 7. Operating v. Non-Operating Revenues, 2002-2003
Operating Revenue Non-Operating Revenue
Wayne State $375,555,129 $315,824,539
Central Michigan $183,147,391 $106,254,311
Eastern Michigan $179,357,551 $90,687,229
Ferris State $106,517,255 $63,005,533
Grand Valley State $143,672,964 $74,415,932
Michigan State $872,185,411 $483,040,332
Michigan Tech $94,462,000 $60,247,000
Oakland $107,270,101 $57,371,367
University of Michigan $3,065,081,000 $641,135,000
Western Michigan $286,233,806 $136,931,528
Source: NCES: IPEDS, Finance 2004
TABLE 8. Major Revenue Sources: 2002-2003
Tuition and Fees
Grants and Contracts State Appropriations Wayne State $108,076,670 $237,754,191 $245,520,223 Central Michigan $112,013,948 $15,035,979 $86,853,527 Eastern Michigan $105,709,841 $12,544,464 $84,993,686 Ferris State $56,720,120 $14,182,166 $53,577,031
Grand Valley State $90,780,281 $13,937,645 $57,992,024
Michigan State $280,395,364 $283,894,590 $380,802,125
Michigan Tech $41,055,000 $28,645,000 $53,308,000
Oakland $65,412,200 $15,214,825 $50,551,147
University of Michigan $496,562,000 $747,043,000 $350,838,000
Western Michigan $134,691,763 $36,602,536 $121,278,313
Comparative Analysis
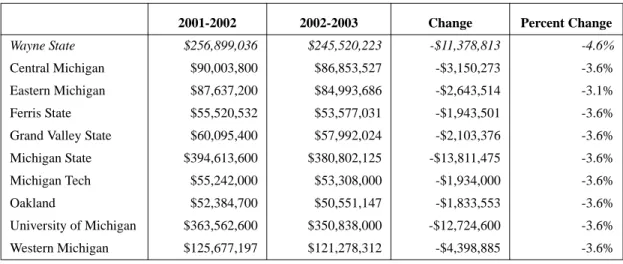
STATE
APPROPRIATION
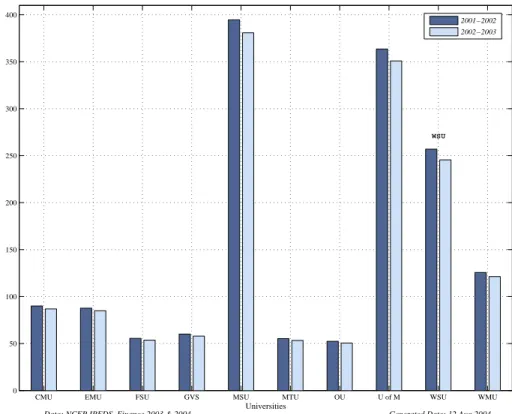
WSU’s heavy dependence on state appropriations makes it especially vulnera-ble to decreases in state appropriations. As seen in Tavulnera-ble 9, “Change in State Appropriations,” on page 19 universities’ state appropriations are declining. Wayne State was among the hardest hit, losing 4.6% from 2001-2002 to 2002-2003. Michigan State and the University of Michigan both lost 3.6%. For graph-ical illustration, see Figure 3, “State Appropriations, 2001-2002 v. 2002-2003,” on page 20.
TABLE 9. Change in State Appropriations
2001-2002 2002-2003 Change Percent Change
Wayne State $256,899,036 $245,520,223 -$11,378,813 -4.6%
Central Michigan $90,003,800 $86,853,527 -$3,150,273 -3.6%
Eastern Michigan $87,637,200 $84,993,686 -$2,643,514 -3.1%
Ferris State $55,520,532 $53,577,031 -$1,943,501 -3.6%
Grand Valley State $60,095,400 $57,992,024 -$2,103,376 -3.6%
Michigan State $394,613,600 $380,802,125 -$13,811,475 -3.6%
Michigan Tech $55,242,000 $53,308,000 -$1,934,000 -3.6%
Oakland $52,384,700 $50,551,147 -$1,833,553 -3.6%
University of Michigan $363,562,600 $350,838,000 -$12,724,600 -3.6%
Western Michigan $125,677,197 $121,278,312 -$4,398,885 -3.6%
FIGURE 3. State Appropriations, 2001-2002 v. 2002-2003
CMU EMU FSU GVS MSU MTU OU U of M WSU WMU 0 50 100 150 200 250 300 350 400 in millions of USD Universities
Source & Analysis: Anderson Economic Group, www.AndersonEconomicGroup.com
Data: NCEP IPEDS, Finance 2003 & 2004 Generated Date: 12 Aug 2004
WSU
2001−2002 2002−2003
Socio-Economic and Demographic Analysis
IV.Socio-Economic and Demographic Analysis
In order to fully understand Wayne State University’s economic and social con-tribution to the State and local economies, we must first understand its market area, which is defined to include the counties of Wayne, Macomb, Oakland, Monroe, Washtenaw, Livingston, and St. Clair. See Map 1, “Universities & Community Colleges in the Region,” in Appendix A, for the area overview. 89% of graduate students and 94% of undergraduate students at WSU live in the seven-county region. Additionally, 93% of professors/researchers and 98% of non-academic employees of WSU live in the seven-county region. For a geo-graphic illustration of this data see Map 7, “Residential Location of WSU Employees,” in Appendix A and Map 5, “Graduate & Undergraduate Students,” in Appendix A.
POPULATION & NUMBER OF HOUSEHOLDS
Given that Wayne State draws a large number of its students from the greater Detroit area, it stands to reason that the more people in the area, the greater the potential student pool. As evidenced by Table 10, “Population,” on page 21, the overall population of the seven-county area is rising. All of the counties, with the exception of Wayne County, experienced positive changes in population from 2000-2003. This trend is expected to continue from 2003-2008. For geo-graphic illustration of population growth rates between 2003 and 2008, see Map 2, “Projected Population Growth and Campus Locations,” in Appendix A.
TABLE 10. Population
Population Annual Change in Population
2000 2003 2008 2000-2003 2003-2008 Livingston 156,912 174,112 200,556 3.5% 2.9% Macomb 786,968 816,336 861,442 1.2% 1.1% Monroe 144,939 149,663 156,914 1.1% 1.0% Oakland 1,193,902 1,206,266 1,225,190 0.3% 0.3% St. Clair 163,235 168,216 175,868 1.0% 0.9% Washtenaw 322,835 339,377 364,792 1.7% 1.5% Wayne 2,060,851 2,038,326 2,003,987 -0.4% -0.3% Seven-County Area 4,829,642 4,892,297 4,988,749 0.4% 0.4%
The number of households is also important in determining the future potential student pool as it is households that will be providing the necessary money for tuition, books, and other expenses. As seen in Table 11, “Households,” on page 22, the number of households correlates strongly to the population. As in the population table, the number of households for the seven-county area has increased, and will continue to do so. Again, the exception to the rule is Wayne County, which experienced a 0.2% annual loss of households from 2000-2003, and is expected to continue to lose households at that rate from 2003-2008.
INCOME FIGURES A strong positive relationship between income and level of education exists. So, if the incomes of people and families in the market area are increasing, then more people can be expected to go to college. Table 12, “Income,” on page 23 shows the income trend in the seven-county area. All counties experienced an annual growth in income, both per capita and median household income, from 2000-2003. Wayne and Oakland Counties were the only ones under a 3% increase for per capita income, posting gains of 2.8% and 2.9%, respectively. For median household income, Washtenaw and Monroe Counties were at the low end, each posting only a 2.0% annual increase from 2000-2003. In fact, only Livingston County was over the 2.3% seven-county average, posting a notable 2.7% annual increase. For geographic illustration of median household income, see Map 3, “Median Household Income, 2003,” in Appendix A.
TABLE 11. Households
Number of Households (HH) Annual Change in Number of HHs
2000 2003 2008 2000-2003 2003-2008 Livingston 55,371 62,443 73,698 4.1% 3.4% Macomb 308,690 326,926 356,071 1.9% 1.7% Monroe 53,409 56,193 60,623 1.7% 1.5% Oakland 471,017 482,344 500,026 0.8% 0.7% St. Clair 61,633 64,389 68,728 1.5% 1.3% Washtenaw 125,305 133,791 147,162 2.2% 1.9% Wayne 768,325 762,595 753,600 -0.2% -0.2% Seven-County Area 1,843,750 1,888,681 1,959,908 0.8% 0.7%
Socio-Economic and Demographic Analysis
LABOR MARKET Equally important to the level of income for the region is the number of people actually earning an income. Table 13, “Employment,” on page 24 shows that in every county, except for Livingston, there was a decrease in the number of employed from 2000-2003. Overall, the seven-county region lost nearly 200,000 employed persons from 2000-2003. It is important to note that these were recession years for the entire country.
Also see Figure 4, “Annual Unemployment Rates, 1994-2004,” on page 24, which shows the volatility of the labor market in the seven-county area.
TABLE 12. Income
Per Capita Income Median Household (HH) Income
2000 2003 Annualized Change 2000-2003 Projected 2008 2000 2003 Annualized Change 2000-2003 Projected 2008 Livingston $27,965 $30,960 3.4% $36,443 $68,282 $73,871 2.7% $85,600 Macomb $24,254 $26,638 3.2% $31,136 $52,784 $56,134 2.1% $63,804 Monroe $22,235 $24,427 3.2% $28,201 $52,192 $55,468 2.0% $62,517 Oakland $32,321 $35,266 2.9% $40,808 $62,438 $66,451 2.1% $75,720 St. Clair $21,218 $23,427 3.4% $26,527 $46,416 $49,610 2.2% $55,468 Washtenaw $26,601 $29,416 3.4% $33,901 $52,549 $55,798 2.0% $63,057 Wayne $19,816 $21,513 2.8% $24,037 $40,888 $43,614 2.2% $48,774 Seven-County Area $24,468 $26,799 3.1% $30,820 $49,970 $53,478 2.3% $59,622
FIGURE 4. Annual Unemployment Rates, 1994-2004
TABLE 13. Employment
Total Number of Employed Unemployment Rate
1994 1997 2000 2003 1994 1997 2000 2003 Livingston 66,895 73,399 81,719 83,032 3.9% 2.7% 1.9% 4.2% Macomb 384,353 410,638 440,954 411,852 5.6% 3.5% 3.1% 6.6% Monroe 64,090 68,511 75,062 69,858 5.5% 3.8% 3.1% 7.3% Oakland 600,280 636,232 691,985 635,348 4.4% 2.8% 2.2% 5.2% St. Clair 68,992 73,445 81,661 75,950 7.3% 5.1% 4.1% 9.2% Washtenaw 158,518 164,005 177,004 174,033 3.1% 2.1% 1.6% 3.2% Wayne 872,233 899,300 925,398 839,721 6.7% 4.7% 3.9% 9.0% Seven-County Area 2,215,361 2,325,530 2,473,783 2,289,794 5.5% 3.7% 3.0% 6.9% Analysis: Anderson Economic Group; Data Source: BLS
1 2 3 4 5 6 7 8 9 10
Annual unemployment rate (%)
Livingston Macomb Monroe Oakland St Clair Washtenaw Wayne
Socio-Economic and Demographic Analysis
HOUSEHOLD EXPENDITURE ANALYSIS
Table 14, “Household Expenditures,” on page 25 details how much income households have, and what they are spending it on. Livingston County and Oak-land County had the highest average household incomes in 2003, with $86,037 and $87,623 respectively. Wayne County ranked the lowest with only $56,850. Not surprisingly, Livingston and Oakland Counties had the highest expenditures for every single category, and Wayne County was last in every category.
Notice that there is complete correlation between average household income and average education expenditure. This means that the more money a house-hold has, the more it will spend on education.
Note on Data Precision. This analysis is based on survey data from the US Cen-sus and the Bureau of Labor Statistics, as well as supplemental data and analysis from private demographers and geographers. It is not based on a “cost of living” analysis, or on specific tax rates applied to example properties. Therefore, we use these data to compare counties within the state, rather than to judge the actual costs or expenditures of specific families.
Education expenditure also shows how much money is being spent in the mar-ket area on education right now. This can help determine how much of a poten-tial revenue base there is in the market, not just for Wayne State University, but for education in general.
For geographic illustration, see Map 4, “Average Household Tuition Expendi-tures, 2003,” in Appendix A.
TABLE 14. Household Expenditures
Livingston Macomb Monroe Oakland St. Clair Washtenaw Wayne
Seven-County Area Average Household Income $86,037 $66,051 $64,421 $87,623 $60,316 $73,165 $56,850 $68,766 Total Expenditure $62,470 $51,794 $51,027 $62,363 $48,730 $55,219 $46,469 $52,811 Education $1,052.43 $888.93 $872.46 $1,065.74 $835.65 $953.30 $811.69 $910.56 Books and Supplies $167.87 $141.06 $138.64 $169.50 $132.60 $150.73 $127.80 $144.18
Tuition $884.56 $747.88 $733.81 $896.25 $703.05 $802.57 $683.89 $766.38
Reading $330.31 $276.18 $271.18 $332.35 $259.44 $295.41 $248.64 $281.84
Newspaper $147.12 $122.90 $120.72 $147.62 $115.57 $131.37 $110.77 $125.40
Magazines $69.56 $58.41 $57.31 $70.30 $54.83 $62.45 $52.45 $59.54
Books $113.64 $94.87 $93.14 $114.43 $89.04 $101.59 $85.42 $96.90
Another important factor in determining the nature of an area is reading expen-ditures. Notice that there is a strong positive correlation between income and reading expenditure, and also between education expenditure and reading expenditure.
Expenditure and Income Analysis
V. Expenditure and Income Analysis
As a major University, Wayne State provides more than educational and research benefits. The University is also a large employer, visitor destination, and residential location for students. As such, it provides direct expenditures and income that produce measurable economic impacts, which we quantify here.
DEFINITION OF
“IMPACT” Our firm has rigorously completed, or critiqued, numerous economic impact analyses. We depart from many other practitioners by insisting on a specific, conservative, and realistic definition of “economic impact.” We define eco-nomic impact as only bona fide, new economic activity directly or indirectly caused by the subject. In calculating the effects, we take into account both costs and benefits. In particular, we subtract from the total net benefit figure any reductions in economic activity due to displacement or substitution effects. Activity that merely replaces or displaces other activity—such as students attending WSU instead of another area college or University—are subtracted out.
The resulting findings are much more conservative, and realistic, than many reported analyses that fail to subtract costs, ignore substitution effects, or exag-gerate benefits. Throughout this report, we provide only the net benefit figures. These are not comparable to the gross expenditure totals often touted in “eco-nomic impact” studies.1
We define “fiscal impact” similarly, by including only bona fide, new, tax reve-nue or reduced government expenditures. To arrive at our total net fiscal impact figure, we subtract out any lost tax revenue or increased expenditures. For a summary of WSU’s fiscal impacts, see “Fiscal Impact Assessment” on page 43. ECONOMIC IMPACTS To evaluate how WSU expenditures and related income translate into economic
impacts, we:
1. Determined annual expenditures (and resulting income to area businesses and residents) in the 7-county area surrounding WSU that stem directly from the University.
2. Accounted for the likely substitution of other economic activity for Wayne State’s operations, should the University cease operations. These “substitu-tion” effects were then subtracted from direct expenditures to arrive at a net direct economic impact figure.2
1. For a detailed examination of the sources of exaggeration in common “economic impact” stud-ies, see Patrick L. Anderson, Business Economics and Finance, CRC Press, 2004, chapter 4.
3. Used specific multipliers to calculate the net indirect economic impact of the University from the net direct impact.
4. Summed the net direct and indirect impacts to arrive at an overall economic impact.
Determining Annual Expenditures and Income
Our analysis of the expenditures and income that stem from the University relies on information from WSU’s 2003 consolidated financial statements, WSU personnel and employment data, student expenditure data, and University visitor information. With these data, we:
1. Measured the University’s direct, non-payroll expenditures subdivided into two categories: teaching & operations, and research.
2. Estimated the annual expenditures of WSU students and employees in the area.
3. Estimated total annual WSU visitor spending, including spending by those coming to campus for cultural activities, sporting events, commencements, and to visit students.
Note that we did not add tuition and fees, or state appropriates to the WSU expenditures, as this would double-count the resulting expenditures. Table
B-17, “Input Data: Expenditures and Income,” on page B 2 in the Appendix con-tains the details on expenditure and income data used in our analysis.
Accounting for Substitution Effects
The income and expenditure analysis provides an estimate of the total economic activity stemming from Wayne State. However, a portion of this economic activity would still occur even if Wayne State University were not a part of the economy. For example, the absence of WSU would not mean all of WSU’s employees stop working. Certainly some would find similar employment in the area, while others would have to move outside of the area to find employment. Those who would work in the area regardless of WSU’s existence are part of the substitution effect.
Table 15, “Substitution Effect Parameters,” on page 29 shows the share of WSU’s direct operations that would likely be substituted by other operations, should WSU cease operations. Each variable listed describes the amount of expenditures assumed to continue within the regional economy without Wayne State University. For example, we assume that if WSU were not in the regional economy, other economic activity would occur that equals 25% of WSU’s total expenditures for teaching and operations (non-payroll).The failure to include
Expenditure and Income Analysis
substitution effects is one of the most common sources of exaggeration in naive “economic impact” studies.
Direct and Indirect Economic Impact.
The additional income that results from the direct expenditures of Wayne State, less substituted economic activity, are what we refer to as the net direct eco-nomic impact. Note that we do not include all related expenditures as part of the net “economic impact” of the organization. As discussed above, including all related expenditures—such as including all expenditures of a university— would exaggerate its actual net benefits. This exaggeration would occur prima-rily because some expenditures would have occurred even without the univer-sity. In particular, the economic activity in the area surrounding the university would be sharply reduced if the university was to stop operating. However, it would not go to zero.
Indirect Impact. The direct impact includes the net economic benefits caused by the expenditures of the University. A portion of these expenditures are then re-spent in the same region. These benefits are referred to as indirect economic impact, and include income provided and expenditures made by businesses that are dependent on the University, such as equipment suppliers, local restaurants, and auto dealers who sell to University employees. Typically, indirect benefits are equal to or smaller than direct benefits, especially in a small area, or where substitute goods and services are easily found.
Note on Impact Multipliers. To account for indirect effects, we use a different set of “multipliers” for different categories of expenditures, and for different areas. For example, we use a multiplier of 1.6 for teaching and operation expenditures, but a 2.0 multiplier for student expenditures in the region. This difference origi-nates in the fact that typical student expenditures are on consumables and ser-vices that are largely sourced within the region, while teaching and operations expenditures are often supported by purchases outside the region. Note that all multipliers are smaller for the 3-county primary market area than for the 7-county region. Section E of Table B- 17, “Input Data: Expenditures and Income,” on page B 2 contains the economic impact multipliers used in our analysis.
TABLE 15. Substitution Effect Parameters
7-County Area Tri-County Area Teaching and Operations Expenditures (non-payroll) 25% 20%
Research (non-payroll) 10% 5%
Students 45% 30%
Professors, Researchers & Non-Academic Employees 30% 25%
Visitors 40% 35%
Summary of Economic Impacts. As shown in Table 16, “WSU Net Economic Impact by Region,” on page 30, the University has a net economic impact of more than $1 billion on the 7-County Region, and a net economic impact of about $910 million in the Tri-County Region.
See Table B- 18, “Direct and Indirect Economic Impact Analysis,” on page B 4 for further details from our economic impact analysis.
TABLE 16. WSU Net Economic Impact by Region
7-County Region Tri-County Region Direct Economic Impact
(Net of substitution effects)
$589,421,145 $535,142,143
Indirect Economic Impact $486,996,982 $375,270,179
Total Net Economic Impact $1,076,418,127 $910,412,322
Cultural and Knowledge Endowments
VI.Cultural and Knowledge Endowments
Beyond the economic and fiscal impacts measured above, Wayne State Univer-sity provides economic contributions in a number of other areas that, because of their far reach and immeasurable impacts, are more difficult to assess quantita-tively. These impacts, which we provide a qualitative assessment of below, include:
1. The creation of knowledge, which becomes a public good for all to utilize and
bene-fit from.
2. The transfer of new technology from the academic world to the marketplace.
3. Quality of Life Improvements for the entire WSU community, including those living
and working near the campus.
4. Investment in the re-development of Detroit’s Midtown neighborhood.
KNOWLEDGE
CREATION While we do not quantify the economic value of these impacts, they are an important benefit that WSU provides the community. Since our impact calcula-tions do not include these, it is highly likely that results are on the conservative side.
The environment at Wayne State is one that encourages thought and the creation of new knowledge. Much of this knowledge is presented in lectures, articles, or other forums, making it a valuable public good.
Public goods are non-exclusive and non-rival; non-rival meaning that one per-son's consumption does not take away or negatively impact another's ability to consume the good (knowledge), and non-exclusive meaning that once the good is made public, it is available for anyone to use. The problem with public goods, that of free-riders, arises from their non-exclusivity. With the costs involved in the development of new ideas being so significant, for-profit firms lack the incentive to invest in the work needed to generate them.
Universities such as Wayne State help fill this void by providing an environment conducive to the development of new ideas. At Wayne State, this often occurs through teaching and research in all fields, and especially in medicine and engi-neering. Researchers at Wayne State are constantly publishing, presenting, and working collaboratively with other researchers. Also, Wayne State works closely with a number of private sector businesses, furthering the sharing of ideas that leads to the creation of new knowledge.
TECHNOLOGY
TRANSFER In addition to generating new knowledge, WSU researchers often fully develop ideas, resulting in the patent of a new technology. In 2002 WSU had research expenditures of nearly $199 million. Such research expenditures result in new technologies, many of which the University makes available for licensing.
These technologies include medical devices, diagnostics, therapeutics, drug dis-coveries, research tools, and physical science/engineering.
Recent examples of Wayne State technologies available for license include: •a method to remove arsenic from drinking water
•a magnetic resonance force microscopy for the study of biological systems
•neoepitope detection of cancer using protein arrays
•compounds with anti-tumor and anti-parasitic activity
Currently, there are approximately eighty such technologies available for license. Because the University desires the most efficient and effective transfer of new technology to the marketplace possible, the Technology Transfer Office exists. The TTO is responsible for the “identification, protection, marketing and licensing” of the new technologies.
Wayne State licenses technologies to companies all around the country, and even the world. While Wayne State prefers to license to local companies, it must find an appropriate market for the technology. However, an estimated 35-40% of licenses do go to companies in Michigan.
Wayne State also assists in the start-up of new companies. Such start-ups are based on Wayne State technology, and almost always see involvement of WSU researchers, either as employees or advisors. Currently, there are 14 Wayne State start-up companies, 10 of which are in Michigan. These 14 start-ups pro-vide high-skill, high-wage jobs for approximately 100 people.
An example of a successful WSU start-up is Lumigen, a high-tech company located in Southfield, Michigan, employing approximately 45 people. They pro-duce chemi-luminescent reagents for clinical diagnostic tests. The reagents react under certain conditions, providing valuable medical information to the doctor. Lumigen still works with Wayne State, and nearly half of its workforce is com-posed of Wayne State graduates.3
“Tech Town,” a 47-acre, multi-million dollar research and business technology park, continues to grow after its grand opening in April, 2004. The project’s goal is to attract mature and incubator-stage companies involved in life sci-ences, advanced engineering, advanced manufacturing industries, and informa-tion technology. Among current tenants is Asterand, a tissue bank that serves genomic researchers around the world. At capacity, approximately 60 compa-nies, and over 1,600 employees are expected to be located at TechTown. Expan-sion plans at the site call for a new technically oriented high school.
Cultural and Knowledge Endowments
QUALITY OF LIFE The WSU School of Medicine’s Mis-sion Statement explicitly states a desire to “deliver comprehensive primary care for the urban poor that is of the same quality as that available to the affluent.” To do this, the School pro-vides the Detroit metropolitan area with services, including free medical care for the homeless and unemployed at Detroit’s Cass Clinic. Annually, the School of Medicine, with the help of Detroit Medical Center, provides $150 million in uncompensated health care. A Senior Citizen Outreach Project, Adolescent Substance Abuse
Preven-tion Program and Teen Pregnancy EducaPreven-tion Program are also sponsored by students at Wayne State University. A number of other events are also spon-sored by the University to make the community better informed about health issues such as diabetes, obesity, and smoking related dangers.
The Wayne State University Law School also plays a large role in providing ser-vices to the community. The Free Legal Aid Clinic, Disability Law Clinic, Non-profit Corporations and Urban Development Law Clinic, Criminal Appellate Practice Clinic and the Civil Rights Litigation Clinic are all live-client clinics where law students provide valuable legal service to members of the community who might otherwise not be able to afford such assistance.
The University helps keep the community art, culture, and news savvy through its ownership and operation of WDET-FM 101.9, a National Public Radio affili-ate, as well as its many venues for art exhibitions, theatrical productions, and dance and musical performances. WSU also hosts the Detroit Festival of Arts, an annual celebration of visual and performing artists. Wayne State University’s ensemble in the Department of Music visits local area schools, exposing young students to art music, and WSU music students and alumni staff The Weekend School of Music, a 300 student program offering low-cost instrument classes to the public.
Guest library cards are also made available to the general public, providing access to an impressive collection of literature and research materials. The libraries also make computer and internet access available to the public. The David Adamany Undergraduate Library alone hosts 500 computer workstations, a number of which can be used by the public.
There are over 100 student organizations on the WSU campus. Many of these organizations make direct contributions to the metropolitan Detroit area. Project
Volunteer, an organization known for its community service efforts, organizes events such as Into the Streets, World AIDS Day, Martin Luther King Day, Hun-ger & Homelessness Week, and Alternative Spring Break. Other WSU student organizations host events that take up collections for the needy, distribute food to the homeless, and provide other valuable community services.
MIDTOWN DETROIT AND WAYNE STATE UNIVERSITY
For years, Wayne State has actively pursued the re-development of Midtown Detroit. The University has spent millions of dollars on abandoned buildings and unused lots to attract new businesses to the campus area. In 2002, Barnes & Noble opened a store on campus, and a Starbucks opened in 2004. These stores are open to all and are located on major thoroughfares.
The University has worked to develop or renovate property all around the campus. Wayne State has spent more than $200 mil-lion buying property in the past four years. This property is then used to construct new buildings, renovate old ones, or given to outside developers for their own projects.
The University’s development plan is both altruistic and practi-cal. The previously run-down areas surrounding the school
have been improved through development. They are no longer as decrepit or as dangerous as they once were. Due to the improvements, the University can attract more students and businesses, enhancing the appeal of the overall com-munity. The developments also help to increase the property values in the area, creating a larger tax base for City and State.