Execution Synthesis: A Technique
for Automated Software Debugging
Cristian Zamfir and George Candea
School of Computer and Communication Sciences École Polytechnique Fédérale de Lausanne (EPFL), SwitzerlandAbstract
Debugging real systems is hard, requires deep knowledge of the code, and is time-consuming. Bug reports rarely provide sufficient information, thus forcing developers to turn into detectives searching for an explanation of how the program could have arrived at the reported failure point.
Execution synthesis is a technique for automating this de-tective work: given a program and a bug report, it automat-ically produces an execution of the program that leads to the reported bug symptoms. Using a combination of static analysis and symbolic execution, it “synthesizes” a thread schedule and various required program inputs that cause the bug to manifest. The synthesized execution can be played back deterministically in a regular debugger, like gdb. This is particularly useful in debugging concurrency bugs.
Our technique requires no runtime tracing or program modifications, thus incurring no runtime overhead and being practical for use in production systems. We evaluateESD— a debugger based on execution synthesis—on popular soft-ware (e.g., the SQLite database, ghttpd Web server, HawkNL network library,UNIXutilities): starting from mere bug re-ports,ESDreproduces on its own several real concurrency and memory safety bugs in less than three minutes.
Categories and Subject Descriptors D.2.2.5 [Software En-gineering]: Testing and Debugging—Debugging aids
General Terms Reliability
Keywords automated debugging, symbolic execution
1.
Introduction
Developing software is a challenging endeavor, and debug-ging it is even harder. With increasing parallelism in both
Permission to make digital or hard copies of all or part of this work for personal or classroom use is granted without fee provided that copies are not made or distributed for profit or commercial advantage and that copies bear this notice and the full citation on the first page. To copy otherwise, to republish, to post on servers or to redistribute to lists, requires prior specific permission and/or a fee.
EuroSys’10, April 13–16, 2010, Paris, France.
Copyright © 2010 ACM 978-1-60558-577-2/10/04. . . $10.00
hardware and software, the classic problem of bugs in se-quential execution is now being compounded by concur-rency bugs and other hard-to-reproduce behavior.
To fix a bug, developers traditionally try to reproduce it and observe its manifestation in a debugger. Alas, this approach is often challenging, especially for concurrency bugs—in a recent survey, almost 75% of respondents con-sidered reproducibility to be hard or very hard [17]. There are multiple reasons for this: First, complex sequences of low-probability events (e.g., a particular thread schedule) are required for a concurrency bug to manifest, and program-mers do not have the means of directly controlling such events. Second, the probe effect—unintended alteration of program behavior through the introduction of instrumen-tation and breakpoints [15]—can make concurrency bugs “vanish” when hunted with a debugger. Third, variations in the OS and runtime environment (e.g., kernel or library ver-sion differences) may make it practically impossible to re-produce a bug exactly as it occurred at the end user’s site.
Modern software is increasingly parallel, which makes it that much more difficult to debug. Currently, more than 70% of concurrency bugs take many days or even months to an-alyze and diagnose [17]. This increases the cost of main-taining and evolving parallel software, and consumers must wait a long time before fixes become available. Moreover, the large amount of guesswork involved in debugging leads to error-prone patches, with many concurrency bug fixes ei-ther introducing new bugs or, instead of fixing the underlying bug, merely decreasing its probability of occurrence [27]. In-creasingly parallel hardware causes software to experience increasingly concurrent executions, making latent bugs more likely to manifest, yet no easier to fix.
In this paper, we introduce execution synthesis, a tech-nique for automatically finding “explanations” for hard-to-reproduce bugs. Execution synthesis takes as input a gram plus a bug report and produces an execution of that pro-gram that causes the reported bug to manifest deterministi-cally. Our technique requires no tracing or execution record-ing at the end user’s site, makrecord-ing it well suited for de-bugging long-running, performance-sensitive software, like
Web servers, database systems, e-mail servers, application servers, game servers, etc.
Successful debugging with execution synthesis is premised on the observation that, in order to diagnose a given bug, a developer rarely needs to replay the exact sameexecution that evidenced the bug at the user’s site. Instead, playing backanyfeasible execution that exhibits that same bug will typically be sufficient. The execution produced by execution synthesis provides an explanation of the bug, even if it is not precisely the execution experienced by the user report-ing the bug. A synthesized execution provides the causality chain leading to the bug, thus eliminating the guessing and lengthy detective work involved in debugging. In addition to a bug report, developers now also have an execution they can play back in their debugger. This allows them to deter-ministically observe the buggy behavior and to use classic techniques for finding a suitable bug fix, such as step-by-step execution and data structure dumps.
Execution synthesis consists of two parts. Sequential path synthesis combines symbolic execution with context-sensitive inter- and intra-procedural static analysis to effi-ciently produce a guaranteed-feasible sequential execution path from the start of the program to any target basic block in each program thread.Thread schedule synthesis finds a schedule for interleaving thread-level sequential paths such that the program’s execution exhibits the reported bug.
We prototyped the proposed technique in ESD, a tool that automatically analyzes common elements provided in bug reports (coredumps, stack traces, etc.), synthesizes an execution that leads to the reported misbehavior, and allows developers to play back this execution in a debugger.ESDis practical and scales to real systems. For example, it takes less than three minutes to synthesize an execution for a deadlock bug in SQLite, an embedded database engine with over 100 thousand lines of C/C++ code [32] used in Firefox, Skype, Mac OS X, Symbian OS, and other popular software [36].
In this paper, we give an overview of ESD (§2), de-scribe sequential path synthesis (§3), thread schedule syn-thesis (§4), and execution playback (§5). We then present the ESDimplementation (§6), an experimental evaluation (§7), discussion (§8), related work (§9), and conclusion (§10).
2.
Overview
The input toESDconsists of the coredump associated with a bug report and the program the developer is trying to debug. ESDthen outputs a trace that can be played back in a de-bugger with theESDruntime environment. Given a class of bugs,ESDcan extract from the coredump all information it needs to find a way to reproduce that class of bugs (e.g., for debugging deadlocks, it extracts the call stacks of the dead-locked threads). At the end user site, the buggy program is run normally, i.e., without instrumentation or special envi-ronments, no annotations, and no debug symbols.
... idx=0; 1: if (getchar() == ’m’) 2: idx++; 3: if (getenv("mode")[0] == ’Y’) 4: mode=MOD_Y; 5: else 6: mode=MOD_Z; ... 7: CriticalSection() { 8: lock(M1); 9: lock(M2); ...
10: if (mode==MOD_Y && idx==1) {
11: unlock(M1); ...
12: lock(M1);
} ...
Listing 1: Example of a deadlock bug. Two threads executing this code may deadlock if the condition on line 10 is true and one thread is preempted right after executing statement 11.
Execution synthesis shifts the burden of bug reproduction from the user side to the developer side, thus avoiding the performance and storage overhead of runtime tracing. This overhead can be substantial: a long-running server that han-dles many requests and fails after several weeks of execution can incur high cumulative recording overhead.
This design choice means that ESDmust reproduce the behavior of a bug without knowledge of some crucial run-time information, such as the inputs to the program or the schedule of its threads. To remove a bug, one need not see the exact same execution that caused the bug to manifest at the end user, but merely some execution that triggers the bug. For this slightly more modest goal, runtime information is not strictly necessary—it can all be inferred with a combina-tion of program analysis and symbolic execucombina-tion.
Besides automating the laborious parts of debugging, ex-ecution synthesis may even generate a path to the bug that is shorter than (but still equivalent to) the one that occurred at the user’s site, thus further saving debugging time.
We use the example in Listing 1 to illustrate how execu-tion synthesis works. In this example, two threads executing CriticalSection()concurrently may deadlock if the condition on line 10 is true. An execution in which the threads dead-lock is the following: one thread runs up to line 11 and is preempted right after the unlock call, then a second thread executes up to line 9 and blocks waiting for mutexM2, then the first thread resumes execution and blocks waiting forM1 on line 12. The program is now deadlocked.
The bug report for this deadlock would likely contain the final stack trace of each thread, but would be missing sev-eral important pieces of information needed for debugging, such as the return values of external calls—getchar() and getenv()—and the interleaving of threads.ESD“fills in the
blanks” and infers two key aspects of the buggy execution: a program path in each thread from the beginning to where the bug occurs, and a schedule that makes this path feasible. To synthesize the path through the program for each thread, ESDfirst statically analyzes the program and then performs a dynamic symbolic analysis. In the static analysis phase,ESDcomputes the control flow graph (CFG) and per-forms intra- and inter-procedural data flow analysis to iden-tify the set of paths through the graph that reach the bug loca-tion. For the example in Listing 1,ESD’s static analysis iden-tifies two paths that could lead the first thread to statement 12: 1→2→3→4→7→...→12 and 1→3→4→7→...→12, both of which requiregetenv("mode")to return a string start-ing with ‘Y’. Since ESDcannot decide statically whether statement 2 is part of the path to statement 12 or not, both alternatives are considered possible. For the second thread, a similar analysis finds four possible paths to statement 9.
In the dynamic analysis phase, ESD symbolically exe-cutes [23] the program in search of a guaranteed-feasible path. The search space is restricted to the paths identified during the static analysis phase. In our example,ESD deter-mines that only path 1→2→3→4→7→...→12 can take the first thread to statement 12, since it is the only one that sets idxto value 1. This dynamic phase also identifies the need forgetchar()to return‘m’. For the second thread, all four paths appear feasible for the time being.
Symbolic execution suffers from the notorious “path ex-plosion” problem [3]. Execution synthesis therefore incorpo-rates a number of techniques to cope with the large number of paths that typically get explored during symbolic execu-tion. The foremost of these techniques is the use of a prox-imity heuristic to guide symbolic execution on those paths most likely to reach the bug.ESDuses theCFGto estimate the distance (in basic blocks) from any given node in the CFGto the bug location. Using this estimate, the exploration of paths is steered toward choices that have a shorter dis-tance to the bug, thus enablingESDto find a suitable path considerably faster than mere symbolic execution.
For multi-threaded programs, synthesizing the execution path for each thread is not enough—ESDmust also identify a thread interleaving that makes these paths possible.ESD does this thread schedule search within the dynamic analysis phase. To make it fast,ESDuses the stack traces from the bug report to attempt thread preemptions in strategic places— such as before calls to mutex lock operations—that have high probability of leading to the desired schedule. In our example,ESDidentifies the required preemption points after statement 11 (first thread) and statement 9 (second thread). It also propagates the constraints ongetchar()andgetenv() in the first thread to the path choice for the second thread.
The novelty of execution synthesis is its ability to recon-struct bug-bound executions without recording program in-puts or events that induce non-determinism in program exe-cution, and without requiring any alteration of the program
or its environment. This makesESDpractical for real soft-ware running in performance-critical environments.
3.
Sequential Path Synthesis
In this section we describe howESDfinds a sequential bug-bound execution path within each thread of a program: first it identifies a search goal (§3.1), then performs static analy-sis (§3.2), and finally a dynamic search (§3.3).
3.1 Determining the Goal
For each thread present in the bug report, we define thegoal as a tuple<B,C>containing the basic block B in which the bug-induced failure was detected, and the conditionCon program state that held true when the bug manifested.
ESDcan automatically extractBandCfrom a coredump for most types of crashes, hangs, and wrong-output failures. The extraction process depends on the type of the bug. For example, in the case of a segmentation fault,Bis determined by the instruction that triggered the access violation andC indicates the value of the corresponding pointer (e.g,NULL), extracted from the coredump. For a deadlock,B contains the lock statement the thread was blocked on at the time the program hung, andC captures the fact that there was a circular wait between the deadlocked threads. As a final example, for a race condition,Bis where the inconsistency was detected—not where the race itself occurred—such as a failed assert, andCis the observed inconsistency (e.g., a negation of the assert condition).
If the crash occurs inside an external library,Bcontains the call to the external library function andCindicates that the values of the arguments are the ones with which that library function was called when the crash occurred. The values of the arguments are extracted from the coredump and the call stack in the bug report.
3.2 Static Phase of Path Search
Once the goal<B,C> has been established, ESD does a static analysis pass to narrow down the search space of paths to the goal. This phase operates on the program’s control flow graph (CFG) and data flow graph (DFG). First, ESD identifies the critical edges in theCFG, i.e., those that must be present on the path to the goal. Then,ESDidentifies inter-mediate goals, i.e., basic blocks that, according to theDFG, must execute in order for the critical edges to be traversable. The intermediate goals are then passed to the dynamic anal-ysis phase, described in the next section.
ESDfirst computes the full inter-proceduralCFGof the program and applies all the optimizations that were applied to the program version that experienced the reported bug. It performs alias analysis and resolves as many function point-ers as possible, replacing them with the corresponding di-rect calls; this can substantially simplify theCFG.ESDcan handle the case when not all function pointers are resolved, though it may lose precision. In this case, subsequent analy-ses will still be sound and complete, but may take longer to
execute.ESDalso eliminates all basic blocks that cannot be reached from the start of the program (i.e., dead code) and all basic blocks from which there is no path toB.
Acritical edge is an edge that must be followed when searching for a path to the goal. Conditional branch instruc-tions generate two outgoing edges in theCFG, correspond-ing to the true and else branches, respectively. If, for a given branch instructionb, only one of the outgoing edges can be part of a path to the goal, then it is a critical edge. When branch instructionbis encountered during dynamic analy-sis,ESDwill ensure the critical edge is followed; otherwise, the search would miss the goal.
ESDidentifies the critical edges by starting from the goal block and working backward, in a manner similar to back-ward slicing [37]. Starting from B, the algorithm finds at each step a predecessor node in theCFG. For each such node, if only one of its outgoing edges can lead to B, then that edge is marked as critical. The current version ofESDcan only explore one predecessor for each node, so as soon as a block with multiple predecessors is found, the marking of critical edges stops andESDmoves to the next step. A more effective, but potentially slower, algorithm would explore all predecessors and identify multiple sets of critical edges.
Anintermediate goalis a basic block in theCFGthat is guaranteed to be present on the path to the goal blockB, i.e., it is a “must have.” The knowledge that certain instructions must be executed helps the dynamic analysis break down the search for a path to the final goal into smaller searches for sub-paths from one intermediate goal to the next.
To determine intermediate goals,ESDrelies on the criti-cal edges. For each criticriti-cal edge, the corresponding branch condition and its desired value (true or false) are retrieved. For each variablex,y, ...in the branch condition,ESDfinds the sets of instructions Dx,Dy, ... that are reaching defini-tions [1] of the variable. It then looks for combinadefini-tions of instructions fromDx,Dy, ...that would give the branch
con-dition the desired value, i.e., instructions for which there is a static guarantee that, if they were executed, the critical edge would be followed. When such a combination is found, the basic blocks that contain the reaching definitions in the com-bination are marked as intermediate goals. Should more than one combination exist, the corresponding sets of instructions are marked as disjunctive sets of intermediate goals.
While conditionCin goal<B,C>is not explicitly used in the above algorithms,ESDdoes useCin its analyses. To a first degree of approximation, basic blockBis replaced in the program with a statement of the formif (C) then BugStrikes, and the static analysis phase runs on the transformed pro-gram, withBugStrikesas the goal basic block. By finding a path along which the program executesBugStrikes,ESD will have found a path that executes blockBwhile condition C holds, i.e., a path that reaches the original goal<B,C>. Some conditions, however, cannot be readily expressed in this way. For example, a deadlock condition is a property
that spans the sequential execution paths of multiple threads. For such cases,ESDhas special-case handling to check con-ditionCduring the dynamic phase; this will be further de-scribed in §4.
3.3 Dynamic Phase of Path Search
The previous section showed how ESD statically derives intermediate goals, producing an over-approximation of the path from program start to goal<B,C>. We now describe howESDemploys symbolic execution [23] to narrow down this over-approximation into one feasible path to the goal.
To perform the dynamic analysis,ESDruns program P with symbolic inputs that are initially unconstrained, i.e., which can take on any value, unlike regular “concrete” in-puts. Correspondingly, program variables are assigned sym-bolic values. When the program encounters a branch that in-volves symbolic values—either program variables or inputs from the environment—program state is forked to produce two parallel executions, one following each outcome of the branch (we say that the symbolic branch results in two “exe-cution states”). Program variables are constrained in the two execution states so as to make the branch condition evaluate to true or false, respectively. If, due to existing constraints, one of the branches is not feasible, then no forking occurs.
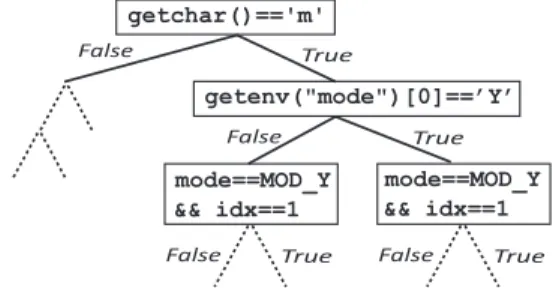
For example, the firstifstatement in Listing 1 depends on the return value ofgetchar().ESDtherefore forks off a sep-arate execution in whichgetchar()=‘m’. The current execu-tion continues with getchar()6=‘m’. Executions recursively split into sub-executions at each subsequent branch, creat-ing an execution tree like the one in Figure 1. Constraints on program state accumulate in each independent execution. Once an execution finishes, the conjunction of all constraints along the path to that terminal leaf node can be solved to produce a set of program inputs that exercises that particu-lar path. For example, the rightmost leaf execution (after the third fork) has constraintsmode=MOD_Yandidx=1 and the first character ofgetenv()’s return must be‘Y’and the return
ofgetchar()must be‘m’. Everything else is unconstrained in this particular execution.
getchar()=='m' getenv("mode")[0]==’Y’ True False False True mode==MOD_Y && idx==1 mode==MOD_Y && idx==1 True
False False True
Figure 1: Execution tree for the example in Listing 1. An execution state consists of a program counter, a stack, and an address space. Such states can be “executed,” i.e., the instruction pointed to by the program counter is executed and may cause corresponding updates to the state’s stack and
address space. We chose this representation for compatibility with the Klee symbolic execution engine [6], since theESD prototype relies on (a modified version of) Klee.
As new executions are forked, the corresponding execu-tion states are added to a priority queue. At every step of the symbolic execution, a state is chosen from the priority queue and one instruction is executed in that state, after which a new choice is made, and so on. In this way, the entire space of execution paths can be explored, and the symbolic exe-cution engine switches from one exeexe-cution to the other, de-pending on the ordering of the states in the queue. When the goal<B,C>is encountered in one of these executions,ESD knows it has found a feasible path from start to goal.
There are two key challenges, though: the execution tree grows very fast (the notorious path explosion prob-lem [3]), and determining the satisfiability of constraints at every branch condition, in order to determine which of the branches are feasible, is CPU-intensive. These two proper-ties make symbolic execution infeasible for large programs. ForESD to be practical, the search for a path to the goal must be very focused: the less of the tree is expanded and searched, the less CPU and memory are consumed.
ESDuses three key techniques to focus the search: First, it uses statically derived intermediate goals (§3.2) as anchor points in the search space, to divide a big search into sev-eral small searches. Second,ESDleverages the information about critical edges (§3.2) to promptly abandon during sym-bolic execution paths that are statically known to not lead to the goal. Third,ESDorders the priority queue of execu-tion states based on each state’s estimated proximity to the next intermediate goal. In this way, the search is consistently steered toward choosing and exploring executions that ap-pear to be more likely to reach the intermediate goal soon.
We refer to this latter technique as proximity-guided search and describe it in the next section. Due to space con-straints, we omit details on path elimination based on critical edges and on the evaluation of complex goal conditions.
3.4 Proximity-Guided Path Search
ESDuses guided forward symbolic execution to search for a path that reaches the goal extracted from the bug report. In doing so,ESDuses a proximity heuristic to estimate how long it would take each execution state to reach the goal, and it then executes the one that is closest.
The proximity of an execution state to a goal equals the least number of instructionsESDestimates would need to be executed in order to reach that goal from the current program counter in the execution state (line 1 in Algorithm 1). This bound aims to be as tight as possible and can be computed with low overhead.
When the goal is inside the currently executing proce-dure, functiondistancecomputes the proximity. If there are no calls to other procedures, the distance is the length of the path to the goal with the fewest number of instructions (lines 9-12). If, however, any of the instructions along the
Algorithm 1: Heuristic Proximity to Goal (Simplified) Input: Execution stateS, goalG(potentially intermediate) Output: Estimate ofS’s distance toG
dmin←distance(S.pc,G)
1
ifdmin=∞then 2
foreachprocedureπ∈S.callStackdo 3
Ira←instruction to be executed afterπcall returns 4
d← dist2ret(S.pc) +distance(Ira,G) +1 5
dmin←min(dmin,d)
6
returndmin
7
functiondistance( instructionI, instructionG) 8
dmin←∞ 9
ifI and G are in the same procedureπthen 10
foreachacyclic pathρinπ’s CFG from I to Gdo 11
d←number of instructions on pathρ 12
foreachcall to procedureγalong pathρdo 13
14 d←d+dist2ret(γ.startInstruction)
14
dmin←min(dmin,d)
15
returndmin
16
functiondist2ret( instructionI) 17
dmin←∞ 18
π←procedure to whichIbelongs 19
20 foreachreturn instruction R inπdo 20
dmin←min(dmin,distance(I,R) )
21
returndmin
22
path are calls to other procedures, thenESDfactors in the costs of executing those procedures by adding to the path length the cost of the calls (lines 13-14).
The cost of calling a procedure corresponds to the number of instructions along the shortest path from the procedure’s start instruction to the nearest return point. This is a special case of computing the distance of an arbitrary instruction to the nearest return (functiondist2ret, lines 17–22).
When the goal is not in the currently executing procedure, it may be reached via a procedure that is in a frame higher up in the call stack. In other words, the currently executing procedure may return, and the caller of the procedure may be able to reach the goal, or the caller’s caller may do so, etc. Thus,ESDcomputes a distance estimate for each function on the call stack of the current execution state (lines 3-4). It takes into account the instructions that have to be executed to return from the call plus the distance to the goal for the instruction that will be executed right after the call returns (line 5). The final distance to the goal is the minimum among the distances for each function on the call stack (line 6).
Each execution stateSinESDhasndistances associated with it, corresponding toS’s distance to theG1, ...,Gn−1 in-termediate goals inferred through static analysis and to the final goalGn=B. The closer an intermediate goal truly
is, the more accurate the distance estimate.ESDmaintains n“virtual” priority queuesQ1, ...,Qn, which provide an
or-dering of the state’s distance to the respective goal: the state at the front ofQihas the shortest estimated distance to goal Gi. We refer to these queues as “virtual” because the queue
elements are just pointers to the execution states. Each state can be found on each of the virtual queues.
At each step of the dynamic analysis,ESDpicks a stateS from the front of one of the queues. The choice of which queue to consult is uniformly random across the queues. The front state is dequeued, and the instruction at S.pc is symbolically executed, which updates the program counter, stack, and address space, and recomputes the distances from the newS.pc. The rationale of choosing states this way is to progressively advance states toward the nearest intermediate goal. Since the static analysis does not provide an ordering of the intermediate goals,ESDcannot choose which goal to try to reach first. It is possible, in principle, for the static phase to provide a partial order on the intermediate goals based on the inter-proceduralCFG.
Once a state has reached the final goal (i.e.,S.pc=B) the search completes: ESD has found a feasible path that explains the buggy behavior. ESD solves the constraints that accumulated along the path and computes all the inputs required for the program to execute that path, in a way similar to automated test generation [6, 18]. ESDrelies on symbolic models of the filesystem [6] and the network stack to ensure all symbolic I/O stays consistent.
Several programming constructs (such as recursion, sys-tem calls, and indirect calls) can pose challenges to the com-putation of a distance heuristic. We choose to increase the cost of a path that encounters recursion and system calls by a fixed amount—e.g., if a path leads to a recursive or multi-level recursive call, we assign a weight of 1000 instructions to that call. Indirect calls are resolved with alias analysis; if that is not possible, thenESDaverages the cost of the call instruction across all possible targets. The distance estimate is just a heuristic, so a wrong choice would merely make the path search take longer, but not affect correctness.
Another concern in heuristic-driven searches are local minima. Fortunately, they are a danger mainly for search processes that cannot backtrack; in path search, ESD can backtrack to execution states that are higher up in the exe-cution tree, thus avoiding getting stuck in local minima.
We found that the three techniques of focusing the search—proximity-based guidance, the use of intermediate goals, and path abandonment based on critical edges—can speed up the search by several orders of magnitude com-pared to other search strategies (§7).
Nevertheless, further techniques could be employed to improve the search strategy. For instance, if the initializa-tion phase of the program can be reproduced by other means, such as from an existing test case (ESDdoes not require ex-isting test cases),ESDcould run concretely the initialization
phase and automatically switch from concrete to symbolic execution later in the execution of the program [8, 19], thus reducing execution synthesis time.
4.
Thread Schedule Synthesis
In the case of multi-threaded programs,ESDmust also syn-thesize a schedule for interleaving the execution paths of the individual threads. It seeks a single-processor, sequential execution that consists of contiguous segments from the in-dividual threads’ paths. In other words,ESDsynthesizes a serialized execution of the multi-threaded program.
To do so,ESDemploys symbolic execution, but instead of only treating inputs and variables as symbolic, it also treats the underlying scheduler’s decisions as symbolic. It asso-ciates with each preemption point (i.e., each point where the scheduler could preempt a thread) a hypothetical branch instruction that is conditional on a single-bit predicate: if true, the currently running thread is preempted, otherwise not. These single-bit predicates1can be viewed as bits in the representation of a variable that represents the serial sched-ule.ESDtreats this variable as symbolic, and the question becomes: What value of this schedule variable would cause the corresponding execution to exhibit the reported bug?
Preemption points of interest are before and after concur-rency-sensitive operations: load instructions, store instruc-tions, and calls to synchronization primitives. While con-ceptually the sequential path synthesis phase is separate from schedule synthesis, ESD overlaps them and synthe-sizes one “global” sequential path, by exploring the possible thread preemptions as part of the sequential path synthesis.
Just as for sequential path synthesis,ESDemploys heuris-tics to make the search for a thread schedule efficient. It is substantially easier to choose the right heuristic if ESD knows the kind of concurrency bug it is trying to debug, and this can often be inferred from the coredump.ESDcan syn-thesize schedules for deadlocks (§4.1) and data races (§4.2).
4.1 Deadlocks
When looking for a path to a deadlock, the preemption points of interest are solely the calls to synchronization primitives, like mutexlockand unlock. In most programs, there are orders-of-magnitude fewer such calls than branches that de-pend (directly or indirectly) on symbolic inputs, so the mag-nitude of the deadlock schedule search problem can be sub-stantially smaller than that of sequential path search.
Moreover, information about the deadlocked threads’ fi-nal call stacks provides strong clues as to how threads must interleave in order to deadlock. ESDleverages these clues to bias the search toward interleavings that are more likely to lead to the reported deadlock.
For the deadlock example in Listing 1, a coredump would indicate call stacks that (in stylized form) would look like 1For programs with more than two threads, predicates have multiple bits,
T1:[...12]andT2:[...9], meaning that threadT1was blocked in alockcall made from line 12, whileT2was blocked in a
lockcall made from line 9. The call stack shows the call sequence that led to the lock request that blocked the thread. This lock request appears in the last frame, and we refer to it as the thread’sinner lock. We callouter locksthose that are already held by the deadlocked thread. This naming results from the fact that a deadlock typically arises from nested locks [27], where an inner lock is requested while holding an outer lock. At the time of deadlock, the acquisitions of the outer locks are not visible in the call stack anymore.
For the example bug, the search goal for each thread isT1:<12,T2@9>andT2:<9,T1@12>, meaning thatT1 blocks at line 12 whileT2blocks at line 9. ESDnow seeks an interleaved execution that leads to this goal, without any knowledge of where the outer locks were acquired.
Any timeESDencounters a lockorunlockoperation, it forks off an execution state in which the current thread is preempted. The running execution state maintains a pointer to that forked state, in caseESDneeds to return to it to ex-plore alternate schedules. More generally, we augment each execution stateSwith a mapKS:mutex→execution state.
An element<M,S′>∈KSindicates thatSis exploring one
schedule outcome connected with the acquisition of mu-tex M, while S′ is the starting point for exploring alter-native scheduling outcomes. A snapshot entry <M,S′> is deleted as soon asMis unlocked. The size ofKSis therefore
bounded by the program’s maximum depth of lock nesting. ESDleverages Klee’s copy-on-write mechanisms at the level of memory objects to maximize memory sharing between execution states (§6.1). As a result, snapshots are cheap.
We augment execution stateS withS.scheduleDistance, an estimate of how much context switching is required to reach the deadlock. For the case of two-thread deadlocks, this schedule distance can take one of two values: faror near.ESDcomputes a weighted average of the path distance estimate (§3.4) and the schedule distance estimate, with a heavy bias toward schedule distance. The virtual state pri-ority queues are kept sorted by this weighted average. The bias ensures that low-schedule-distance execution states are selected preferentially over low-path-distance states.
The general strategy for schedule synthesis is to help each thread “find” its outer lock as quickly as possible.
If a threadT1requests a mutexM that is free,ESDforks stateS′fromSand allows the mutex acquisition to proceed inS, while inS′threadT1is preempted before acquiringM. InS,ESDmust decide whether to letT1 continue running after having acquiredM, or to preempt it. If, by acquiring M,T1did not acquire its inner lock (i.e., theS.pcof the lock statement is different from that in the goal), thenESDletsT1 run unimpeded. However, ifT1just acquired its inner lock, thenESDpreempts it and marksS.scheduleDistance=near. This keeps M locked and creates the conditions for some other thread T2 to request M; when this happens, it is a
signal thatMcould beT2’s outer lock. The updated schedule distance ensures stateS is favored for execution over other states that have no indication of being close to the deadlock. If threadT1requests mutexM, andMis currently held by another threadT2,ESDmust decide whether to “roll back”T2 to makeMavailable toT1, or to letT1wait. IfMisT2’s inner lock, then it means thatM could beT1’s outer lock, soESD tries to makeM available, to giveT1a chance to acquire it:
ESDswitches to stateSk(from the<M,Sk>snapshot taken
just prior toT2acquiringM), which moves execution back to the state in whichT2got preempted prior to acquiringM.
ESDdoes this by setting, for each state inKS, the schedule
distance to near. It then sets the current state’s schedule distance tofar, to deprioritize it. This creates the conditions forT1to acquireM, its potential outer lock. WhenT2later resumes in a state in whichT2does not holdM, mutexMis likely to be held byT1and about to be requested byT2, thus increasing the chances of arriving at the desired deadlock.
Whenever a mutex M is unlocked, the snapshot corre-sponding toM is deleted, i.e.,KS←KS−<M,∗>. ESD deletes these snapshots because a mutex that is free (un-locked) cannot be among the mutexes that cause a deadlock. We illustrate on the example from Listing 1, for which the search goals areT1:<12,T2@9>andT2:<9,T1@12>.
ThreadT1needs to get to line 12. ESDtakesT1rather un-eventfully up to line 10, with snapshots having been saved prior to thelockoperations at line 8 and 9. OnceESD en-counters conditionmode=MOD_Y ∧ idx=1 on line 10, it must follow the true-branch, because it is a critical edge. This bringsT1 eventually to line 12. By this time, due to the unlock on line 11, there is only one snapshot left in
KS={<M2,S9>}, from the lock on line 9. At line 12, a
copy of the current state is forked and KS={<M2,S9>, <M1,S12>}.T1acquiresM1and thenT1is preempted.
T2 runs until it reaches line 8, where it blocks for M1 (held byT1). SinceM1was acquired asT1’s inner lock,ESD switches to stateS12, in whichT1is preempted immediately prior to acquiringM1. This allowsT2to run and acquireM1, but it blocks again on line 9 when trying to getM2 (held byT1).T1is scheduled back, and the program is now in the situation thatT1is holdingM2while waiting forM1at line 12, andT2is holdingM1while waiting forM2at line 9—the deadlock goal.ESDsaves the required inputs forgetchar() andgetenv()along with the synthesized schedule (i.e., the one in whichT1acquiresM1andM2, then releasesM1, then
T2gets to run until it acquiresM1and blocks onM2, after whichT1gets to run again and blocks onM1).
This algorithm generalizes in a relatively obvious way to more than two threads. OurESDprototype can synthesize thread schedules for deadlocks involving an arbitrary num-ber of threads, even when it is just a subset of a program’s threads that are involved in the deadlock.
During schedule synthesis, ESD automatically detects mutex deadlocks by using a deadlock detector based on a
re-source allocation graph [22]. Deadlocks involving condition variables are more challenging to detect automatically— inferring whether a thread that is waiting on a condition variable will eventually be signaled by another thread is un-decidable in general. However,ESDcan check for the case when no thread can make any progress and, if all threads are waiting either to be signaled, to acquire a mutex, or to be joined by another thread, thenESDidentifies the situation as a deadlock.
When searching for a schedule that reproduces a reported deadlock,ESDmay encounter deadlocks that do not match the reported bug. This meansESDhas discovered a different bug. It records the information on how to reproduce this deadlock, notifies the developer, rolls back to a previous snapshot, and resumes the search for the reported deadlock.
4.2 Data Races
To find paths to data races,ESDtakes an approach similar to the one for deadlocks: place preemptions at all the rel-evant places, then explore first those schedules most likely to reveal the data race. Snapshotting is used in much the same way, piggybacking on the copy-on-write mechanism for managing execution states. In addition to synchroniza-tion primitives,ESDalso introduces preemptions before in-structions flagged as potential data races.
ESDuses a dynamic data race detection algorithm similar to Eraser [34] and inserts preemption points wherever po-tentially harmful data races [30] are detected. Normally, dy-namic data race detectors can miss races, because they only observe execution paths exercised by the given workload. However, by using symbolic execution,ESDcan expose to the detection algorithm an arbitrary number of different ex-ecution paths, independently of workload.
In order to avoid unnecessary thread schedules early in the execution of the program,ESDuses an additional heuris-tic. It identifies the longest common prefix of the final thread call stacks in the coredump and inserts preemptions only in executions whose call stacks contain this prefix. If the last frame of the common prefix corresponds to procedure p, thenpis set as an intermediate goal for each thread—for the example in Listing 1,pwould be the entry into CriticalSec-tion. Once all threads reach their respective goals (or when no threads can make any further progress),ESD’s scheduler starts forking execution states on fine-grain scheduling de-cisions and checks for data races. We found this heuristic to work well in practice, especially considering that many applications run the same code in most of their threads.
For simplicity and clarity, we assume a sequential consis-tency model for memory shared among threads, an assump-tion present in most recent systems dealing with concurrency bugs (such as Chess [29]). An immediate consequence is that each machine instruction is assumed to execute atom-ically with respect to memory, which simplifies the explo-ration process. In the case of shared memory with relaxed
consistency,ESDcould miss possible paths, but will never synthesize an infeasible execution leading to a bug goal.
Data race detection can be turned on even when debug-ging non-race bugs. In this way,ESDcan synthesize paths even to bugs (e.g., deadlocks, buffer overflows) that manifest only in the presence of data races. Moreover, as with dead-locks, unknown data races may be fortuitously discovered.
In summary, ESD’s synthesis of bug-bound paths and schedules exploits features of the corresponding bug re-port to drastically reduce the search space. While ultimately equivalent to an exhaustive exploration,ESDuses heuristics to aggressively steer exploration toward those portions of the search space that have the highest likelihood of revealing the desired bug-bound execution.
5.
Execution Playback
Once the execution synthesizer (§3–§4) reaches its goal, it generates an execution file containing the playback informa-tion. This file is read by theESDplayback environment—the subject of this section. The goal of playback is to provide de-velopers an explanation of the bug symptoms, in a way that allows them to inspect the execution with a classic debugger.
5.1 Synthesized Execution File
In order to achieve the highest possible fidelity,ESDplays back a reported bug using the native binary that was run by the end user. The synthesized execution file contains con-crete values for all input parameters, all interactions with the external environment (e.g., through system calls), and the complete thread schedule. For all program input, in-cluding that coming from the environment,ESDsolves the constraints found during execution synthesis and produces corresponding concrete values (such asgetchar()=‘m’ and getenv("mode")[0]=‘Y’). This is identical to what automated test generators do (likeDART[18] and Klee [6]), except that these test generators do not produce thread schedules.
ESDsaves the thread schedule of a synthesized execution in the form of happens-before relations [25] between specific program instructions. ESDcan also save a strict schedule in the file, by recording the exact instructions on which the con-text was switched during synthesis, along with the switched thread identifiers. During the playback phase (§5.2), this strict schedule will enforce literally a serial execution of the program, whereas the schedule based on happens-before re-lations allows playback to proceed with the same degree of parallelism as the original execution.
5.2 Playback Environment
In order to steer a program into following the steps reflected in the synthesized execution file,ESDrelies on two compo-nents: one for input playback and one for schedule playback. For input playback,ESDreuses Klee’s driver, which takes from the trace the values of command line arguments and
passes them to the program. This driver also intercepts via a custom library the calls to the environment and returns the inputs from the execution file. To preserve the consistency of the execution,ESDalso relies on Klee’s symbolic filesystem and network models.
To play back the synthesized schedule,ESDgains con-trol of the concrete execution by intercepting synchroniza-tion calls with a shim library and by selectively instrument-ing the binary. The intercepted calls are then coordinated by ESD’s cooperative scheduler underneath the program being played back. While, during execution synthesis, the threads of a program were emulated, during playback the program is permitted to create native threads and invoke the native syn-chronization mechanisms. The threads are context-switched only when this is necessary to satisfy the happens-before re-lations in the execution file.
ESDcan also record and play back an execution serially. One single thread runs at a time, and all instructions execute in the exact same order as during synthesis. Serial execu-tion playback makes it easier for a developer to understand how the bug is exercised, because the bug’s causality chain is more obvious. Serial execution is also more precise, if the program happens to have race conditions. However, perfor-mance of parallel programs may be negatively affected by serialization, and in some cases this might matter.
Developers run the buggy program in the playback envi-ronment and can attach to it with a debugger at any time. They can repeat the execution over and over again, place breakpoints, inspect data structures, etc. After fixing the bug, ESDcan be re-run, to check whether there still exists a path to the bug. This is particularly helpful for concurrency bugs, where patches often do not directly fix the underlying bug, but merely decrease its probability of occurrence [27]. If ESDcan no longer synthesize an execution that triggers the bug, then the patch can be considered successful.
6.
Implementation
TheESDprototype currently works for C programs, and we verified that it works seamlessly with the gdb debugger. For symbolic execution, we adopted Klee [6] and extended it in several ways; the most important one is support for multi-threaded symbolic execution. After describing this extension in brief (§6.1), we provide a few details related to the imple-mentation of synthesis and playback (§6.2).
6.1 Multi-threaded Symbolic Execution
Klee [6] is a symbolic virtual machine designed for single-threaded programs. To allowESDto explore various thread schedules, we added support forPOSIXthreads.
Our extended version supports most common operations, such as thread, mutex and condition variable management, including thread-local storage functions. The new Klee thread functions are handlers that hijack the program’s calls to the real threads library. To create a simulated thread,ESD
resolves at runtime the associated start routine and points the thread’s program counter to it, creates the corresponding internal thread data structures and a new thread stack, and adds the new thread to theESDscheduler queue.ESDalso maintains information on the state of mutex variables and on how threads are joined.
ESD runs one thread at a time. The decision of which thread to schedule next is made before and after each call to any of the synchronization functions, or before a load/store at a program location flagged as a potential data race. Each execution state has a list of the active threads. To schedule a thread,ESDreplaces the stack and instruction pointer of the current state with the ones of the next thread to execute.
ESDpreserves Klee’s abstraction of a process with an as-sociated address space, and adds process threads that share this address space. As a result, the existing copy-on-write support for forked execution states can be leveraged to re-duce memory consumption—this is key toESD’s scalability.
6.2 Execution Synthesis and Playback
For the execution synthesis phase,ESDcompiles the pro-gram to LLVMbitcode [26], a low-level instruction set in static single assignment form. We chose LLVM because Klee operates onLLVMand because the associated compiler infrastructure provides rich static analysis facilities.LLVM provides load and store instructions up to word-level granu-larity, thus providing sufficient control forESDto synthesize thread schedules that reproduce the desired data races.
We speed up the computation of the distance to the goal during synthesis by caching computed distances and using specialized data structures to track search state information. This optimization is crucial, because execution states inESD can be switched at the granularity of individual instructions (i.e., is done frequently), so the selection of the next state to execute must be efficient.
During playback,ESDallows the program to create real threads and to call the real synchronization operations with the actual arguments passed by the program. The calls are intercepted in a library shimmed in viaLD_PRELOAD. In here, synchronization operations can be delayed as needed to preserve the ordering from the synthesized execution file.
Our current prototype can play back deadlocks involving mutexes and condition variables with negligible overhead. We are in the process of implementing playback for data races using PIN [28] for binary instrumentation; ESDcan then control the interleaving of threads’ memory accesses.
7.
Evaluation
In this section we evaluate ESD’s effectiveness in repro-ducing real bugs in real systems (§7.1). We also compare ESDto other approaches (§7.2) and analyzeESD’s perfor-mance (§7.3). All reported experiments ran on a 2 GHz quad-core Xeon E5405 CPU with 4GB of RAM, under 32-bit Linux.ESDhad a total of 2GB of memory available.
7.1 Real Bugs in Real Systems
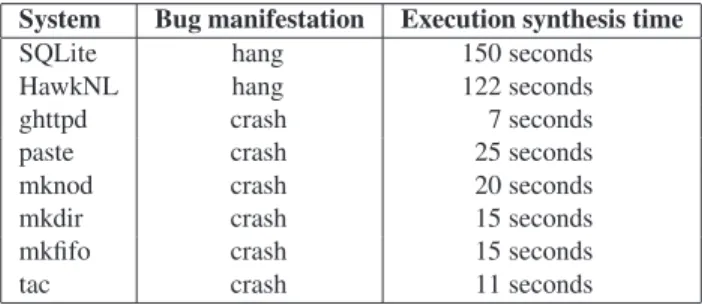
ESDsucceeds in automating the debugging of real systems code. Table 1 shows examples of the programs we ran under ESD, ranging in size across three orders of magnitude: from over 100,000LOC(SQLite) down to 100LOC(mkfifo).
System Bug manifestation Execution synthesis time
SQLite hang 150 seconds
HawkNL hang 122 seconds
ghttpd crash 7 seconds
paste crash 25 seconds
mknod crash 20 seconds
mkdir crash 15 seconds
mkfifo crash 15 seconds
tac crash 11 seconds
Table 1:ESDapplied to real bugs:ESDsynthesizes an execu-tion in tens of seconds, while other tools cannot find a path at all in our experiments capped at 1 hour.
One class of bugs results in hangs. For example, bug #1672 in SQLite 3.3.0 is a deadlock in the custom recur-sive lock implementation. SQLite, an embedded database engine, is a particularly interesting target, since it has a rep-utation for being highly reliable and the developer-built test suites achieve 99% statement coverage [36]. This makes us believe that the remaining bugs are there because they are particularly hard to reproduce. Another hang bug appears in HawkNL 1.6b3, a network library for distributed games. When two threads happen to callnlClose()andnlShutdown() at the same time on the same socket, HawkNL deadlocks.
Other bugs result in crashes. A security vulnerability in theghttpdWeb server is caused by a buffer overflow when processing the URL for GET requests [16]. The overflow occurs in thevsprintffunction when the request is written to the log. A bug in thepasteUNIXutility causes an invalid free for some inputs. The four bugs in the tac, mkdir, mknod, andmkfifoUNIXutilities are all segmentation faults, with the last three occurring only on error handling paths. TheUNIXutilities bugs are reported in [6].
ESDsynthesized the bug-bound execution paths entirely automatically. For most bugs,ESDwas able to automatically retrieve from the coredump the goal<B,C>of the synthe-sized path. The only exception was ghttpd, whose coredump contained a corrupt call stack; it took a few minutes to man-ually reconstruct the correct call stack with gdb.ESD consis-tently synthesized an execution path to the bug under consid-eration, output the synthesized execution file (a couple MB in each case), and played it back deterministically.
Using ESD, we were able to play back each bug in-side gdb. We perceived no overhead during playback, which means that ESD does not hurt the developer’s debugging experience. Even so, performance is rarely of importance, given that playback is repeatable and deterministic.
It is worth noting thatESDis effective not only for pro-grams, but also for shared libraries, such as SQLite and
HawkNL. Debugging libraries often has higher impact than debugging individual programs, because bugs inside li-braries affect potentially many applications. For example, SQLite is used in Firefox, iPhone, Mac OS X, McAfee anti-virus software, Nokia’s Symbian OS, PHP, Skype, and oth-ers [36]. In order to reproduce library bugs withESD, one writes a program that exercises the library through the sus-pected buggy entry points;ESDthen analyzes and symboli-cally executes these driver programs along with the library.
7.2 Comparison to Alternate Approaches
Having seenESDto be effective and fast, we now examine how it stacks up against alternate approaches.
The first approach to reproduce the bugs is brute force trial-and-error. To measure objectively, we ran several series of stress tests and random input testing for several hours. Neither of these efforts caused any of the bugs in Table 1 to manifest.
Bug finding tools, like Klee [6] and Chess [29], can also be used to find paths to bugs—these tools produce test cases meant to reproduce the found bugs. Such a comparison is not entirely fair, for several reasons. On the one hand,ESDcan synthesize execution paths for bugs that occur in production, away fromESD, whereas bug finding tools can only repro-duce bugs that occur under their own close watch. On the other hand, bug finding tools are not guided toward a spe-cific bug; their goal is to find previously unknown bugs and typically aim for high code coverage. Nevertheless, since we are not aware of other execution synthesis tools, we analyze the efficiency ofESD’s search via this comparison.
We extended Klee with support for multi-threading and implemented Chess’s preemption-bounding approach for ex-ploring multi-threaded executions [29]. We name the result-ing toolKC—a hybrid system that embodies the Klee and Chess techniques. We compare ESD to two different KC search strategies inherited directly from Klee:DFS, which can be thought of as equivalent to an exhaustive search, andRandomPath, a quasi-random strategy meant to maxi-mize global path coverage. We augmented the corresponding strategies to encompass all active threads and limit preemp-tions to two, as done in [29].
We ran both Klee andKCto find a path leading to each of the sample bugs in Table 1. After running for over one hour for each bug, neither tool found a path.2 In order to still have a practical baseline for comparison, we introduced four null-pointer-dereference bugs in thelsUNIXutility, for whichKCdoes find a path in less than one hour. Thelsutility has 3KLOC.
Figure 2 shows the time it takes ESDto find a path vs. KC’s two different search strategies. ESDis one to several orders of magnitude faster at finding the path to the target 2The five bugs inUNIXutilities were originally found with Klee and
re-ported in [6]. Our experiments did not find them perhaps due to differences in the Klee version and search strategies.ESDwas built on top a Klee code snapshot that was generously provided to us by its authors in Aug. 2008.
bug. We do not know ifKCwould eventually find a path to the bugs in Table 1 and, if it did, how long that would take.
1 10 100 1000 ls 1 ls2 ls3 ls4 ghttp d tac mkd ir m kfifomkn od pa steHaw kN L SQ Li te Pa th syn th t ime [ se co n d s] ( lo g sca le ) ESD DFS RandPath
Figure 2: Comparison of time to find a path to the bug:ESD vs. the two variants ofKC. Bars that fade at the top indicate KCdid not find a path by the end of the 1-hour experiment.
7.3 Performance Analysis
In order to analyze the impact of this paper’s contributions— zero-tracing execution path synthesis and the corresponding heuristics—we developed a microbenchmark, called BPF. The main purpose of BPF is to profile ESD without the measurements being influenced by environment interactions, such as library calls or system calls. For the more general case,BPFcan serve as a way to compare the performance of automated debugging tools likeESD.
BPFproduces synthetic programs that hang and/or crash. These programs have conditional branch instructions that depend on program inputs. When using more than one thread, the crash/hang scenarios depend on both the thread schedule and program inputs.BPFallows direct control of five parameters for program generation: number of program inputs, number of total branches, number of branches de-pending (directly or indirectly) on inputs, number of threads, and number of shared locks.
We performed experiments with eight configurations of BPF, comprising different program sizes. All data points cor-respond to programs with two threads and two locks, in which every branch instruction depends (directly or indi-rectly) on program inputs. There is one deadlock bug in each generated program. We varied the number of branch instruc-tions from 23to 210, which means that the number of possi-ble branches varied from 24to 211. We explored other bench-mark configurations as well, but, given the results shown here, the results were as expected.
In an attempt to quantify the deadlock probability in the generated programs, we ran stress tests for one hour on each program. Neither of them deadlocked, suggesting that each program has a low probability of deadlocking “in practice,” making these settings sufficiently interesting for our mea-surements. We then fed the programs toESDand required it to synthesize an execution path exhibiting the deadlock bug. We confirmed that the synthesized executions indeed lead to the deadlock, by playing them back in gdb.
Figure 3 shows the time to synthesize an execution as a function of program complexity (in terms of branches). We find thatESD’s performance varies roughly as expected; one exception is the jump from 28to 29branches—we suspect that structural features of the larger program presented an extra challenge forESD’s heuristics. Nevertheless,ESD per-forms well, keeping the time to synthesize a path to under 2 minutes, which is a reasonable amount of time for a de-veloper to wait. We also included, for reference, the time taken byKCwith theRandPathsearch strategy; it found a path within one hour only for the two simplest benchmark-generated programs. TheDFSstrategy did not find any path.
1 10 100
24 25 26 27 28 29 210 211
Path synth time [seconds]
( log scale )
Number of branches in program
( log scale )
ESD KC
Figure 3: Synthesizing a bug-bound path for programs of varying complexity withESDandKC.
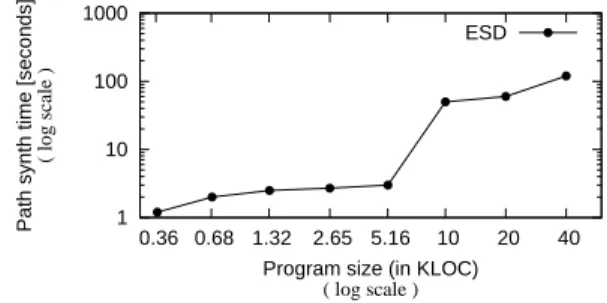
An alternate perspective on these results is to view them in terms of program size. Figure 4 shows the same data, but in terms ofKLOCin the generated programs.
1 10 100 1000
0.36 0.68 1.32 2.65 5.16 10 20 40
Path synth time [seconds]
( log scale )
Program size (in KLOC)
( log scale )
ESD
Figure 4: Synthesis time as a function of program size. We conclude thatESDoffers a practical way to automati-cally debug reported bugs, starting from just the correspond-ing bug report. Our evaluation shows that, whereas exhaus-tive or even improved random searches are unlikely to suc-ceed in finding a path to the target bugs,ESD’s execution synthesis heuristics are effective in guiding the search to-ward reproducing otherwise-elusive bugs.
8.
Discussion
In this section we discussESD’s usage models, its limita-tions, and howESDcan complement static analysis tools.
Usage Models: We envisionESDbeing used in at least two modes: developers can employ it directly during debugging, or it can be used for automated bug triage and deduplication.
When developers are assigned a bug report, they would pass the reported coredump to ESD, along with a hint for the type of bug. For the current ESD prototype, this can be crash, deadlock, or race condition. ESDcompiles the program source code with the standardLLVMtool chain and uses the resulting bitcode file. Developers can also instruct ESDto enable various types of detection (e.g., data races) during path synthesis, using the following command line: esdsynth <coredump file> <program>
< --crash | --deadlock | --race > [--with-race-det] [--with-deadlock-det]
ESDthen processes the coredump, extracts the necessary information, and computes the<B,C>goals for synthesis. It then performs the path and schedule search, and produces the synthesized execution file. Developers then use the play-back environment to reproduce the bug and optionally attach to the program with their favorite debugger:
esdplay <orig program binary> <synthetic exec file>
Another usage model is one in whichESDis part of an au-tomated bug reporting/triage system, where each incoming bug report is passed throughESD, to produce a determinis-tic execution file that gets attached to the bug report. At the same time,ESDcan be used to automatically identify reports of the same bug: if two synthesized executions are identical, then they correspond to the same bug.
Limitations: Our approach is based on heuristics and static
analysis to trim down the search space that would other-wise be too large to explore in a naive approach. Like any heuristic-based technique,ESDcould be imprecise; lack of precision can increase the time to find a bug, thus hurting ESD’s efficiency. We did not experience this situation for the bugs we reproduced withESD, but the theoretical possibility exists. IfESDis used as part of a bug triage system, then the potentially long running times can be amortized by running them off the critical path of debugging, unlike whenESDis directly used by a developer.
Execution synthesis may not always be able to repro-duce a bug. Symbolic execution has inherent limitations when solving complex constraints, such as finding a string mfor whichhashSHA-2(m)=0xf8e28ed7b8db9a. As a result, ESDwould have a hard time finding a program input that would exercise the then-branch of an if statement involv-ing the above condition. If there is a bug that manifests only when this condition holds,ESDwill likely not be able to re-produce it—doing so would amount to breaking theSHA-2 cryptographic hash function [31].
Some coredumps cannot be processed by ESD’s auto-mated analyzer. For example, if a bug corrupts the stack or the heap,ESDdoes not yet know how to repair the data struc-tures before extracting them and using them for synthesis. However, in most cases, the call stack can be repaired, and we are currently implementing automatic stack reconstruc-tion inESD. In other cases, obtaining from the coredump the
size of a dynamically allocated buffer can be challenging. ESDcan obtain the size of a dynamically allocated buffer by parsing the memory allocator metadata, but this requires in-ferring some of the heap characteristics. E.g., for the glibc memory allocator, metadata is stored relative to the base ad-dress of the allocated buffer and can be reliably retrieved only if the base address can be inferred from the coredump.
ESDcurrently relies on a 32-bit version of Klee, which means that it can address at most 4GBof memory. For large real programs, this can cause ESDto run out of memory before finding the desired path. We have recently ported Klee to 64-bit architectures, but have not yet portedESDto the new version of Klee. Once we do so, we expectESDto be able to make use of the increasing amounts of physical memory available on modern machines.
Complementing Static Analysis Tools withESD: We see
a clear opportunity in usingESDto weed out false positives generated by static analysis tools, such as race and deadlock checkers [14]. Static analysis is powerful and typically com-plete, but these properties come at the price of soundness: static analyzers commonly produce large numbers of false positives, and selecting the true positives becomes a labo-rious human-intensive task. Fortunately, the output of such tools is already similar to a bug report, soESDcould be used “out of the box” to validate each suspected bug: ifESDfinds a path to the bug, then it is a true positive. We plan to ex-plore in future work the synergy between such tools and our execution synthesis technique.
9.
Related Work
In this section we review related work. Some of these prior works provided inspiration forESD, while others are related by virtue of addressing similar problems. We broadly divide the body of related work into bug finding tools (some of which focus on inferring inputs, while others focus on find-ing schedules) and record/replay systems.
Bug Finding Tools – Inputs: There is a rich body of work
focused on discovering bugs in programs [6, 14, 18, 19, 34], with recent tools typically employing symbolic execution. ESDbuilds upon techniques developed for these systems, most notably Klee [6].
In combining static analysis with symbolic execution, we were inspired by a series of systems [7, 10, 11] which com-pute inputs that take a program to a specified undesired state, such as the location of a crash. UnlikeESD, these systems are targeted at program states that can be deterministically reached when given the right program arguments.ESDwas specifically motivated by the difficulty of reproducing elu-sive “non-deterministic” bugs, hence our emphasis on infer-ring not only program arguments, but also inputs from the program’s environment and scheduling decisions. Moreover, these prior tools require recording of certain program inputs and/or events; inESDwe go to the extreme of zero program tracing, in order to be practical for production systems.
Static analysis and symbolic execution were used to cre-ate vulnerability signatures [4] and to show that it is possi-ble to automatically create exploits from patches [5]. ESDis similar to this work in that it aims to create inputs that ex-ecute the program toward a certain vulnerability. However, ESDaddresses bugs more broadly than just input validation bugs and is able to handle multi-threaded programs.
Bug Finding Tools – Schedules: Even though program
testing is different from debugging, we drew inspiration for schedule synthesis from tools that search for concurrency bugs, like Chess [29] and DeadlockFuzzer [21]. Still, there exist major differences. These tools exercise target programs in a special environment and, when a bug occurs, the tools are able to replay those bugs. In contrast,ESDreproduces bugs discovered in the field by end users, in which case re-quiring the program to run in a special setting is not feasible. Chess and DeadlockFuzzer also require the existence of a test case that provides all required program input, whereas ESDautomatically infers this input.
Another important difference appears in the use of heuris-tics. Chess, for example, employs a technique called itera-tive context bounding (ICB) [29]. ICB assumes that priori-tizing executions with fewer context switches is an efficient way to find concurrency bugs, so Chess repeatedly runs an existing test case, each time with a different schedule, and limits the total number of possible context switches, as in ICB. When searching for a specific bug, we foundESD’s approach to be much faster. Also,ESDachieves scalability without having to bound the number of context switches. We repeat, however, that Chess’s goals are different fromESD’s, so direct performance comparisons must be done carefully.
Similarly to RaceFuzzer [35], ESDdynamically detects potential data races and performs context switches before memory accesses suspected to be in a race. However,ESD’s approach is more precise, because it is targeted at a specific bug and uses checkpoints to explore alternate thread inter-leavings, unlike RaceFuzzer’s random scheduler. Moreover, by using symbolic execution,ESDcan achieve substantially higher coverage for data race detection.
Record/Replay: A classic way of reproducing bugs is by
using whole-system replay: the application is run inside a specialized virtual machine, which captures all relevant de-tails of an execution, enabling it to be replayed later [12, 13]. This approach works well for bugs that occur relatively frequently. However, concurrency bugs in production are rare occurrences, so the performance and space overhead of always-on recording of the entire execution offers less pay-back. Reverse debugging [24] uses VMs to travel back and forth in an execution, which is useful in dealing with hard-to-reproduce bugs; this approach typically incurs prohibitive recording overhead for bugs that occur infrequently. In con-trast,ESDrequires no tracing, so it presents unique advan-tages in dealing with rare events, such as concurrency bugs.
Higher-level replay systems, like R2 [20], can record li-brary interactions and replay them. These approaches typi-cally incur lower overhead than whole-system replay.ESD’s playback environment uses similar techniques, extending them with the ability to play back asynchronous events (such as thread preemptions) that are crucial to reproducing con-currency bugs. The goal of R2 is to observe the interactions that lead to a particular problem.ESD, on the other hand, can synthesize the desired execution, thus obviating the need for any runtime observations.
Recent work looked at replaying concurrency bugs, such as data races, while aiming to minimize the amount of user-side recording [2, 33]. While similar in spirit toESD, these tools still require recording all program inputs and the order of synchronization operations, thus adding overheads as high as 50%, which is hard to justify in production systems.
Aftersight [9] is an efficient way to observe and analyze the behavior of running programs on production workloads. Aftersight decouples analysis from normal execution by log-ging non-deterministic VM inputs and replaying them on a separate analysis platform.ESD, on the other hand does not monitor the running program, rather merely requires a core-dump to perform its analysis at the developer’s site.
10.
Conclusion
This paper introducedexecution synthesis, a technique for automatically debugging real software. We presentedESD, a practical tool that embodies this technique and alleviates the burden of fixing hard-to-reproduce bugs.ESDstarts from a bug report and automatically synthesizes an execution that causes the bug to manifest. Developers can then determin-istically play back this execution in their favorite debugger as many times as necessary to generate a fix.ESDrequires no program modifications and no runtime tracing, thus intro-ducing no runtime overhead.
We showedESDcan reproduce, with no human interven-tion, concurrency bugs and crashes reported in real applica-tions. It took less than three minutes to synthesize explana-tions for these bugs, which suggestsESDis practical for fre-quent use during development and debugging. To our knowl-edge,ESDis the first tool that can automatically synthesize executions to reproduce bugs that occurred in the field, with-out incurring the overhead of execution tracing.
Acknowledgments
We thank Silviu Ganceanu for initial contributions toESD and Vlad Ureche forESD’s automatic coredump analyzer. We are grateful to Daniel Dunbar and Cristian Cadar for sharing an early version of Klee and for generously assisting us in our experiments. The paper has been improved by feed-back from our shepherd, Wolfgang Schröder-Preikschat, the anonymous EuroSys reviewers, and our EPFL colleagues. This work was made possible in part by financial support received from Microsoft Switzerland.