Executive Summary
Today, there is a compelling need for data center efficiency and to find a competitive ad-vantage in the cloud hosting business. Providers need—and are finding ways—to extract greater value from their cloud environments. This document examines high-temperature ambient (HTA) operating conditions and how they affect power consumption of Intel® Xeon® processor E5 family-based servers.
Through a joint project between Intel and a leading European hoster, Intel Xeon processor-based servers were tested and evaluated at key HTA conditions to verify functionality and help the test team understand break-even points between higher inlet air temperatures with resultant power savings versus higher server power consumption and power losses caused by increased fan speeds. The goal was to find the highest potential cooling power savings and also to explore what effects can be encountered with continuously running IT equipment at high temperatures.
found by staying within an increase of ap-proximately 10° C and maintaining a 28° C environment. This avoided the additional server power consumption observed be-yond that temperature level, which offset overall cooling efficiency gains.
To put these results into context, a Romonet Prognose1simulated data center model
was created to analyze power savings from cooling efficiencies gained in the en-tire data center as HTA conditions were in-troduced. Section 3 details the conclusions from this simulation, showing a potential yearly power savings of around 9 percent over the initial baseline of 18° C. These power cost savings are based on cooling efficiency gains around implementing a 28° C HTA environment in an approximately 3,000-square-foot data center, running workloads of 50 percent utilization on all test servers. In the testing, specific power savings yields upwards of €38K per year in energy cost savings based on approximately €420K in total power con-sumption (Table 1).
High-Temperature
Hosting Data Center
Testing to Discover the Opportunities and Challeges in High-Temperature
Operating Conditions in a Hosting Data Center
Overview
Intel and a leading hosting service provider came together in December of 2012 to un-derstand server operations in an HTA condi-tion to test and evaluate power consumpcondi-tion of Intel Xeon processor-based servers. Section 2 highlights the testing that was done within a temperature-controlled en-vironment where inlet air temperatures were raised and held at key set points. Various brand-name servers based on Intel Xeon processors were stressed to different utilization levels within these temperature set points. Measurements were taken to understand the resulting changes in power consumption as inlet air temperatures rose from an initial baseline of 18° C up to 38° C. Testing results showed that server power consumption began to increase on all server models at temperatures higher than 28° C. Viewing these results in conjunction with the fa-cilities operating conditions, Intel found that an optimal HTA operating point was
Table 1. Server Types
Server Type
IBM System x3550*, System x3550 M4*, System x3250 M2*, System x306M*
Intel® Server System R2216GZ4GCLX
Storage: 14x 100 GB SSD (Intel© Solid-State Drive Series 710)
Intel Server System H2216WPQJR
Storage: 14x 600 GB SSDs (Intel Solid-State Drive Series 310)
2x 240 GB SSDs (Intel Solid-State Drive Series 540)
HP DL360p Gen8 (Intel® Xeon® processor E5 family)
Amount
13x
1x
4x
2x
A number of issues with HTA operations need to be weighed. The entire supporting infrastructure must be able to support an HTA environment. The air handling units (AHUs) work more efficiently at higher temperatures, but increasing chilled water temperatures supplied can exceed manu-facturers’ specs for expansion in chilled water piping (as the test team encoun-tered, based on current pipe manufacturer specs provided). The team's recommenda-tions for HTA were considered for future data center environments. Furthermore, high-temperature operation reduces re-sponse time for data center personnel and equipment with disaster recovery proce-dures should a cooling failure occur. A stan-dard 15 minutes of recovery time is reduced to a few minutes due to these reduced safety margins. As a consequence, opera-tional procedures need to be fit to function under these constraints as well.
One way to reduce reaction time in case of such failure was to constantly monitor power data by implementing an Intel© Data Center Manager (Intel® DCM)-based solu-tion. In addition to being able to gather data throughout the data center, this solu-tion also adds power-consumpsolu-tion-limiting capabilities for specific servers2, prolonging
business continuity time by up to 25 per-cent in a power outage3. Section 4 provides
more background on the enabled usage models in Intel DCM.
Another way to support an HTA environ-ment, with even greater gains, also to be
considered as an element of future data center design, is in the use of free cooling using airside economizers. Directly pulling cold air from outside and venting heated exhaust air through a plenum area for much of the year, coupled with a traditional closed-loop cooling system, provides an even larger reduction in power costs. When factoring in server throughput, re-freshing older-generation systems with new Intel Xeon processor-based servers will typically offer generational improvements of -performance-per watt metrics much in line with Moore’s law. Architectural improve-ments of the server platforms also provide a lower idle power consumption, together im-proving server usage efficiency (SUE)4, a key
efficiency metric often not included in power usage effectiveness (PUE) disclo-sures but greatly useful as part of an overall data center efficiency strategy.
Section 5 summarizes and recommends these and other measures.
Empirical Data Center Tests
Testing MethodologyThe methodology consisted of testing Intel® architecture-based servers in an HTA with dedicated workloads while focusing on the effects of the temperature on server power consumption. Servers using Intel ar-chitecture provide real-time temperature sensor and power consumption data, which was used during the testing. Along with the server data, a temperature-controlled
Contents
Overview . . . .1
Empirical Data Center Tests . . . .2
Testing Methodology . . . .2
Lab Setup . . . .3
Experimental Results . . . .3
Calculating Savings . . . .4
Romonet Model . . . .4
HTA Model Assumptions . . . .4
Efficiency Model Variations . . . . .4
Efficiency Gains . . . .4
Proactive Management . . . .5
Power Capping . . . .5
Use Cases . . . .5
Assumptions . . . .6
Conclusions and Recommendations . . .6
Performance and Power Testing . . .6
Key Findings . . . .6
Outook and Next Steps . . . .7
Containment and Raised Floors . . . .7
Airside Economizers . . . .7
Server Refresh . . . .7
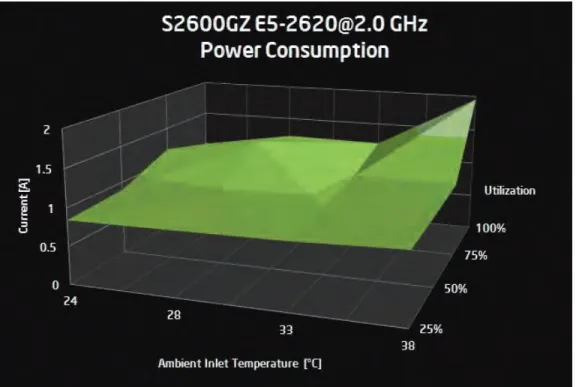
Figure 1
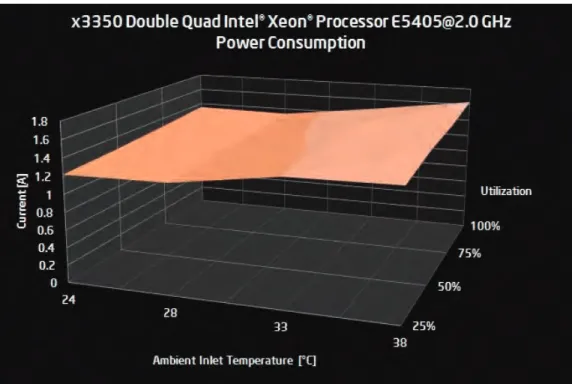
. Power consumption of Intel Xeon processor E5 family equipped server as a function of inlet temperature and CPU utilizationThe current Intel Xeon processor E5-2620 product family-based server exhibited the lowest power consumption, with around 33° C inlet temperature and a noticeable power increase above that, especially dur-ing high utilization, as shown in Figure 1. The likely cause of this effect is the com-bined power consumption of the server’s fans as they respond to the increased inlet temperatures and the maximum power consumption of the processor itself. In contrast to Figure 1, an earlier-genera-tion server is characterized in Figure 2 (one of the IBM x3350 machines dating from approximately 2008). Two areas of differ-ence are clearly visible:
1. Power consumption at low utilization is much higher than with newer, more effi-cient server designs.
2. The relative increase in power consump-tion with raised temperatures and uti-lizations is therefore much smaller, since the server started out with a higher ini-tial idle power consumption.
Overall, the power consumption difference over the combined range of temperatures server aisle environment was utilized,
where servers were stressed to specific multiple utilization levels using synthetic workloads. While stressing the systems, heating units maintained inlet tempera-tures within the contained cold aisle of 24° C, 28° C, 33° C, and 38° C, respectively. Testing server power consumption incorpo-rated using data drawn from smart PDUs and Intel DCM software to monitor power supply power consumption, and wall power being reported by the servers.
The following components were part of the experimental setup:
• Separate contained server room with
controllable ambient temperature using remote temperature-controlled units
• Multi-generational sample of HP
Pro-Liant*, IBM xSeries*, and Intel Xeon processor-based server systems
• Measurements of power draw at a
range of temperatures and server utilizations
• Temperature range: 24° C, 28° C, 33° C,
and 38° C
• Server load testing of 25, 50, 75, and
100 percent utilization
• Temperature sensors on server racks
at 22U and 42U height were utilized for validating inlet and outlet sensor readings in the servers.
Lab Setup
The server pool consisted of samples of machines used in the hosting provider’s production and thus represented in a smaller-scale the distribution of a histori-cally grown data center.
All servers were equipped with the Win-dows* 2008 R2 operating system. Testing software was Passmark Software's Burn-In-Test* v5.3. All servers were connected to a central management station.
Experimental Results
Figures 1 and 2 show power consumption with two-server system types of different generations. These graphs highlight power consumed in amperes (A) at 230 VAC across inlet temperatures ranging from 24 to 38° C and utilizations ranging from 25 to 100 percent.
and utilizations remains smaller. Thus, the effect of changing temperatures has less obvious advantages. Still, a noticeable local optimum for this type of machine can be found at around 28° C as well.
Calculating Savings
Providing a blueprint for data center effi-ciency is helpful in understanding future required changes and potential savings based on those changes. A simulation using Romonet Prognose* 2.1 software was used to this end. Site power consumption and operational equipment costs were pro-vided by hosting partner to calibrate the Romonet model, while data from the server experiments was the source of simulated IT equipment power.
Romonet Model
Based on initial data center power costs and savings seen during actual testing, data was included in simulated models cre-ated to run potential HTA scenarios and model future data center power savings. The results were that HTA has the poten-tial to yield upwards of 50 KWh in power savings and €38K per year in power cost savings. Because actual testing showed a 10 percent increase in server power con-sumption (from 28° C to 33° C
• Step 2:Changed simulated CRAC con-trol algorithm to be based on wet bulb temperature measurements (when temp is low, you get a few more oper-ating degrees) but at the same nomi-nal temperature.
• Step 3: Increased chilled water temp to 22° C (inlet air 28° C).
• Step 4: Chilled water temp to 27° C (inlet air 33° C).
Ultimately, moving from 16° C supply air to 28° C supply air temperature decreases cooling power usage by €37,620 (Table 2).
Efficiency Gains
From Figure 3, we see that at an 11° C out-side temperature, the model switches over from the cooling tower to the chiller. Once the chiller has to be utilized for cooling, there is a reduction in the data center in-frastructure efficiency (DCIE). This big jump in the power consumption reduces effi-ciency. As such, by running in an HTA envi-ronment, the chiller is utilized much less and only at much higher temperatures, al-lowing for the majority of savings seen in the model.
HTA), savings decreased as temperatures continued to increase. The expected power saving benefits of €44K per year are off-set with IT power increases of equipment (Table 2).
HTA Model Assumptions
In the model, it was assumed that the cool-ing infrastructure could support HTA and higher chilled-water temperatures (CWT). PUE numbers are based on the Romonet model and demonstrate a PUE trend down-ward based on future data center HTA de-sign changes made. All models are assuming a 50 percent load on IT equip-ment. Additional numbers were added for items such as office lighting, generator pre-heat power loads, and splits between two UPSs at 75 and 25 percent.
Efficiency Model Variations
Discrete steps were simulated as a step-wise strategy of data center improve-ments. Starting from an as-is model with an inlet air temperature of 16° C, the model was changed in the following fashion:
• Step 1:Raised chilled water tempera-ture to 18° C (resulting in inlet air temperature of 24° C).
Figure 2
. Power consumption of earlier-generation server as a func-tion of inlet temperature and CPU uti-lizationProactive Management
Instrumentation of server infrastructure is a key feature in monitoring and managing IT power consumption for data center effi-ciency and resiliency.
Power Capping
Intel© Node Manager (Intel® NM) is in-server instrumentation for the measurement and control of key environmental parameters (e.g., power consumption, fan speed, and temperatures). Intel NM allows collecting measurements and reporting them to a
Use Cases
These two tools are valuable aids in manag-ing data center power consumption. Com-bined, they enable the following use cases and their associated business benefits:
1. Rack provisioning and capacity planning
• Actual power measurements improve
accuracy for rack power maximums and minimums.trends.
management station via out-of-band com-munication through IPMI. Intel NM also im-plements a power-limiting feature called power capping.
Intel DCM is a software development kit (SDK) with a graphical user interface that allows the collection of measurements from a potentially large group of instru-mented servers, storing them in a database for later analysis, and—if supported by technologies such as Intel NM—offers ca-pabilities to apply flexible power capping policies to larger pools of servers.
Table 2. Romonet Model Parameters Simulating Stepwise Data Center Improvements
As-Is Step 1 Step 2 Step 3 Step 4 PUE 1.623 1.565 1.515 1.476 1.452 GWh 3.805 3.671 3.553 3.463 3.405 Energy Cost/Year (€) 418.5K 403.8K 390.8K 380.9K 374.5K CWT Set-point 10 18 18 22 27 Tower/ Chiller Cu-tover 11 13 13 17 22 Max. Con-denser Air Temp. 38 46 46 50 55 CRAC CWT 10 18 18 22 27 Supply-Side Temp. 16 23 23 27 32 Return-Side Air Temp. 28 36 36 40 45 System Inlet Temp. 16 24 24 28 33 Power Inc. Parameter 1 9 9 Wet Bulb: 13 - 17 C Wet Bulb: 13 - 23 C
Extra IT Load 0% 0% 0% 0.6% 10%
Cost Summary
CRAC Settings
Figure 3
. Center infrastructure ef-ficiency (DCIE) chart for simulated data center 100% 80% 60% 40% 20% 0 DCIEIT Electrical Load
90 - 100% 80 - 90% 70 - 80% 60 - 70% 50 - 60% 40 - 50% 30 - 40% 20 - 30% 10 - 20% 0 - 10% 267 KW
267 KW
134 KW
67 KW
0 KW 30 25
17.5 10 2.5 Temp (DB)
• Monitored power can be used to understand daily or weekly power usage trends.
• Measured power can be used to
understand maximums to determine and improve rack server density. • Enable the ability to install additional
servers per rack based on power capping policies ability to enforce a global cap.
• The payoff: Potential increase in rack
density by 40 percent5.
2. Intelligent power strip replacement
• Avoids the cost of expensive power
strips using built-in power monitoring capacity.
3. Disaster avoidance under impaired conditions
• Protects hours of work lost if
unscheduled shutdown happens.
• Enables real-time assessment of
power margins and power budgeting for continued operation.
• Enables prioritizing of power alloca-tion to servers in case of an outage using dynamic policies.
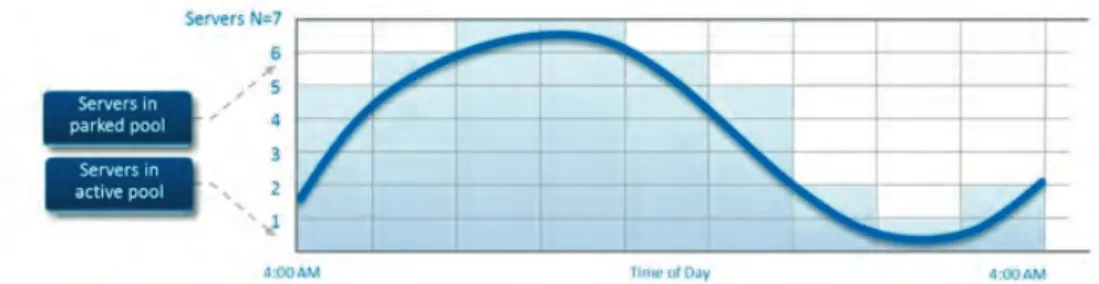
4. Server infrastructure scheduling to meet workload demand (Figure 4) 5. Building real-time thermal maps of
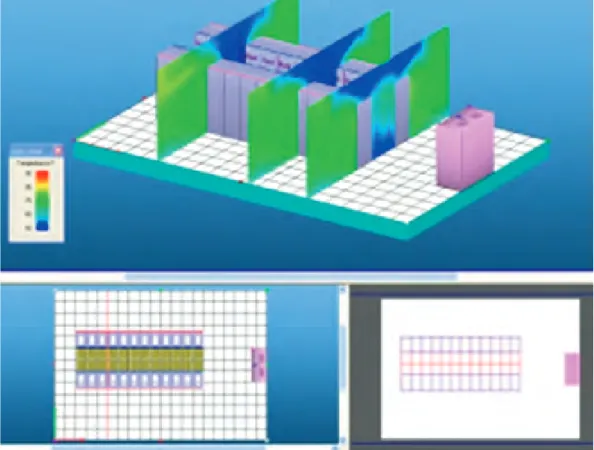
data center to manage heat loads and distribute dynamically in a vir-tualized cloud computing environ-ment (Figure 5).
6. Identifying high power idle and underutilized servers
Xeon processor-based servers. These servers were stressed to different uti-lization levels and different inlet air tem-peratures. Data was captured using smart PDUs, Intel DCM, and temperature rack-mounted sensors. The initial base-line inlet server air temperatures of ap-proximately 16° C/18° C and were raised to set points of 24° C, 28° C, 33° C, and 38° C running server loads of 25, 50, 75, and 100 percent utilization.
Based on testing results, Intel found there was an optimal set point for HTA operations by staying within an increase of 10° C up to a temperature of 28° C, where server power consumption stayed relatively constant. Testing showed no substantial measured increases in server power consumption (at 28° C there was a 1 percent increase in server power) within this range, so the efficiency gains in cooling infrastructure were maximized up to that point by not being offset by server power increases. (On the other hand, at 33° C there was a 12 percent in-crease in server power.) Additionally, server function was not affected by HTA conditions of up to 38° C.
KeyFindings
• The optimum set point after
increas-ing temperatures was 28° C. The increased IT power consumption of tested servers at this temperature was less than a 1 percent increase.
• Simulated power consumption
sav-ings from increasing temperatures resulted in annual power savings of at least 9 percent of total power. These results took into account the geographic location of the hosting data center and average weather
• Provides the ability to monitor and
resolve high idle servers and those that are underutilized.
• Provides the ability to efficiently use server infrastructure based on fixing or refreshing older servers.
Power Capping Assumption
Experience shows, across a range of workloads, that applying a 5 percent power cap (setting an external limit of power consumption to 95 percent of the measured maximum) will usually not af-fect service level agreements (SLAs) and should be considered as an additional tool to reduce chiller operation in warmer months (Source: Intel IT).
Conclusions and Recommendations
Energy costs continue to drive innova-tion, so finding every area where effi-ciencies can be increased is essential. In fact, efficient use of power may be the single biggest factor in determining server total cost of ownership (TCO). The above outlined areas observed by Intel provide pieces to the power efficiency puzzle. An overall power efficiency strat-egy is required for managing a reduction of power consumption. This consists of HTA design practices, air containment, airside economizers for cooling efficiency, power-efficient servers for improved power management, and software tools that provide power analytics and dynamic management to optimize the compute environment.
Performance and Power Testing
Performing actual HTA testing helped Intel understand how these conditions affected power consumption of Intel
Figure 4
. Servers in a pool are dynamically activated or deacti-vated Whenever workload thresholds are crossedconditions along with other assumptions (see High Temperature Ambient [HTA] Model Assumptions).
• High-temperature operations in future
data center designs should be coupled with airside economizer usage to maximize free cooling benefits when outside temperatures are below the desired set point of 28° C.
• Power management technologies
such as Intel DCM, coupled with Intel NM, will manage and reduce power consumption by dynamically control-ling server power usage.
• Refreshing with new, power-managed
servers provides lower idle power consumption and higher performance per watt of power efficiency.
Outlook and Next Steps
Along with HTA, key data center design best practices and technologies should be looked at for overall efficiency gains and in aiding in developing an overall data center efficiency strategy.
ings, since designs don’t have to be cre-ated to the highest-tier customer. These designs and potential additional savings with airside economizers and reduced re-dundancy in UPS, cooling, and removal of raised floor is worth investigating.
Server Refresh
Key findings of older servers (four-plus years old) show that you can achieve a 10:1 consolidation ratio on average by replacing older servers based on single-core technol-ogy7. The power consumption is reduced
not only by requiring fewer servers, but ad-ditional efficiencies are realized when at low utilization or idle states.
From the testing completed, it was noted that older servers were consuming power at much higher rates than newer, more effi-cient servers. This is significant in a hosting business model. In a dedicated or physical hosting scenario, each customer is assigned their own physical server and, therefore, ul-timately responsible for the server’s utiliza-tion. Consequently, these machines tend to exhibit rather low levels of compute usage. This inefficiency is magnified when high
Containment and Raised Floors
Best practices for data center design in-clude containment of hot or cold aisles. This suggestion, based on Intel IT best practices, includes employing hot isle con-tainment with the use of a plenum (false ceiling) and ducting to the plenum from CRAC units. This allows the addition of air-side economizers to be included in these future designs and the venting of heated exhaust air directly outside. Another key recommendation is to eliminate a raised floor, thus saving money in construction costs. An airside economizer (AHU) can pressurize the entire room instead of just the under-floor area.
Airside Economizers
Airside economizers can be included in fu-ture data center module designs for cool-ing efficiency, based on a temperate climate for much of the calendar year. Also, specifically for Internet hosters, the ability to have different Tier6ratings in
dif-ferent data centers allows for power sav-ings for lower tier customers (Tier 1/2) and a competitive advantage for cost
sav-Figure 5
. Data center infra-structure management soft-ware is using monitored temperature values to visual-ize a real-time heat map of aidle power consumption rates of older servers are used. Refreshing these servers with new models reduces IT power con-sumption costs.
In the context of a virtualized hosting data center, customers are assigned virtual ma-chines that can be freely placed and consol-idated by the hosting provider on the lowest possible number of servers. Higher
consolidation ratios of newer servers also reduce costs and this consolidation effect provides opportunities to right-size IT equipment for this business model.
DCIM Tools
Intel DCM is part of many commercial data center infrastructure management (DCIM) solutions. It supports advanced usage
mod-els ranging from comprehensive real-time monitoring through rack density optimiza-tions and advanced resiliency mechanisms to power and thermal-aware workload scheduling mechanisms.
Find a complete list of solution
vendors here.
1 See http://www.romonet.com/romonet-software for a description of this tool.
2Intel DCM, Supported devices (http://software.intel.com/sites/datacentermanager/supported-devices.php). 3 “Data Center Energy Efficiency Using Intel® Intelligent Power Node Manager and Intel® Data Center Manager”
(http://software.intel.com/sites/datacentermanager/White%20Paper_CHT_and_Intel_Power_Management_Technologies_v1.pdf).
4 “Assessing IT Efficiency through Server Utilization Effectiveness,” William Carter, Data Center World, Spring 2012 conference proceedings.
5 Baidu Case Study White Paper, “Intelligent Power Optimization for Higher Server Density Racks” (http://software.intel.com/sites/datacentermanager/intel_node_manager_v2e.pdf). 6 See Tier ratings based on The Uptime Institute (http://uptimeinstitute.com/).
7 “Staying committed to Server Refresh Reduces Cost”
(http://www.intel.com/content/www/us/en/windows-7-upgrade/intel-it-pc-refresh-staying-committed-to-server-refresh-reduces-cost-brief.html?wapkw=server+refresh).
INFORMATION IN THIS DOCUMENT IS PROVIDED IN CONNECTION WITH INTEL PRODUCTS. NO LICENSE, EXPRESS OR IMPLIED, BY ESTOPPEL OR OTHERWISE, TO ANY INTELLECTUAL PROPERTY RIGHTS IS GRANTED BY THIS DOCUMENT. EXCEPT AS PROVIDED IN INTEL'S TERMS AND CONDITIONS OF SALE FOR SUCH PRODUCTS, INTEL ASSUMES NO LIABILITY WHAT-SOEVER AND INTEL DISCLAIMS ANY EXPRESS OR IMPLIED WARRANTY, RELATING TO SALE AND/OR USE OF INTEL PRODUCTS INCLUDING LIABILITY OR WARRANTIES RELATING TO FIT-NESS FOR A PARTICULAR PURPOSE, MERCHANTABILITY, OR INFRINGEMENT OF ANY PATENT, COPYRIGHT OR OTHER INTELLECTUAL PROPERTY RIGHT.
A "Mission Critical Application" is any application in which failure of the Intel Product could result, directly or indirectly, in personal injury or death. SHOULD YOU PURCHASE OR USE INTEL'S PRODUCTS FOR ANY SUCH MISSION CRITICAL APPLICATION, YOU SHALL INDEMNIFY AND HOLD INTEL AND ITS SUBSIDIARIES, SUBCONTRACTORS AND AFFILIATES, AND THE DI-RECTORS, OFFICERS, AND EMPLOYEES OF EACH, HARMLESS AGAINST ALL CLAIMS COSTS, DAMAGES, AND EXPENSES AND REASONABLE ATTORNEYS' FEES ARISING OUT OF, DIRECTLY OR INDIRECTLY, ANY CLAIM OF PRODUCT LIABILITY, PERSONAL INJURY, OR DEATH ARISING IN ANY WAY OUT OF SUCH MISSION CRITICAL APPLICATION, WHETHER OR NOT INTEL OR ITS SUBCONTRACTOR WAS NEGLIGENT IN THE DESIGN, MANUFACTURE, OR WARNING OF THE INTEL PRODUCT OR ANY OF ITS PARTS.
Software and workloads used in performance tests may have been optimized for performance only on Intel microprocessors. Performance tests, such as SYSmark and MobileMark, are measured using specific computer systems, components, software, operations and functions. Any change to any of those factors may cause the results to vary. You should consult other information and performance tests to assist you in fully evaluating your contemplated purchases, including the performance of that product when combined with other products. For more information go to http://www.intel.com/performance.
Intel may make changes to specifications and product descriptions at any time, without notice. Designers must not rely on the absence or characteristics of any features or instructions marked "reserved" or "undefined". Intel reserves these for future definition and shall have no responsibility whatsoever for conflicts or incompatibilities arising from future changes to them. The information here is subject to change without notice. Do not finalize a design with this information.
The products described in this document may contain design defects or errors known as errata which may cause the product to deviate from published specifications. Current character-ized errata are available on request. Contact your local Intel sales office or your distributor to obtain the latest specifications and before placing your product order.
Copyright © 2013 Intel Corporation. All rights reserved. Intel, the Intel logo, and Xeon are trademarks of Intel Corporation in the U.S. and other countries. * Other names and brands may be claimed as the property of others. Printed in USA SS/HM Please Recycle