www.rsc.org/advances
RSC Advances
This is an Accepted Manuscript, which has been through the Royal Society of Chemistry peer review process and has been accepted for publication.
Accepted Manuscripts are published online shortly after
acceptance, before technical editing, formatting and proof reading. Using this free service, authors can make their results available to the community, in citable form, before we publish the edited article. This Accepted Manuscript will be replaced by the edited, formatted and paginated article as soon as this is available.
You can find more information about Accepted Manuscripts in the
Information for Authors.
Please note that technical editing may introduce minor changes to the text and/or graphics, which may alter content. The journal’s standard Terms & Conditions and the Ethical guidelines still apply. In no event shall the Royal Society of Chemistry be held responsible for any errors or omissions in this Accepted Manuscript or any consequences arising from the use of any information it contains.
Two-dimensional Asynchronous spectrum with auxiliary cross
peaks in probing intermolecular interactions
Xiaopei Li a, b, c, Anqi Heb, d, Kun Huanga,*, Huizhou Liua, Ying Zhaoe, Yongju Weif, Yizhuang Xub, d*, Isao Nodab,g, Jinguang Wu b
a
Institute of Process Engineering, Chinese Academy of Sciences, 100190, P. R. China
b
Beijing National Laboratory for Molecular Sciences, State Key Laboratory for Rare Earth Materials Chemistry and Applications, College of Chemistry and Molecular Engineering, Peking University, Beijing 100871, P. R. China
c
Dalian Polytechnic University, Dalian 116034, P. R. China
d
Ninhai Doubly Advanced Martial Co, Ltd., Ninhai, 315602, China
e
Institute of Chemistry, Chinese Academy of Sciences, 100190, P. R. China
f
College of Chemistry and Material Science, Hebei Normal University, Shijiazhuang, 050016, P.R. China
g
Department of Materials Science and Engineering, University of Delaware, Newark, Delaware 19716, United States
Corresponding Authors: [email protected], [email protected]
RSC
Advances
Accepted
ABSTRACT
A new approach called “asynchronous spectrum with auxiliary peaks (ASAP)” is proposed for generating 2D asynchronous spectrum to investigate intermolecular interaction between two solutes (P and Q) dissolved in the same solutions. In the ASAP approach, a virtual substance S with an isolated peak assumed to be at vS is introduced, while the
characteristic peaks of P and Q are actually observed at vP and vQ. The
concentrations series of P, Q and S are specifically designed so that spectral portion that has nothing to do with the intermolecular interaction between P and Q is completely removed from the 2D asynchronous spectrum. Auxiliary cross peaks around (vP, vS)and (vQ, vS) can be used to reveal
spectral variation caused by intermolecular interaction, which cannot be observed on conventional cross peaks appearing around the spectral coordinates (vP, vP), (vP, vQ), (vQ, vP), (vQ, vQ). For example, variation of
absorptivity of P caused by intermolecular interaction between P and Q can be probed from the auxiliary cross peaks around (vP, vS) when Q does not
even have any characteristic peak in the observed spectral range.
Keywords: Orthogonal, Auxiliary cross peaks, Asynchronous spectrum,
Intermolecular interaction
RSC
Advances
Accepted
1. Introduction
Intermolecular interaction occurring ubiquitously in nature, is of the utmost importance with regard to basic science as well as applications in organic, biological, medicinal and materials chemistry [1-10]. Investigation on intermolecular interaction becomes one of the most active topics in the past two decades [11-22]. For example, non-covalent interactions are at the root of the whole field of supra-molecular chemistry that leads to the formation of highly complex and fascinating structures [23]. In catalysis, the impact of weak interaction between ligand and substrate on controlling the reactivity has been recognized [24]. In the field of pharmaceuticals, a key step is to rationalize and optimize the interactions between a potential drug and a relevant receptor [25]. In protein chemistry, exploration and comprehension of noncovalent bond interactions is a key to predict the pathways of protein folding and quantify the relative thermodynamic stability of intermediate and final states [26]. In comparison to a plethora of theoretical calculations of intermolecular interactions, experimental studies on these intriguing intermolecular interactions are still quite limited.
Two-dimensional (2D) correlation spectroscopy is a powerful spectroscopic technique proposed by Noda in the late 1980s[27-30] and has attracted extensive application in a variety of research fields for the past 25 years[31-47]. In 2D correlation spectroscopy, some forms of perturbation are applied to the sample, which imparts variations of spectral signals (called dynamic spectra). Based on cross-correlation analysis, the dynamic spectra
RSC
Advances
Accepted
are then transformed into a spectrum with two independent spectral variable axes (2D correlation spectrum). In general, 2D correlation spectra are classified into two types: synchronous correlation spectrum and asynchronous correlation spectrum obtained by using different cross-correlation methods. Owing to the enhancement of the spectral resolution by spreading the peaks over the second dimension, the subtle changes of the sample, not readily seen in the original data set, can be visualized in terms of cross peaks in 2D correlation spectra.
One of the most important features of 2D correlation spectra is that cross peaks in 2D correlation spectra can potentially be used to characterize intermolecular interactions [27, 28]. However, this approach suffers from the following problem: interfering cross peaks due to other sources of correlation may also arise even if there are no intermolecular interactions. This makes the mere appearance of cross peaks in 2D correlation spectra difficult to be used as a reliable tool to characterize intermolecular interactions.
To address the problem, we proposed orthogonal sample design scheme (OSD) approach in our previous work [48-53]. The brief description of the OSD approach by Noda in his recent review [43] is given as follows: The basic concept of OSD is to use a well-designed set of concentration series for two different constituents in solution mixtures, such that patterns of concentration variations of the two species will become mathematically orthogonal to each other. The imposed orthogonality will break down when
RSC
Advances
Accepted
the apparent deviation from the Beers–Lambert law, often associated with the presence of specific intermolecular interactions, is observed. Thus, the OSD technique becomes a very sensitive probe for the possible presence of specific molecular interactions. It should also be pointed out that OSD may be viewed as a form of multiple perturbation 2D correlation method, since two separate concentration variations are simultaneously imposed as perturbations. The unique feature of OSD is to proactively design the selective perturbation conditions to maximize the information content of the resulting 2D correlation spectra.
Following this original idea, we have introduced asynchronous orthogonal sample design (AOSD) [54-56], double orthogonal sample design (DOSD)[57] and double asynchronous orthogonal sample design (DAOSD)
[58-66]
scheme to further enhance the ability of 2D correlation spectroscopy to reveal spectral variations on the characteristic peaks of solutes caused by intermolecular interactions.
The chemical systems applicable for the OSD and related approaches are solutions containing two solutes (P and Q). The spectral coordinate of a characteristic peak from P is given by vP, and that from Q is vQ.
Cross-peaks around (vP, vQ) in the 2D correlation spectrum are used to
reflect intermolecular interactions between P and Q. That is to say, both P and Q possessing characteristic peaks is the prerequisite to apply OSD and relevant techniques to probe intermolecular interactions between P and Q. In many cases, however, only one solute possesses characteristic peak,
RSC
Advances
Accepted
while another solute does not have any characteristic peak within the observed spectral region. Consequently, the OSD and related approaches cannot be used directly to probe intermolecular interactions between two solutes in these chemical systems.
In our recent paper [67], we developed a new approach to probe intermolecular interactions between P and Q dissolved in the same solutions. In the system, only P possesses a characteristic peak at spectral coordinate vP, while Q does not possess any characteristic peak. Based on
mathematical analysis, computer simulation and experiments on a real chemical system, we demonstrated that cross peaks around the spectral coordinate (vP, vP) in asynchronous correlation spectra can also be used to
reflect intermolecular interactions between P and Q. Moreover, the patterns of cross peaks around the coordinate (vP, vP) can be used to reveal subtle
variations on peak position and bandwidth of the characteristic peak of P caused by intermolecular interactions. Unfortunately, variations on absorptivity of the characteristic peak of P cannot be reflected by the pattern of cross peaks around the coordinate (vP, vP).
The fact that the patterns of cross peaks fail to reflect variation of absorptivity brings about the following two problems: (1) The failure prevents us from obtaining comprehensive information on the spectroscopic behavior of the characteristic peak of P under intermolecular interactions. (2) The inability to reflect variation of absorptivity makes the approach under the risk of making incorrect conclusion concerning whether
RSC
Advances
Accepted
intermolecular interactions occur or not in some special cases. If intermolecular interactions only bring about changes on the absorptivity of the characteristic peak of P, no cross peaks can be observed around the coordinate (vP, vP) in the asynchronous correlation spectrum.
In order to solve this problem, a new method called “asynchronous spectrum with auxiliary peaks” (ASAP) approach, is proposed. In the ASAP approach, a virtual substance (denoted as S) with an isolated characteristic peak at coordinate vS is introduced. The cross peaks around
(vS, vP) and (vS, vQ) are called auxiliary cross peaks. Mathematical analysis,
computer simulation and experiment on a real chemical system were carried out. The results demonstrate that variations on absorptivity of characteristic peak of P can be reflected by the auxiliary cross peaks around (vS, vP) when only P possesses characteristic peak.
2. Experimental
2.1 Description of the model system used in the ASAP approach.
The chemical system considered here consists of n solutions containing two solutes (P and Q). Variable concentrations are used as an external perturbation to construct 2D asynchronous correlation spectra. In addition, a virtual solute denoted as S is also introduced in association with each solution. The initial concentrations of P, Q and S are denoted as:
RSC
Advances
Accepted
1(init ) P 2(init ) P
P (init ) P (init ) P C C C C i n = C r M M (1a) 1(init ) Q 2(init ) Q
Q (init ) Q (init ) Q C C C C i n = C r M M (1b) 1(init ) S 2(init ) S
S (init ) S (init ) S C C C C i n = C r M M (1c) (init ) P Ci
, CQi(init ) and (init ) S
Ci are the initial concentrations of P, Q and S in the
ith solution.
When there are intermolecular interactions between P and Q, part of P undergoes subtle structural variation and converts to U and part of Q converts to V. This inter-conversion can be expressed by the following equilibrium where K is the equilibrium constant. The so-called solute S is a virtual substance, and it does not interact with either P or Q.
P + Q← →K U + V (2)
For the ith solution, the corresponding spectrum is given by Eq. 3.
P P Q Q U U V V S S
(eq) (eq) (eq) (eq) (eq)
A ( ) f ( )Ci ν = ν i +f ( )Cν i +f ( )Cν i +f ( )Cν i +f ( )Cν i (3)
where v is the wavelength. fP(v), fQ(v), fU(v), fV(v) and fS(v) are the spectral
RSC
Advances
Accepted
functions of P, Q, U. V and S. CiP(eq), Q
(eq)
Ci , CiU(eq), CiV(eq) and CiS(eq)are the equilibrium concentrations of P, Q, U, V and S in the ith solution. The path length is set as 1 for convenience.
For each of P, Q, U, V and S, the spectral function is a single peak function that is represented by a Gaussian function as shown in Eq. 4.
2 2 ( ) ln 2 ( ) ) f ( j j v v w
j v εjgj v εje
− −
= = (4)
where j is the index of the five chemical species, i.e., P, Q, U, V and S. εj, vj,
and wj are the corresponding molar absorptivity, peak position and
bandwidth (half-width at half-height, HWHH) of the characteristic band of the jth chemical species. gj(ν) is the peak shape function.
Since S does not interact with other solutes, we have:
S S
(init) (eq)
Ci =Ci (5)
Based on Eq. 2, the following two expressions can be obtained.
P P U
(eq) (init) (eq)
Ci =Ci −Ci (6a)
V
Q Q
(eq) (init) (eq)
Ci =Ci −Ci (6b)
Thus, Eq. 3 also can be expressed as:
P U P
V
Q Q S
P U
V
Q S
(in it) (eq )
(in it) (eq ) (in it)
A ( ) f ( ) [f ( ) f ( )]
f ( ) + [ f ( ) f ( )] f ( )
C C
C C C
i i i
i i i
ν ν ν ν
ν ν ν ν
= + −
+ − + (7)
After removing the average value over all solution samples at each wavelength, dynamic spectrum of the ith solution can be expressed as Eq. 8.
(init) (eq)
P P U P U
(init) (eq) (init)
V V
Q Q Q S S
A ( ) f ( ) C [ f ( ) f ( )] C
f ( ) C +[ f ( ) f ( )] C f ( ) C
i i i
i i i
ν ν ν ν
ν ν ν ν
= + −
+ − +
% % %
% % % (8)
where
RSC
Advances
Accepted
(init) (init ) init (av)
P P P
C%i =Ci −C (9a)
(init) (init ) init ( av )
Q Q Q
C%i =Ci −C (9b)
(eq) ( eq ) eq ( av )
U U U
C%i =Ci −C
(9c)
(eq) ( eq ) eq ( av )
V V V
C%i = Ci −C
(9d)
(init) (init ) init ( av )
S S S
C%i =Ci −C (9e)
(init) P
C%i
, (init) Q
C%i and (init) S
C%i are the dynamic initial concentrations of P, Q and S in the ith solution. (e q )
U
C%i and (e q ) V
C%i are the dynamic equilibrium
concentrations of U and V in the ithsolution.
init (av) (init)
P P
1 1
C = C
n i i
n
∑
= (10a)init (av) (init)
Q Q
1 1
C = C
n i i
n
∑
= (10b)eq(av) (eq)
U U
1 1
C = C
n i i
n
∑
= (10c)eq(av) (eq)
V V
1 1
C = C
n i i
n
∑
= (10d)init (av) (init)
S S
1 1
C = C
n i i
n
∑
= (10e)Asynchronous correlation spectrum can be constructed based on Eq. 8 and Eq. 11
T
1 2 1 2
1
( , ) ( ) ( )
1 n
ν ν ν ν
Ψ =
− A NA
r r
% %
(11) where A( )ν1
r
% and
2 (ν ) A
r
% are the dynamic spectral vector ( )ν
A
r
% at the spectral coordination v1 and v2, respectively.
In the computer simulation on the model system, the simulated 1D spectra were generated via a program written in our lab with the MATLAB
RSC
Advances
Accepted
software. All asynchronous correlation spectra were calculated based on the algorithm by Noda[30] using the software of MATLAB.
2.2 Experiment on a real chemical system
2.2.1. Materials
Benzo-15-crown-5 (98%) was purchased from Aladdin. Lithium chloride and methanol were of AR grade and purchased from Beijing Chemical Company.
2.2.2. Instrument
FT-IR spectra were collected on a Thermo-Fischer Nicolet 6700 spectrometer by using a pair of BaF2 cell with a fix spacing (100 µm). All
the spectra were recorded at a resolution of 2 cm-1and 32 scans were co-added.
3. Results and Discussion
Scheme 1 illustrates the 1D spectra used in constructing asynchronous correlation spectrum. Since S is a virtual substance, the characteristic peak of S appears in gray lines. In principle, the molar absorptivity, peak position and bandwidth of the characteristic peak of S can be arbitrary. In experiment, the peak of S is not overlapped with the characteristic peaks of P and Q.
The cross peaks in asynchronous correlation spectrum based on the ASAP approach can be divided into three spectral domains, as shown in
Scheme 2. Domain I contains the cross peaks around the spectral
RSC
Advances
Accepted
coordinates (νP, νP), (νQ, νQ), (νP, νQ) and (νQ, νP). These cross peaks are
conventional cross peaks in asynchronous correlation spectrum. Cross peaks located around (νS, νP) and (νS, νQ) in domain II and cross peaks
around (νP, νS) and (νQ, νS) in domain III are auxiliary cross peaks.
According to the basic properties of asynchronous correlation spectra, the auxiliary cross peaks in domain III are anti-symmetric to these in domain II with respect to diagonal. Thus, we focus on the auxiliary cross peaks in domain II in the following part.
3.1 Basic properties of the ASAP approach.
It is assumed S does not interact with P or Q since it is a virtual substance. We try to use the auxiliary cross peaks around (vS, vP) and (vS, vQ)
to reflect intermolecular interactions between P and Q. In an ideal asynchronous correlation spectrum generated by using the ASAP approach, the auxiliary cross peaks should possess the following two properties: (I): No auxiliary cross peak could be produced around (νS, νP) and (νS, νQ)
when there are no intermolecular interactions between P and Q. (II): When intermolecular interactions occur between P and Q, auxiliary cross peaks around (νS, νP) or (νS, νQ) should be present. Moreover, the variations of
spectral function caused by the conversion from P to U and from Q to V can be manifested by the auxiliary cross peaks around (νS, νP) or (νS, νQ).
To achieve the above goals, mathematical analysis on the auxiliary cross peaks around (νS, νP) or (νS, νQ) is carried out. Herein, ν1 is in the
spectral region of the characteristic peak of S, while ν2 is in the spectral
RSC
Advances
Accepted
region of the characteristic peak of P, Q, U and V. Ψ(ν1, ν2) is calculated by
combining Eq. 8 and Eq. 11 and its expression can be expressed as Eq. 12. The expressions of the twenty-five terms in Eq. 12 are given in the appendix.
25
1 2 1 2
1
( , ) 1 R ( , )
1i i n
ν ν ν ν
=
Ψ =
−
∑
(12)Since the characteristic peak of S is intentionally set not to overlap with characteristic peaks of P, Q, U, V, we have:
fP(ν1)=0 fQ(ν1)=0 fU(ν1)=0 fV(ν1)=0 fS(ν1)≠0
fP(ν2)≠0 fQ(ν2)≠0 fU(ν2)≠0 fV(ν2)≠0 fS(ν2)=0
(13)
Based on Eq. 13, the values of R1~R20 and R25 in Eq. 12 are all zero, thus
only four terms R21~ R24 are left.
When there are no intermolecular interactions between P and Q, equilibrium concentrations of U and V which are the products of intermolecular interactions between P and Q, should be zero. Thus we have: eq U eq V 0 0 = = C C r % r % (14)
According to Eq. 14, the value of R23 and R24 are zero when there are no
intermolecular interactions between P and Q.
23 S U P
24 S V Q
init T eq U
1 2 1 2 2 S
init T eq V
1 2 1 2 2 S
( ) f ( )[ f ( ) f ( )][ [
( ) f ( )[ f ( ) f ( )][ [
R , ] ] 0
R , ] ] 0
ν ν ν ν ν
ν ν ν ν ν
− − = = = = C C C C N N r r % % r r
% % (15)
The corresponding Ψ(ν1, ν2) changes into Eq. 16.
1 2 21 1 2 22 1 2
( , ) 1 (R ( , ) R ( , ))
1
n
ν ν ν ν ν ν
Ψ = +
− (16)
RSC
Advances
Accepted
Since no intermolecular interactions occur between P and Q, Ψ(ν1, ν2)
should be zero. To make Ψ(ν1, ν2) be zero, a feasible way is to make both
R21(ν1,ν2) and R22(ν1,ν2) be zero. This can be achieved by setting the initial
concentrations of S to be linearly proportional to the initial concentrations of P and Q simultaneously (Eq. 17). Mathematical analysis to support this statement is given in detail in the Appendix.
where a , b , c, m, h and d are preset constants.
Thus, the property I is achieved if the concentration series of P, Q and S satisfy Eq. 17a and 17b. That is to say, no auxiliary cross peaks are produced around (νS, νP) and (νS, νQ) when there are no intermolecular
interactions between P and Q.
By selecting the concentration series P, Q and S based on Eq. 17, the auxiliary cross peaks can be expressed as Eq. 18 for the chemical system where intermolecular interactions occur between P and Q.
S U P S V Q
1 2 23 1 2 24 1 2
init T eq init T eq
1 2 2 S U 1 2 2 S V
( , ) , ,
f ( )[ f ( ) f ( )][ [ f ( )[ f ( ) f ( )][ [
1
(R ( ) R ( ))
1 1
( ] ] ] ])
1 n
n
ν ν ν ν ν ν
ν ν ν ν ν ν
Ψ =
− −
+ −
= +
− C NC C NC
r r r r
% % % %
(18)
According to Eq. 4, Eq. 18 changes into Eq. 19
( init) ( init )
S Q
C i C i
a +b =c (17a)
(init) (init )
S P
C i C i
m +h =d (17b)
RSC
Advances
Accepted
eq T init eq T init S U 2 P 2 U S S V 2 Q 2 V S
eq T init eq T init
S 2 2 U S S 2 2 V S
1 2 1 1
1 U U P P 1 V V Q Q
1
( , ) { f ( )[ f ( ) f ( )] ] [ ] f ( )[ f ( ) f ( )] ] [ ]} 1
1
{ f ( )[ ] ] [ ] f ( )[ ] ] [ ]}
1 1 ( ) ( ) ( ) ( ) n n n
g g g g
ν ν ν ν ν ν ν ν
ν ε ν ε ν ν ε ν ε ν
Ψ − + −
− − + − − − = = =
[C N C [C N C
[C N C [C N C
r r r r
% % % %
r r r r
% % % %
eq T init
S 2 2 U S
eq T init
S 2 2 V S
T
1 U U U P 2 U P 2 P P
1 V V V Q 2 V Q 2 Q Q
eq init
U S 1 U 2 P 2 U S U P S 1 P 2
{ f ( )[ ( ) ( ) ] ] [ ]
1
f ( )[ ( ) ( ) ] ] [ ]}
1 1
f ( ) ( ) ( )) ] ) f ( ) ( )
1 1 ( ) ( ) ( ) ( ) ( ( g g g g
g g g
n n
g g
g g
ν ν ε ν ε ν ν
ν ν ε ν ε ν ν
ε ν ν ν ε ε ν ν
ε ε ε ε − + − + − + − − + − − − =
[C N C [C N C [C NC r r % % r r % % r r
% % T
eq T init eq T init
V S V S
eq init
U S
V S 1 V 2 Q 2 V Q S 1 Q 2
]
1 1
f ( ) ( ) ( )) ] [ ] - ) f ( ) ( ) ] [ ]
1 1
(g g ( g
n ε ν ν ν n ε ε ν ν
− +
− −
+
[C NC
[C N C [C N C
r r % %
r r r r
% % % %
(19)
Eq. 19 can be expressed as a summation of four parts. The first term contains gU( )ν1 −gP( )ν1 . That is to say, it reflects variations of bandwidth and
peak position of P. The second term contains (ε εV- Q), demonstrating that it
is relevant to the variations of absorptivity of P. Similarly, the third term reflects the variations of bandwidth, peak position of Q and the forth term is relevant to the variation of absorptivity of Q. Thus, the auxiliary cross peaks in the ASAP approach do reflect the variation of spectral function of P and Q caused by intermolecular interaction. Therefore, the property II of auxiliary cross peak is also achieved.
3.2 The application of the ASAP approach in reflecting the variation of absorptivity when only one substance involving intermolecular interactions possesses characteristic peak.
Equipped with the ASAP approach, we try to establish a method to reveal the variation of absorptivity of P when Q does not possess any characteristic peak in the spectral region.
Considering a chemical system where P possesses a characteristic peak at νP but Q has no characteristic peak. We have proved that cross
peaks around the coordinate (νP, νP) near the main diagonal in an
RSC
Advances
Accepted
asynchronous correlation spectrum can be used to characterize the intermolecular interactions between P and Q. In our previous work[68], we demonstrated that the cross peaks around the coordinate (νP, νP) can be
expressed as Eq. 20.
1 2
1
, (H ( , ) H ( , ))
1
(x y) x y x y
n− +
Ψ =
init T eq
1 P U P P U
eq T init
2 P U P U P
H ( , ) f ( )[f ( ) f ( )]( ) H ( , ) f ( )[f ( ) f ( )]( )
x y x y y
x y y x x
= −
= −
C NC
C NC
(20)
where x and y are in a spectral region around νP.
Based on the mathematical property of the Hilbert-Noda transformation matrix N listed in Eq. 21, H1(x, y) and H2(x, y) can be combined into one
term.
T T
= −
A NB B NA
ur ur ur ur
(21) where A
ur
and B
ur
can be arbitrary n-dimensional vectors. Eq. 20 can be expressed as Eq. 22.
1 init T eq
P U P U P U P U
1
( , )
x y
n− ε ε [g ( )x
g ( )y
g ( )y
g ( )](x
)Ψ
=
− C NCr r
% % (22)
As shown in Eq. 22, the pattern of cross peaks around (νP1, νP2) can reflect
the variations of g(v) that are relevant to peak position and bandwidth. Although the variation of absorptivity is related with the intensity of cross peak, it is hard to retrieve the information on the variations of absorptivity from the intensity of cross peak, since the intensity of cross peak is affected by a variety of factors. These factors are difficulty to be measured accurately.
To solve the problem, the ASAP approach is adopted, and we try to
RSC
Advances
Accepted
obtain the variation of the absorptivity of the characteristic peak of P from the auxiliary cross peak. Since both Q and V do not show any characteristic peak, we have fQ(ν1)=0 and fv(ν1)=0. Thus, the R24 term in Eq. 18 is zero.
Consequently, the auxiliary cross peaks can be expressed as Eq. 23.
T
T
T eq init
1 2 S 1 U 2 P 2 U S
eq init S 1 U U 2 P P 2 U S
eq init S 1 U U 2 U P 2 U P 2 P P 2 U S
e U S 1 U 2 P 2 U
1
( , ) f ( )[ f ( ) f ( )] ] 1
1
f ( )[ ( ) ( )] ]
1 1
f ( )[ ( ) ( ) ( ) ( )] ]
1 1
f ( ) ( ) ( ))
1 (
n
g g
n
g g g g
n
g g
n
ν ν ν ν ν
ν ε ν ε ν
ν ε ν ε ν ε ν ε ν
ε ν ν ν
Ψ = −
− = − − = − + − − = − − [C NC [C NC [C NC [C r r % % r r % % r r % % r
% q T init eq T init
S U P S 1 P 2 U S
1
] ) f ( ) ( ) ]
1(
g
n ε ε ν ν
+ −
−
NC [C NC
r r r
% % %
(23)
As shown in Eq. 23, the auxiliary cross peak is composed of two parts. We notice that the second part contains (εU-εP) term, which reflects the
variation of absorptivity of characteristic peak of P under intermolecular interactions. Therefore, the problem that variation of absorptivity of characteristic peak of P cannot be reflected when Q does not possess any characteristic peak is addressed by using the ASAP approach. Information on the variation of absorptivity can be retrieved from the pattern of auxiliary cross peak around (vS, vP).
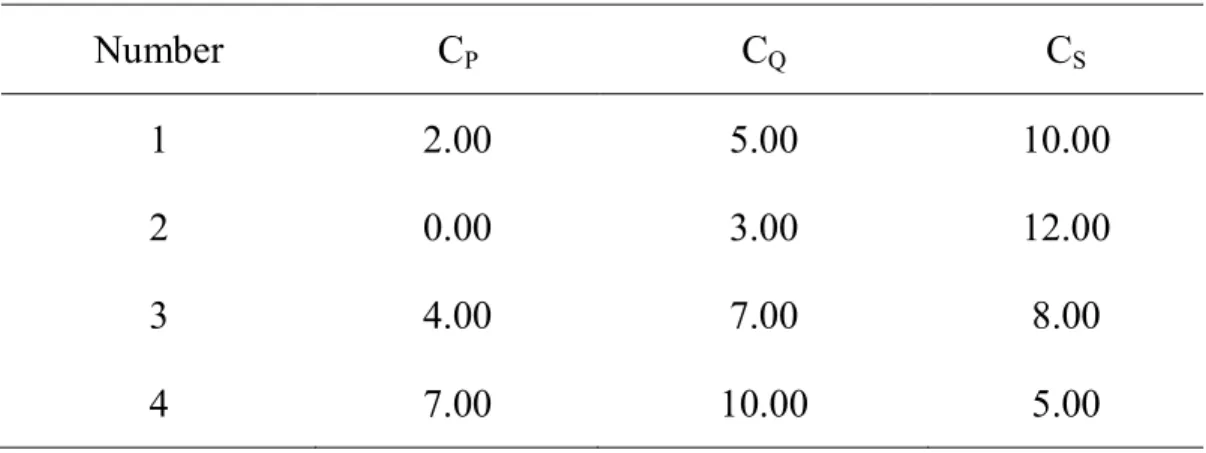
First, we carry out computer simulation on a model chemical system to show how variation of absorptivity can be obtained by using the ASAP approach. In this simulated system, intermolecular interactions between P and Q only cause the variation of absorptivity of P, and the corresponding
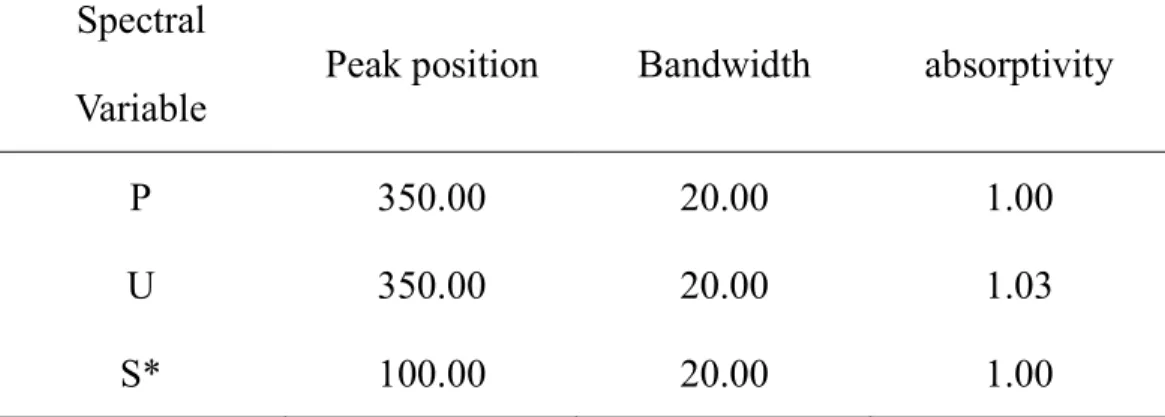
K value is arbitrarily set as 0.01 here. The spectral parameters of P, U and S are given in Table 1. The concentrations of P, Q and S are listed in Table 2.
RSC
Advances
Accepted
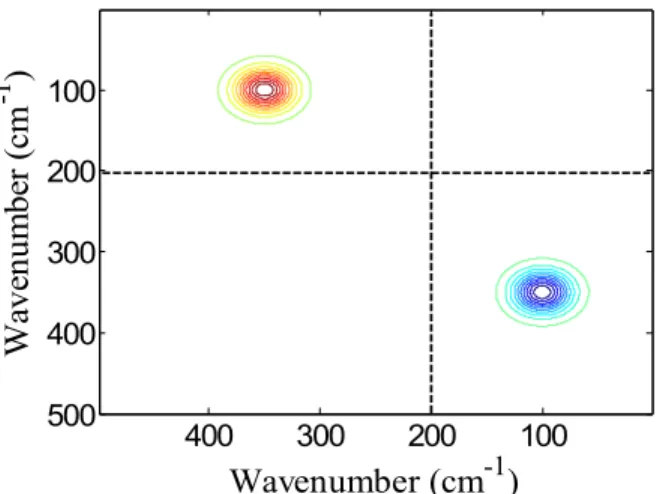
As shown in Figure 1, no cross peak in domain I is observed, indicating that variation of absorptivity of the characteristic peak of P cannot be reflected by the conventional cross peaks in asynchronous correlation spectrum. Furthermore, this result demonstrates that conventional cross peaks fail to detect intermolecular interaction between P and Q. However, a single auxiliary cross peak can be clearly observed around (100, 350) in domain II of Figure 1. This result demonstrates that intermolecular interactions between P and Q can be manifested by the present of auxiliary cross peak. Moreover, the pattern of auxiliary cross peak is also helpful to reveal the variation of absorptivity. As shown in domain I of Figure 1, no cross peak around (350, 350) is observable, indicating intermolecular interactions do not produce variations on either peak position or bandwidth of the characteristic peak of P. Thus, the first term in Eq. 23 is zero and the second term relevant to the variation of absorptivity is left. According to Eq. 23, the second term will produce a single auxiliary cross peak. As shown in domain II of Figure 1, a single auxiliary cross peak is observed, confirming that variation of absorptivity is revealed.
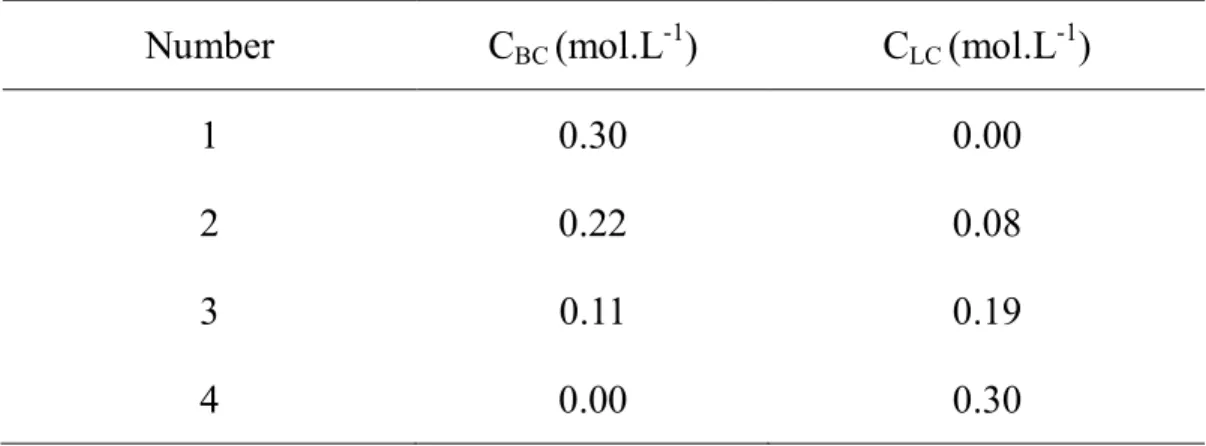
Then we apply the ASAP approach on a real chemical system. In the real chemical system, coordination between Li+ and benzo-15-crown-5 is probed. First a series of methanol solutions containing lithium chloride (denoted as LC) and benzo-15-crown-5(denoted as BC) were prepared. The concentrations of benzo-15-crown-5 and lithium chloride are listed in
RSC
Advances
Accepted
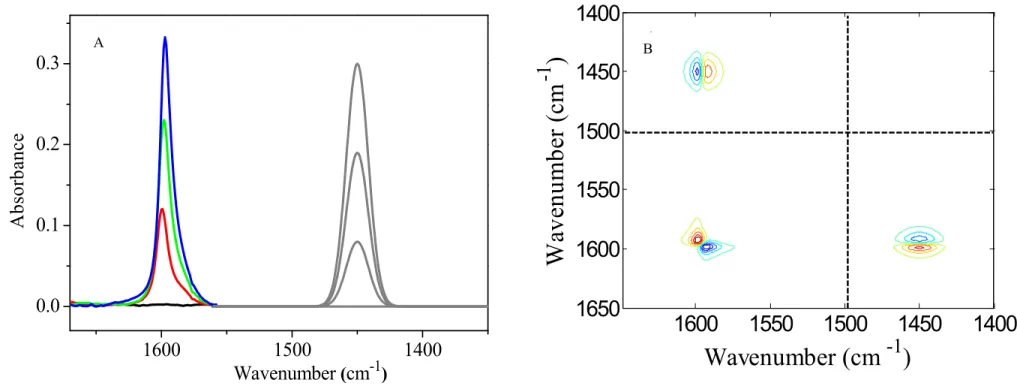
Table 3. The concentration of S in the four solutions listed in Table 3 is 0.00, 0.08, 0.19 and 0.30 mol.L-1 respectively. The peak position, bandwidth and absorptivity of the characteristic peak of virtual substance(S) is set to be 1450.00, 10.00 and 1.00 respectively. FT-IR spectra of the solutions were recorded and shown in Figure 2a. The band located around 1597 cm-1 is assigned to vibration of skeleton of the aromatic ring and used as a characteristic peak of benzo-15-crown-5. In the FTIR spectra, spectral data below 1500cm-1 is truncated and spectra of a virtual substance S are put in the spectral region between 1500 and 1400 cm-1. The peaks shown in gray refer to the virtual substance S. Li+ does not exhibit any absorption peak in FTIR spectrum. The asynchronous correlation spectrum based on the ASAP approach is constructed by using the 1D spectra of Figure 2a
and shown in Figure 2b. A pair of cross peaks in domain I can be clearly observed in Figure 2b.
According to our previous work[48-67], the following experiment is performed: Benzo-15-crown-5 is dissolved in methanol alone. Good linear relationship between the absorbance of the 1597cm-1 band and the concentration of benzo-15-crown-5 can be obtained when the concentration range of benzo-15-crown-5 is between 0.00 mol.L-1 and 0.30 mol.L-1 (supporting information). Since the concentrations of benzo-15-crown-5 listed in Table 3 are within the above concentration range, the possibility that the conventional cross peaks in domain I of Figure 2b are caused by interaction between benzo-15-crown-5 and methanol can be safely
RSC
Advances
Accepted
precluded. That is to say, it is the coordination between Li+ and benzo-15-crown-5 that brings about the structural variation on the aromatic ring and produces the cross peaks in the corresponding asynchronous correlation spectrum. This spectral pattern suggests that coordination between Li+ and benzo-15-crown-5 brings about blue shift on the 1597cm-1 band. The result obtained from the conventional cross peak in domain I is consistent with that shown in Figure 2a.
However, whether the absorptivity of the 1597cm-1 band varies or not remains unknown. Herein the auxiliary cross peak around (1450, 1597) in domain II is used to check whether the intermolecular interactions between benzo-15-crown-5 and Li+ cause the variation of absorptivity besides peak position. According to 1D spectra in Figure 2a and the conventional cross peak in domain I of Figure 2b, we learn that the interactions between benzo-15-crown-5 and Li+ make the characteristic peak of benzo-15-crown-5 undergo blue-shift (∆xU>0). In domain II, a pair of
vertical auxiliary cross peaks can be observed. One auxiliary cross peak is positive and another is negative. The spectral pattern of the auxiliary cross peak also indicates that the 1597cm-1 band undergoes a band-shift. When we examine the auxiliary cross peaks carefully, it is noticed that the absolute intensity of the positive auxiliary cross peak is slightly larger than that of the negative auxiliary cross peak. The pattern of cross peaks around the coordinate (1597, 1597) demonstrates that coordination between lithium ion and benzo-15-crown-5 cannot produce observable variation on
RSC
Advances
Accepted
the bandwidth of the 1597cm-1 peak. If coordination only brings about band-shift on the 1597cm-1 peak, the absolute intensities of the pair of the auxiliary cross peak should be the same. This is not the case in Figure 2b, suggesting that the absorptivity of the 1597cm-1 also changes as coordination occurs between benzo-15-crown-5 and lithium.
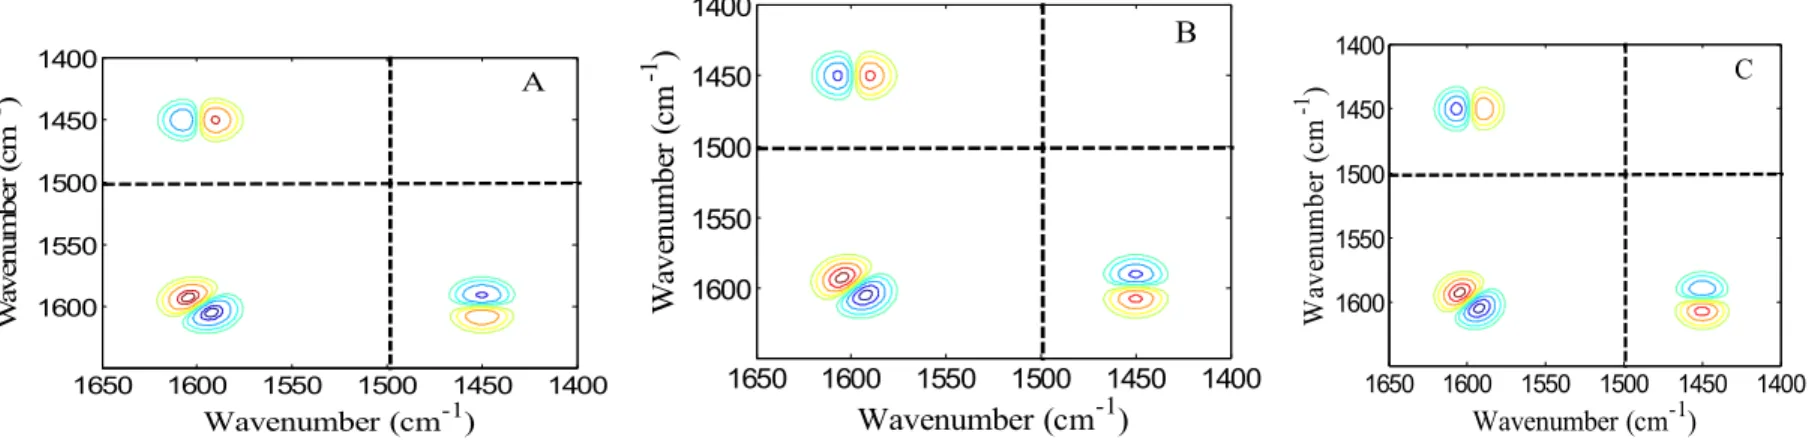
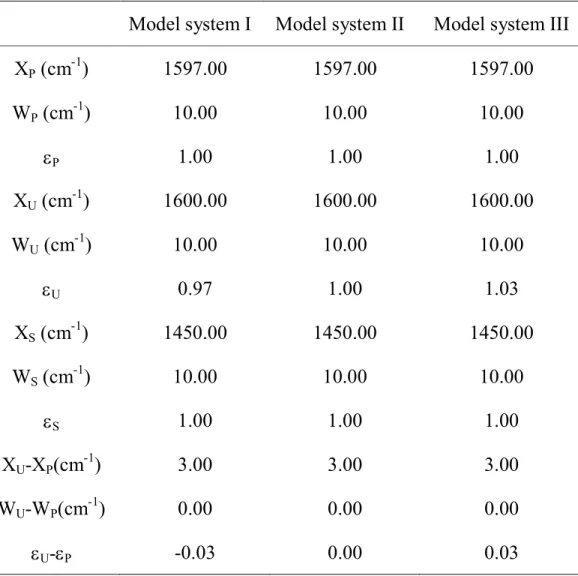
Thus, we performed computer simulation on three model systems to mimick the spectral behavior of the benzo-15-crown-5/lithium system. The peak parameters of P, U and S in the three model systems are listed in
Table 4. The corresponding 2D asynchronous spectra are shown in Figure 3. It is found that the pattern of auxiliary cross peak in Figure 2B is quite similar to that shown in Figure 3C. This result demonstrates that the absorptivity of the 1597cm-1 band also increases upon coordinating with lithium. That is to say, coordination between Li+ and benze-15-crown-5 not only makes the 1597cm-1 band undergoes a blue shift but also brings about slight increment on its absorptivity.
In summary, we propose the ASAP approach, where a virtual substance(S) is introduced into solutions containing two solutes (P and Q), as a useful technique. Under suitable concentration series, auxiliary cross peaks around (vS, vP) and (vS, vQ) can be used to reflect intermolecular
interactions between P and Q. By using the ASAP approach, variations on absorptivity of the characteristic peak of P can be retrieved when Q has no characteristic peak in the spectral region.
Acknowledgement
RSC
Advances
Accepted
This project is financially supported by the National Natural Science Foundation of China (No. 51373003, 51074150), Key Project of Chinese National Programs for Fundamental Research and Development (973 Programs No. 2012CBA01203, 2013CB632602).
References
[1] J. Yu, L. S. Bi, R. K. Kalia, P. Vashishta, Intermolecular and intramolecular phonons in solid C60 - effects of orientational disorder and pressure, Phys. Rev. B, 49 (1994) 5008-5019.
[2] S. Tsuzuki, T. Uchimaru, Magnitude and physical origin of intermolecular interactions of aromatic molecules: Recent progress of computational studies, Curr. Org. Chem., 10 (2006) 745-762.
[3] I. Nudelman, S. R. Akabayov, E. Schnur, Z. Biron, R. Levy, Y. Xu, D. Yang, J. Anglister, Intermolecular Interactions in a 44 kDa Interferon-receptor complex detected by asymmetric reverse-protonation and two-dimensional NOESY, Biochemistry, 49 (2010) 5117-5133.
[4] N. Veljkovic, S. Glisic, V. Perovic, V. Veljkovic, The role of long-range intermolecular interactions in discovery of new drugs, Expert. Opin. Drug Discov., 6 (2011) 1263-1270.
[5] Y. F. Xie, Y. Y. Huang, W. Z. Wang, G. Q. Liu, R. Zhao, Dynamic interaction between melamine and cyanuric acid in artificial urine investigated by quartz crystal microbalance, Analyst, 136 (2011) 2482-2488.
RSC
Advances
Accepted
[6] M. Maniruzzaman, D. J. Morgan, A. P. Mendham, J. Pang, M. J. Snowden, D. Douroumis, Drug-polymer intermolecular interactions in hot-melt extruded solid dispersions, Int. J. Pharm., 443 (2013) 199-208.
[7] K. Ruanjaikaen, A. L. Zydney, Intermolecular interactions during ultrafiltration of pegylated proteins, Biotechnol. Prog., 29 (2013) 655-663.
[8] H. Wang, N. Chen, Q. Wang, Interaction between β-tricalcium phosphate and Poly(vinyl alcohol) and its effect on the thermal and mechanical properties of Poly(vinyl alcohol), Chem. J. Chinese U., 35 (2014) 1810-1815.
[9] X. F. Zhang, L. Chen, Q. F. Yang, X. R. Sun, H. B. Chen, G. Yang, Y. L. Tang, Investigation on the cyanine dyes supramolecular assembly and chiral inducement by fulvic acid, Spectrosc. Spectr. Anal., 34 (2014) 3045-3050.
[10] F. Sakai, Z. W. Ji, J. H. Liu, G. S. Chen, M. Jiang, A novel supramolecular graft copolymer via cucurbit 8 uril-based complexation and its self-assembly, Chin. Chem. Lett., 24 (2013) 568-572.
[11] N. Fatkullin, A. Gubaidullin, C. Mattea, S. Stapf, On the theory of the proton free induction decay and Hahn echo in polymer systems: The role of intermolecular magnetic dipole-dipole interactions and the modified Anderson-Weiss approximation, J. Chem. Phys., 137 (2012).
RSC
Advances
Accepted
[12] J. A. Molina-Bolivar, F. Galisteo-Gonzalez, C. Carnero Ruiz, M. Medina-O' Donnell, A. Parra, Spectroscopic investigation on the interaction of maslinic acid with bovine serum albumin, J. Lumines., 156 (2014) 141-149.
[13] A. E. Reed, L. A. Curtiss, F. Weinhold, Intermolecular interactions from a natural bond orbital, donor-acceptor viewpoint, Chem. Rev., 88 (1988) 899-926.
[14] E. A. Meyer, R. K. Castellano, F. Diederich, Interactions with aromatic rings in chemical and biological recognition, Angew. Chem. Int. Ed., 42 (2003) 1210-1250.
[15] M. Aoudia, T. Al-Maamari, F. Al-Salmi, Intramolecular and intermolecular ion-dipole interactions in sodium lauryl ether sulfates (SLES) self-aggregation and mixed micellization with Triton X-100, Colloids Surf., A, 335 (2009) 55-61.
[16] J. S. Li, An ab initio study of intermolecular interaction of hydrogen fluoride tetramer, J. Theo. Comp. Chem., 5 (2006) 187-196.
[17] J. Liu, S. X. Liu, Y. L. Gao, X . K. Fan, Y. Guan, S. F. Weng, Z. L. Yang, Y. Z. Xu, J. G. Wu, On the interaction between PVP and europium benzenesulfonate, Spectrosc. Spectr. Anal., 33 (2013) 1487-1490.
[18] S. R. Wu, B. Jin, N. Zhang, Y. Liu, X. J. Liu, S. Q. Li, L. H. Shanggan, New monomethine cyanine dye and its interaction with different DNA forms, Chem. J. Chinese U., 35 (2014) 2085-2092.
RSC
Advances
Accepted
[19] T. Madrakian, S. Heidari, Interaction of benzene-1,3- disulfonylamid-kriptofix 22 with iodine in chloroform and dichloromethane solutions, Chin. Chem. Lett. 25 (2014) 1375-1378. [20] J. Sun, J. S. Yu, S. Jin, X. Zha, Y. Q. Wu, Z. W. Yu, Interaction of
synthetic HPV-16 capsid peptides with heparin: thermodynamic parameters and binding mechanism, J. Phys. Chem. B, 114 (2010) 9854-9861.
[21] Q. Z. Li, N. N. Wang, Z. W. Yu, Solvent effect on the role of methyl groups in formation of O···HO hydrogen bond in dimethyl ether– methanol complex, J. Mol. Stru.: THEOCHEM, 862 (2008) 74-79. [22] R. Wang, Q. Z. Li, R. G. Wu, G. S. Wu, Z. W. Yu, Molecular
interactions between pyrazine and n-propanol, chloroform, or tetrahydrofuran, Spectrochim. Acta, Part A, 70 (2008) 793-798.
[23] Carsten Schmuck and Johann Lex., C2H•••O Interactions as
Isofunctional Replacements for N2H•••O Interactions 2 Dimer
Formation of Methyl 5-Amidopyrrole- 2- carboxylates in the Solid State. Eur. J. Org. Chem. 2001(2001), 1519-1523.
[24] Mihaela Roman, Caroline Cannizzo, Thomas Pinault, Benjamin Isare, Bruno Andrioletti, Paul van der Schoot, and Laurent Bouteiller. Supramolecular Balance: Using Cooperativity to Amplify Weak Interactions. J. AM. CHEM. SOC. 2010, 132, 16818–16824.
[25] Klaus Müller, Christoph Faeh, François Diederich, Fluorine in Pharmaceuticals: Looking Beyond Intuition. Science, 2007, 317,
RSC
Advances
Accepted
1881-1886.
[26] Eugene Shakhnovich, Protein Folding Thermodynamics and Dynamics: Where Physics, Chemistry, and Biology Meet, Chem. Rev. 2006, 106, 1559-1588.
[27] I. Noda, Two-dimensional infrared-spectroscopy, J. Am. Chem. Soc., 111 (1989) 8116-8118.
[28] I. Noda, 2-Dimensional infrared (2D IR) spectroscopy - theory and applications, Appl. Spectrosc., 44 (1990) 550-561.
[29] I. Noda, Generalized 2-dimensional correlation method applicable to infrared, Raman, and other types of spectroscopy, Appl. Spectrosc., 47 (1993) 1329-1336.
[30] I. Noda. ‘‘Determination of Two-Dimensional Correlation Spectra Using the Hilbert Transform’’. Appl. Spectrosc., 54(2000) 994-999. [31] D. L. Elmore, R. A. Dluhy, beta nu-correlation analysis: A modified
two-dimensional infrared correlation method for determining relative rates of intensity change, J. Phys. Chem. B, 105 (2001) 11377-11386. [32] S. Shanmukh, R. A. Dluhy, kv Correlation analysis. A quantitative
two-dimensional IR correlation method for analysis of rate processes with exponential functions, J. Phys. Chem. A, 108 (2004) 5625-5634. [33] R. Dluhy, S. Shanmukh, S. I. Morita, The application of
two-dimensional correlation spectroscopy to surface and interfacial analysis, Surf. Interface Anal., 38 (2006) 1481-1496.
[34] S. I. Morita, S. Shanmukh, Y. Ozaki, R. A. Dluhy, A general
RSC
Advances
Accepted
model-based approach to two-dimensional infrared correlation spectroscopy incorporating the global phase angle, Appl. Spectrosc., 60 (2006) 1279-1284.
[35] D. Pivonka, Vibrational analysis of structure activity relationships (SAR) in molecular binding, Appl. Spectrosc., 58 (2004) 323-331. [36] S. Morita, H. Shinzawa, I. Noda, Y.Ozaki, Perturbation-correlation
moving-window two-dimensional correlation spectroscopy, Appl. Spectrosc., 60 (2006) 398-406.
[37] H. Shinzawa, K. Awa, I. Noda, Y. Ozaki, Multiple-perturbation two-dimensional near-infrared correlation study of time-dependent water absorption behavior of cellulose affected by pressure, Appl. Spectrosc., 67 (2013) 163-170.
[38] H. Shinzawa, I. Noda, Two-dimensional infrared (2D IR) correlation spectroscopy study of self-assembly of oleic acid (OA) in conjunction with partial attenuation of dominant factor by eigenvalue manipulating transformation (EMT), Vib. Spectrosc., 60 (2012) 180-184.
[39] H. Park, H. S. Kim, Y. M. Jung, Interionic interactions of binary gels consisting of pyrrolidinium-based zwitterionic compounds and lithium salts, J. Phys. Chem. B, 115 (2011) 1743-1750.
[40] H. J. Kim, S. B. Kim, J. K. Kim, Y. M. Jung, Two-dimensional heterospectral correlation analysis of wide-angle X-ray scattering and infrared spectroscopy for specific chemical interactions in weakly interacting block copolymers, J. Phys. Chem. B, 110 (2006)
RSC
Advances
Accepted
23123-23129.
[41] H. Lee, Y. M. Jung, K. I. Lee, H. S. Kim, H. S. Park, Understanding the unique interaction of amine-containing ionic compounds with SO2 for high absorption capacity, RSC Adv., 3 (2013) 25944-25949.
[42] Z. W. Yu, L. Chen, S. Q. Sun, I. Noda, Determination of selective molecular interactions using two-dimensional correlation FT-IR spectroscopy, J. Phys. Chem. A, 106 (2002) 6683-6687.
[43] Isao Noda, Frontiers of Two-Dimensional Correlation Spectroscopy. Part 1. New concepts and noteworthy developments. J. Mol. Struct., 1069 (2014) 3-22.
[44] I. Noda, Frontiers of two-dimensional correlation spectroscopy. Part 2. Perturbation methods, fields of applications, and types of analytical probes, J. Mol. Struct., 1069 (2014) 23-49.
[45] C. Li, J. W. Liu, J. J. Li, F. Shen, Q. S. Huang, H. X. Xu, Studies of 4,4 '-diphenylmethane diisocyanate (MDI)/1,4-butanediol (BDO) based TPUs by in situ and moving-window two-dimensional correlation infrared spectroscopy: Understanding of multiple DSC endotherms from intermolecular interactions and motions level, Polymer, 53 (2012) 5423-5435.
[46] A. Awichi, E. M. Tee, G. Srikanthan, and W. Zhao, Identification of Overlapped Near-Infrared Bands of Glucose Anomers Using Two-Dimensional Near-Infrared and Middle-Infrared Correlation Spectroscopy, Appl. Spectrosc. 56 (2002), 897.
RSC
Advances
Accepted
[47] E. M. Tee, A. Awichi, and W. Zhao, Probing Microstructure of Acetonitrile−Water Mixtures by Using Two-Dimensional Infrared Correlation Spectroscopy, J. Phys. Chem. A 106(2002), 6714-6719. [48] J. Qi, H. Z. Li, K. Huang, S. X. Liu, L. M. Yang, Y. Zhao, C. F. Zhang,
W. H. Li, J. G. Wu, D. F. Xu, Y. Z. Xu, I. Noda, Orthogonal sample design scheme for two-dimensional synchronous spectroscopy and its application in probing intermolecular interactions, Appl. Spectrosc., 61 (2007) 1359-1365.
[49] J. Qi, K. Huang, X. X. Gao, H. Z. Li, S. X. Liu, Y. Zhao, Y. Z. Xu, J. G. Wu, I. Noda, Orthogonal sample design scheme for two-dimensional synchronous spectroscopy: Application in probing lanthanide ions interactions with organic ligands in solution mixtures, J. Mol. Struct., 883 (2008) 116-123.
[50] H. Z. Li, D. l. Tao, J. Qi, J. G. Wu, Y. Z. Xu, I. Noda, Dipole-dipole interactions in solution mixtures probed by two-dimensional synchronous spectroscopy based on orthogonal sample design scheme, Spectrochim. Acta, Part A, 124 (2014) 697-702.
[51] Y. H. Liu, C. F. Zhang, S. X. Liu, Y. Zhao, D. J. Wang, J. G. Wu, Y. Z. Xu, I. Noda, Modified orthogonal sample design scheme to probe intermolecular interactions, J. Mol. Struct., 883 (2008) 124-128.
[52] J. Chen, C. F. Zhang, H. Z. Li, Y. F. Liu, W. H. Li, Y. Z. Xu, J. G. Wu, I. Noda, Patterns of cross peaks in 2D synchronous spectrum generated by using orthogonal sample design scheme, J. Mol. Struct.
RSC
Advances
Accepted
883 (2008) 129–136.
[53] J. J. Shi, Y. H. Liu, R. Guo, X. P. Li, A. Q. He, Y. L. Gao, Y. J. Wei, C. G. Liu, Y. Zhao, Y. Z. Xu, I. Noda, J. G. Wu, Design of a New Concentration Series for the Orthogonal Sample Design Approach and Estimation the Number of Reactions in Chemical Systems, Applied Spectroscopy, DOI: 10.1366/14-07759(In press)
[54] X. P. Li, Q. Bi, S. X. Liu, J. Chen, S. J. Yue, Y. J. Wei, K. Huang, Y. Zhao, H. Z. Liu, Y. J. Zhai, Y. Z. Xu, I. Noda, J. G. Wu, Improvement of the sensitivity of the two-dimensional asynchronous spectroscopy based on the AOSD approach by using a modified reference spectrum, J. Mol. Struct., 1034 (2013) 101-111.
[55] X. P. Li, Q. H. Pan, J. Chen, S. X. Liu, A. Q. He, C. G. Liu, Y. J. Wei, K. Huang, L. M. Yang, J. Feng, Y. Zhao, Y. Z. Xu, Y. Ozaki, I. Noda, J. G.Wu, Asynchronous orthogonal sample design scheme for two-dimensional correlation spectroscopy (2D-COS) and its application in probing intermolecular interactions from overlapping infrared (IR) bands, Appl. Spectrosc., 65 (2011) 901-917.
[56] X. P. Li, S. X. Liu, J. Chen, S. J. Yue, C. G. Liu, Y. J. Wei, K. Huang, Y. Zhao, Y. Z. Xu, I. Noda, J. G. Wu, The influence of changing the sequence of concentration series on the 2D asynchronous spectroscopy generated by the asynchronous orthogonal sample design (AOSD) approach, Vib. Spectrosc., 60 (2012) 212-216.
[57] C. F. Zhang, K. Huang, H. Z. Li, J. Chen, S. X. Liu, Y. Zhao, D. J.
RSC
Advances
Accepted
Wang, Y. Z. Xu, J. G. Wu, I. Noda, Y. Ozaki, Double orthogonal sample design scheme and corresponding basic patterns in two-dimensional correlation spectra for probing subtle spectral variations caused by intermolecular interactions, J. Phys. Chem. A, 113 (2009) 12142-12156.
[58] J. Chen, Q. Bi, S. X. Liu, X. P. Li, Y. H. Liu, Y. J. Zhai, Y. Zhao, L. M. Yang, Y. Z. Xu, I. Noda, J. G. Wu, Double asynchronous orthogonal sample design scheme for probing intermolecular interactions, J. Phys. Chem. A, 116 (2012) 10904-10916.
[59] Y. L. Gao, J. Liu, Y. H. Liu, J. J. Shi, S. Weng, L. M. Yang, X. Wen, T. Kang, Y. Z. Xu, I. Noda, J. G. Wu, Characterization of the coordination between Nd3+ and ester groups by using double asynchronous orthogonal sample design approach, J. Mol. Struct., 1069 (2014) 205-210.
[60] J. Liu, Y. L. Gao, L. Zheng, D. Gao, A. Q. He, Y. H. Liu, S. Weng, Y. Zhao, Z. Yang, L. M. Yang, X. Wen, Y. Z. Xu, I. Noda, J. G. Wu, Coordination between cobalt (II) ion and carbonyl group in acetone probed by using DAOSD approach, J. Mol. Struct., 1069 (2014) 217-222.
[61] Q. Bi, J. Chen, X. P. Li, J. J. Shi, X. Wang, J. Zhang, D. Gao, Y. Zhai, Y. Zhao, S. Weng, Y. Z. Xu, I. Noda, J. G. Wu, Investigation on the dipole-dipole interactions between tetramethylurea and acetonitrile by two-dimensional asynchronous spectroscopy, J. Mol. Struct., 1069
RSC
Advances
Accepted
(2014) 264-271.
[62] Q. Bi, J. Chen, X. P. Li, J. J. Shi, R. Guo, Y. Zhai, Y. Z. Xu, I. Noda, J. G. Wu, A method based on the DAOSD approach to estimate the variation of the peak position and bandwidth caused by intermolecular interactions, J. Mol. Struct., 1069 (2014) 211-216.
[63] Y. L. Gao, D. Li, J. J. Shi, X. M. Wang, T. G. Kang, S. F. Weng, Y. Z. Xu, I. Noda, and J. G. Wu, Coordination between lanthanide (III) ions and organic ligands of natural pharmaceutical containing lactone group probed by DAOSD approach, Biomedical Spectroscopy and Imaging 4 (2015) 129–137.
[64] Y. H. Liu J. J. Shi, D. Q. Gao, Y. L. Gao, R. Guo., X. F. Ling, S. F. Weng, Y. Z. Xu, I. Noda, J. G. Wu, Interactions between pyridinium and Nd3+, Chinese Chemical Letters 26 (2015) 182–186.
[65] D. Q. Gao, X. P. Li, J. J. Shi, X. Y. Kang, T. G. Kang, J. M. Xia, X. F. Ling, S. F. Weng, Y. Z. Xu, I. Noda, J. G. Wu, Two-dimensional correlation spectroscopic studies on coordination between carbonyl group of butanone and metal ions. Chinese Chemical Letters 26 (2015) 177-181.
[66] J. Zhang, R. Guo, T. G. Kang; A.Q. He, S. F. Weng, J. M. Xia, X. F. Ling, Y. Z. Xu, J. G. Wu, Spectroscopy and Spectral Analysis, 35(2015), 1193-1198.
67] X. P. Li, X. K. Fan, K. Huang, H. Z. Liu, Y. Zhao, Y. J. Wei, C. G. Liu, Y. Z. Xu, I. Noda, J. G. Wu, Characterization of intermolecular interaction
RSC
Advances
Accepted
between two substances when one substance does not possess any characteristic peak, J. Mol. Struct., 1069 (2014) 127-132.
RSC
Advances
Accepted
600 500 400 300 200 100 0
νS
νQ
Wavenumber (cm-1)
νP
Scheme 1 Schematic diagram of the simulated 1D spectra used in constructing asynchronous correlation spectrum. S is a virtual substance, and its characteristic peak of S appears in gray lines. It should be pointed out that the spectral region between 200 cm-1 and 0 cm-1 in this scheme is a virtual frequency region.
RSC
Advances
Accepted
Scheme 2 Asynchronous correlation spectrum generated by using the ASAP approach. Cross peaks can be classified into three domains. Domain I contains conventional cross peak in asynchronous correlation spectrum. Both domain II and domain III contain auxiliary cross peaks. Since cross peaks in domain III are anti-symmetric to the cross peaks in domain II with respect to diagonal. Only auxiliary cross peaks in domain II are discussed.
Q
P Q S
Auxiliary cross peak reflects spectral variations of Q.
Auxiliary cross peak reflects spectral variations of P.
Domain III
DomainI DomainII
S
P
RSC
Advances
Accepted
Figure 1 Asynchronous correlation spectrum based on the ASAP approach when just P possesses characteristic peak and intermolecular interactions induce the variation of absorptivity of P. It should be pointed out that the spectral region between 200 cm-1 and 0 cm-1 in this figure is a virtual frequency region.
Wavenumber (cm-1)
W
av
en
u
m
b
er
(
cm
-1 )
100 200
300 400
100
200
300
400
500
RSC
Advances
Accepted
37
1600 1500 1400
0.0 0.1 0.2 0.3
A
b
so
rb
an
ce
Wavenumber (cm-1)
a
Figure 2 (a) FT-IR spectra of the benzo-15-crown-5 of the solutions; (b) 2D asynchronous correlation spectrum generated by using the 1D spectra in Figure 2A based on the ASAP approach. The spectral region between 1500 cm-1 and 1400 cm-1 is virtual frequency region. In Figure 2B, the absolute intensity of the positive peak is larger than that of the negative peak (This is manifested by that the number of contour in the positive auxiliary peak is larger than that in the negative auxiliary peak).
Wavenumber (cm
-1)
W
av
en
u
m
b
er
(
cm
-1
)
1400
1450
1500
1550
1600
1400
1450
1500
1550
1600
1650
b
A B
RSC
Advances
Accepted
38
Figure 3 2D asynchronous correlation spectra generated by using the ASAP approach on three model systems to simulate the spectral variation on the lithium/ benzo-15-crown-5 system. The spectral region between 1500 cm-1 and 1400 cm-1 in Figure 3 is virtual frequency regions. Red contours mean cross peaks are positive and blue contours mean cross peaks are negative. The pattern of the auxiliary cross peak around (1450, 1597) in Figure 3C is similar to that shown in Figure 2B. The absolute intensity of the positive peak is larger than that of the negative peak (This is manifested by that the number of contour in the positive auxiliary peak is larger than that in the auxiliary negative peak).
Wavenumber (cm-1)
W av en u m b er ( cm -1 ) 1400 1450 1500 1550 1600 1650 1400 1450 1500 1550 1600 A
Wavenumber (cm-1)
W av en u m b er ( cm -1 ) 1400 1450 1500 1550 1600 1650 1400 1450 1500 1550 1600 B
Wavenumber (cm-1)
W av en u m b er ( cm -1 ) 1400 1450 1500 1550 1600 1650 1400 1450 1500 1550 1600 C
RSC
Advances
Accepted
Manuscript
TABLE 1 Peak parameters of the chemical species P, U and S in the model system when only P possesses characteristic peak. Spectral
Variable
Peak position Bandwidth absorptivity
P 350.00 20.00 1.00
U 350.00 20.00 1.03
S* 100.00 20.00 1.00
*It should be pointed out that S is in the virtual frequency region.
RSC
Advances
Accepted
TABLE 2 Initial concentrations of the chemical species P, Q and S in the model systems.
Number CP CQ CS
1 2.00 5.00 10.00
2 0.00 3.00 12.00
3 4.00 7.00 8.00
4 7.00 10.00 5.00
RSC
Advances
Accepted
TABLE 3 The concentrations of benzo-15-crown-5 and lithium chloride in solutions
Number CBC (mol.L-1) CLC (mol.L-1)
1 0.30 0.00
2 0.22 0.08
3 0.11 0.19
4 0.00 0.30
RSC
Advances
Accepted
Table 4 Peak parameters for three model systems
Model system I Model system II Model system III XP (cm-1) 1597.00 1597.00 1597.00
WP (cm-1) 10.00 10.00 10.00
εP 1.00 1.00 1.00
XU (cm-1) 1600.00 1600.00 1600.00
WU (cm-1) 10.00 10.00 10.00
εU 0.97 1.00 1.03
XS (cm-1) 1450.00 1450.00 1450.00
WS (cm-1) 10.00 10.00 10.00
εS 1.00 1.00 1.00
XU-XP(cm-1) 3.00 3.00 3.00
WU-WP(cm-1) 0.00 0.00 0.00
εU-εP -0.03 0.00 0.03