Effectiveness of close-loop congestion controls
for DDoS attacks
Takanori Komatsu and Akira Namatame
Mathematics and Computer Science, National Defence Academy of Japan Hashirimizu 1-10-20Yokosuka-shi, Kanagawa-Pref, Japan 239-8686
{g45045,nama}@nda.ac.jp
Summary. High-bandwidth traffic aggregates may occur during times of
flooding-based distributed denial-of-service (DDoS) attacks which are also known as flash crowds problems. Congestion control of these traffic aggregates is important to avoid congestion collapse of network services. We perform fundamental researches to min-imize the effect using existing congestion controls. We simulate DDoS attacks in different Internet topologies (Tiers model, Transit-Stub model, Scale-free model). We try to improve network resistance against DDoS attacks and similar overflow problems by using open-loop and close-loop congestion controls such as Droptail, RED and CHOKe. Furthermore we propose a new congestion contorl method based on protocol type of flow and compare the performance with existing methods.
1 Introduction
There are various security risks in the Internet. One of these security risks, is so called DDoS atacks, which can make network congested and bring servers down with huge packets. DDoS attacks have two general forms:
1. Force the victim computer(s) to reset or consume its resources such that it can no longer provide its intended service. (For examples SYN Flood etc)
2. Obstruct the communication media between the users and the victim in such that they can no longer communicate adequately. (For examples UDP Flood etc)
There are several approaches to DDoS attacks. In this paper we researched congestion control methods based on bandwidth control against the UDP Flood problem in complex network. A UDP Flood attack is a denial-of-service (DoS) attack using User Datagram Protocol (UDP). An attack on a specific host can cause extreme network congestion in addition to host’s performance decreasing. In the result, normal flows in the network are restricted by attack flows. Before now, there are many defenses for flooding-based DDoS attacks.
While much current effort focuses on simple network topology, DDoS attack occurs in the Internet which has complex network properties. In this paper, several different Internet topologies (Tiers model [2], Transit-Stub model [9][8], Scale-free model [1]) are uesd for simulation. These network represents each properties of real Internet Topology(Hierarchy, Domain Architectures, Scale-free etc.).
Packet filtering based on signature data base is one of major methods toward UDP flooding. The problem of the method is that it is too dificult to make complete data base. So system administrator is annoyed with false positive and false negative alarm. If false positive happens, the legitimate flows cannot pass the firewall at all. Because the bandwidth contorl based on queue management doesn’t use signature data base, we can ignore the problem of false positive and negative. Therefoe we apply it to congestion problems.
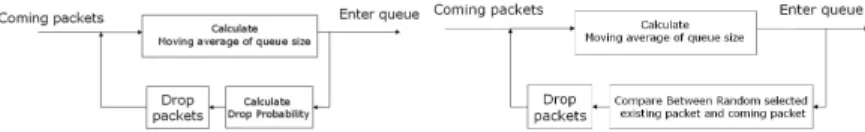
We evaluate and compare three queue methods and our proposal method under congestion situation. At first, DropTail queue method is used. Droptail is classified into open loop congestion control(Fig.1). This is basic one and has first input first output queue (FIFO). Second, RED [6] and CHOKe[4] queue methods are used. RED and CHOKe queue methods are classified into close loop congestion control(Fig.2). They use feedback data about queue size information to improve their behavior against congestion problem. Finally we propose protocol based queuing methods as congestion control. In this method, packets of unselfish flow, which has contorl mechanism of sending rate like TCP, are managed by open loop congestion control and packets of selfish flow, which has no control mechanism of sending rate like UDP, are managed by closed loop congestion control.
The remainder of this paper is structured as follows. In section 2, we introduce related works. In section 3, existing congestion control methods and our proposal method are introduced. In section 4, several network topologies used in our simulation are introduced. In section 5 and 6, we explain our simulation scenario and results respectively. Finally, in section 7 we present the conclusions and future work.
Fig. 1.Open-loop congestion control:Droptail
2 Related literature
2.1 CITRA
The CITRA (Cooperative Intrusion Traceback and Response Architecture) architecture [7] was designed to mitigate the effects of DoS attacks by using a rate-limiting mechanism (bandwidth control), which is quite similar to the aggregate congestion control with a pushback system presented in the next chapter.
The latest published version of CITRA has a two-level organization. At the highest level, administrative domains controlled by a component called the Discovery Coordinator (DC) are called CITRA communities. A DC is a device with human oversight that controls and monitors activity throughout a community. One community is then divided into CITRA neighborhoods. A neighborhood is a set of CITRA-enabled devices that are directly adjacent, i.e., that are not separated by any CITRA-enabled boundary controller, such as routers or firewalls. Every CITRA-enabled device collects network audit data. If one device detects an attack, it sends the attack identification data to its neighbors and requests that they check whether they are also on the attack path. Neighbors compare the attack pattern with their own audited data and determine whether they are on the attack path. If they are on the attack path, they repeat the request to their own neighbors. Thus, the attack is gradually traced back to its source or to the boundary of the CITRA system. In addition to tracing the attack, each CITRA-enabled device also performs an automated response defined according to a certain policy. Possible actions include blocking the traffic and limiting its authorized bandwidth.
The CITRA architecture is implemented and tested[7]. The tests deal only with well-identified traffic aggregates. Only the attack traffic suffered rate-limiting, while the legitimate traffic passed through the system without penalties.
However, perfect traffic aggregate identification is not currently possible. The performances of IDSs suffer from false positives. However, if perfect attack detection were possible, why would rate-limiting be used when blocking would be more effective? By filtering based on the chacharacteristics of packets (ex. source address), packets which are classfied into false positive can’t pass router devices. Rate-limiting can avoid that situation. This is why we focus on rate-limiting to mitigagte DDoS attack and evaluate it.
3 Congestion Control Methods
Several rate-limiting congestion control methods have been proposed to mit-igate internet traffic. In the present study, we used methods of the following forms.
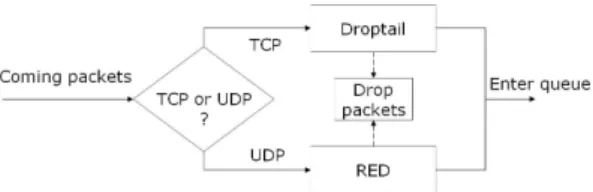
3.1 Droptail
Droptail has a finite queue and implements FIFO scheduling, as shown in Fig.3. This is typical of most present-day Internet routers. Droptail is a rather simple discipline that does not rely on estimating traffic properties. If the queue is full, no incoming packets can enter the queue until the buffer space becomes available. Thus, sometimes the queue is filled by only one flow. Drop-tail does not have a congestion avoidance mechanism. Traffic bursts are com-mon in packet networks, and, hence, an almost full droptail queue may cause multiple packet drops.
Fig. 3. Diagram of droptail
3.2 Random Early Detection: RED
RED[6] is an advanced queue method, as shown in Fig.4. RED drops packets from the queue with a certain probability, which increases with the exponen-tial moving average queue length. Thus, the queue is not filled by only one flow (which will happen in droptail). RED does not classify traffic. Efficient packet dropping requires several configuration parameters: buffer capacity, lower threshold minth, upper threshold maxth, and weight coefficient wq. RED continuously estimates the exponential moving average queue length (avg) from instantaneous queue length (q):
avgi= (1−wq)avgi−1+wqq (1) Threshold parameters minth and maxth divide the buffer into three areas. The value ofavgcontrols the behavior of the RED management. No packets are discarded if avg is smaller than the (minth) threshold. RED acts if avg is between the lower (minth) and upper (maxth) thresholds by dropping packets with a drop probability that is linearly proportional to the exponential moving
average queue size. These probabilistic drops are called early drops. They serve as an indication of an imminent congestion. An optimal operation of the RED mechanism should maintain the exponential moving average queue length within the (minth, maxth) area. RED functions as a droptail when the exponential moving average queue length increases beyondmaxth.
Fig. 4. Mechanism of RED
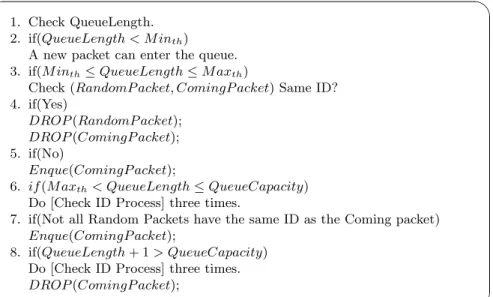
3.3 CHOKe
Fig. 5. Diagram of CHOKe
CHOKe[4] has mechanism which differentially penalizes unresponsive and unfriendly flows, as shown in Fig.5.
The behavior of CHOKe is determined by two threshold values (M inth,M axth). If the exponential moving average queue size which is used in RED is less than minth, each arriving packet is queued into the FIFO buffer.
¶ ³
1. Check QueueLength. 2. if(QueueLength < M inth)
A new packet can enter the queue. 3. if(M inth≤QueueLength≤M axth)
Check (RandomP acket, ComingP acket) Same ID? 4. if(Yes)
DROP(RandomP acket); DROP(ComingP acket); 5. if(No)
Enque(ComingP acket);
6. if(M axth< QueueLength≤QueueCapacity)
Do [Check ID Process] three times.
7. if(Not all Random Packets have the same ID as the Coming packet) Enque(ComingP acket);
8. if(QueueLength+ 1> QueueCapacity) Do [Check ID Process] three times. DROP(ComingP acket);
µ ´
Fig. 6.Pseudo-code of CHOKe
If the exponential moving average queue size is larger than minth, each arriving packet is compared with a randomly selected packet, called the drop candidate packet, from the FIFO buffer. If these packets have the same flow ID, they are both dropped (referred to herein as the preferential drop mech-anism). Otherwise, the randomly chosen packet is kept in the buffer (in the same position as before), and the arriving packet is queued.
If the exponential moving average queue size is greater thanmaxth, each arriving packet is compared with a randomly selected packet, called the drop candidate packet, from the FIFO buffer. If these packets have the same flow ID, they are both dropped. Otherwise, the randomly chosen packet is kept in the buffer (in the same position as before) and the arriving packet is dropped. This returns the exponential moving average queue size to belowmaxth.
The difference between CHOKe and droptail is the use of a preferential packet drop mechanism when the exponential moving average queue size ex-ceeds threshold and using exponential moving average queue size.
Figure 6 shows the CHOKe process in the present simulation. In this figure, ”Random Packet” means that a packet which is randomly selected from the queue.
Consider two type flows (large and small) that enter the same router. If the aggregated incoming rate is smaller than the output link capacity, the queue size does not increase tominth. If the aggregated incoming rate is grater than the output link capacity, the queue size increases. In addition, the size of each packet depends on each flow rate. In fact, in the queue, the number of packets belonging to a large flow is larger than the number of packets belonging to a
small flow. Therefore, more packets of a large flow are dropped by the process of packet comparison. This mechanism is very simple, but must be realized using a preferential drop mechanism.
3.4 Protocol based queuing method
The precursor of the Internet, ARPANet (Advanced Research Projects Agency Network) is born in 1969[5]. And then, the Internet have grown as the system designed for the research world. Therefore the Internet has no mechanism to punish selfish (attack) flow. Basically the sending rate of each flow depends on end user behavior. This offers simple network system and help expansion of the Internet. However this permits attackers to wreak a lot of damage on the Internet performance.
The consept of protocol based queueing (PBQ) is that the network protect it’s function by itself. Selfish flow should be managed by close loop congestion contorl(CLCC) and autonomous flow should be managed by open loop conges-tion control(OLCC). Concretely speaking, in protocol based queuing at layer 4, UDP flow is managed by RED and TCP flow is managed by droptail(Fig.7).
Fig. 7. Diagram of PBQ method
4 Network topologies used for simulations
The real Internet is considered to consist of several topologies, depending on the point of view. We thus take into account all properties needed to simulate DDoS attacks. In this section, we discuss network topologies used to simulate DDoS attacks.
4.1 Tiers model
The Internet has a hierarchical structure, as shown in Fig.8 [2]. In this model, nodes are categorized into three types: edge nodes (LAN nodes), bridge, router or switch nodes (Metropolitan Area Network - MAN nodes) and gateway (WAN) nodes. Empirically, this idea is very natural. For example, in the Science Information Network, which is the Internet Information Infrastructure
for universities and research institutes in Japan, many universities connect to key university (MAN), which is connected to a backbone WAN. In addition, many university clients are connected to each other by a LAN.
Fig. 8. Tiers model Fig. 9. Transit-stub model
4.2 Transit-stub model
At present, the Internet can be viewed as a collection of interconnected routing domains, which are groups of nodes under a common administration that share routing information. A primary characteristic of these domains is routing locality, in which the path between any two nodes in a domain remains entirely within the domain. Thus, each routing domain in the Internet can be classified as either a stub or transit domain (Fig.9).
A domain is a stub domain if the path connecting nodes u and v passes through that domain and if either u or v is located in that domain. Transit domains do not have this restriction. The purpose of transit domains is to interconnect stub domains efficiently. Without transit domains every pair of stub domains would need to be directly connected. Stub domains can be further classified as single- or multi-homed. Multi-homed stub domains have connections to more than one other domain. Single-homed stubs connect to only one transit domain. A transit domain is comprised of a set of backbone nodes, which are typically high-connected to each other.
4.3 Scale-free network (Barabasi-Albert (BA) model)
The property of this model is that the degree distribution obeys the power law, which is observable in Internet AS level Topology. The main features with respect to how to make Barabasi-Albert (BA) model are:
1. Networks expand continuously by the addition of new nodes.
5 Simulation scenario
In this section, we explain how to make the simulation netowrk and traffic.
5.1 Network generation
The network consists of edge (link) and node. The each edge has a buffer which store packets, which is waiting for sending to next node. And the packets in a buffer is managed by congestion control method based on queue management. The capacity of buffer is same between all edges. The number of waiting packets in a buffer keep increasing under congestion, and packets are dropped when the number exceeds the capacity of buffer. The edge has delay time. It takes a some time for packets to go through the edge. Threfore the time for packets to go through the edge is the sum of waiting time at a buffer plus delay time.
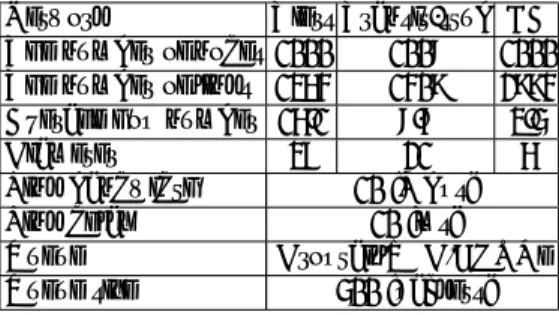
There are two type host in the network. One is host node which send, receive and route flows. Another one is router node which only route flows. In our simulation, all nodes are host nodes which consist of TCP host node and UDP host node. TCP host nodes send and receive TCP flows. And UDP host nodes send and receive UDP flows. We show parameter settings in each network in table 1.
Table 1.Parameter settings in simulation network
Network Tiers Transit-stub BA The number of nodes 1000 1008 1000 The number of links 1364 1409 2994 Average hop number 16.1 8.7 3.5
Diameter 37 21 6
Link bandwidth 10 [Mbps]
Link delay 10 [ms]
Queue Droptail,RED,CHOKe
Queue size 500 [packets]
5.2 Traffic generation
There are TCP (Reno) and UDP flow in the network. Each session of flow is generated in a random manner as follows.
1. The number of tcp host nodes are decieded by tcp host rate (1−p) and to-tal number of hostsN. Among themN(1−p) tcp host nodes are deployed randomly over the network.
2. Second, each tcp host nodes select one destination host randomly. And tcp sessions are made between those host nodes. Then, there areN(1−p) tcp sessions in the network.
3. Third, same methods are done for the restN pUDP host nodes.
Next, FTP service is deployed on each TCP session. The size of data FTP service wants to transfer is infinity. The sendig rate of TCP flow is decided by TCP Reno mechanism (slow start and congestion avoidance).
And constant bit rate (CBR) service is deployed on each UDP session. That means UDP flow doesn’t change it’s sending rate during simulation. The sending rate of UDP flow is about twice value of average TCP throughput over 1000 TCP flows when there are only TCP flow in each network. Because UDP flow occupies twice bandwidth of TCP flow, the network becomes congestion phase as the number of UDP flow increases. We show parameter settings in each flow in table 2.
Table 2.Parameters in TCP and UDP flow
Network
TCP Tiers TS Scale-free
The value of sendig rate Depend on TCP Reno mechanism
UDP Tiers TS Scale-free
The value of sendig rate [Mbps] 0.595 0.730 4.23
By this means, we make TCP and UDP flows in the network. We control the amount of TCP flow and UDP flow in the network by changing variable p∈[0,0.9].
6 Simulation results
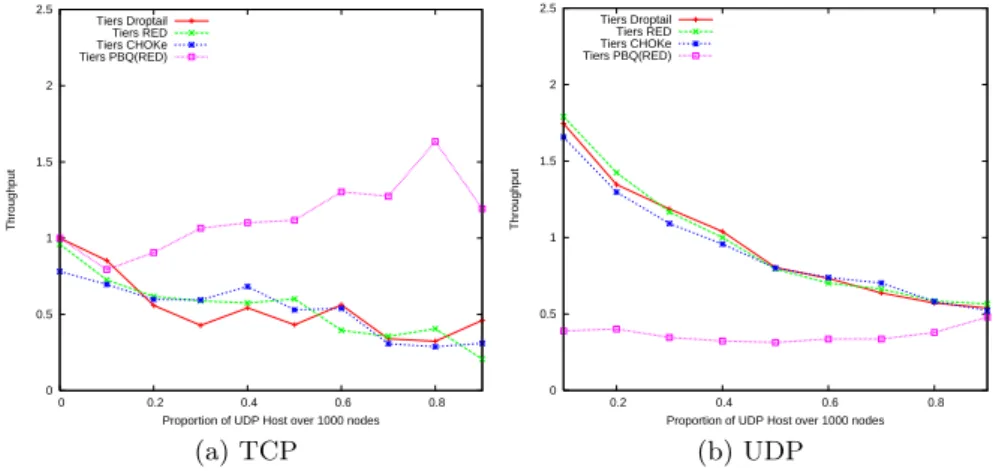
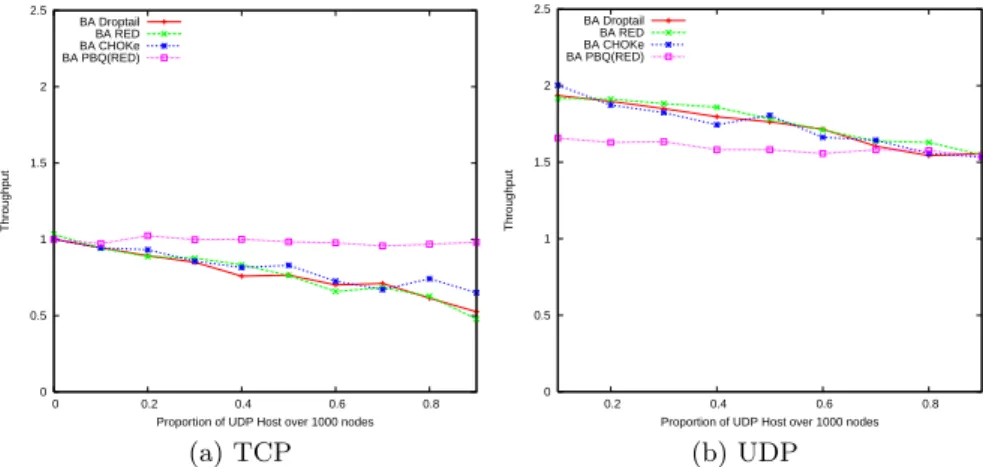
In this section, we show our experiments results. TCP and UDP flows are made by changingpthe proportion of UDP host over 1000 nodes. Therefore the number of TCP flow is 1000(1−p) and the number of UDP flow is 1000pin each network. The throughput value in results is normalized by average TCP throughput over 1000(1−p) flows atp= 0 in each network(Fig.10,11,12). We evaluate the impact of network topology and congestion contorl toward aver-age throughput. From the results, atp= 0.1 we can see the average through-put of UDP flow gets about two times higher than the average throughthrough-put of TCP flow by using existing congestion control methods in all network topol-ogy. Autonomous flow (TCP flow) is restricted by selfish flow (UDP flow). And average TCP throughput decreases as the proportion of UDP host increases in all network topology. However PBQ moderate fluctuation of average TCP and UDP throughput well especially in BA (see Fig.12). Because the scale
free BA network model has hub node. Therefore major part of flows in the nework go through a common small number of hub nodes. Congestion contorl based on queue management works effectively in that situation. These results show us that PBQ can be the way to mitigate congestion problem.
0 0.5 1 1.5 2 2.5
0 0.2 0.4 0.6 0.8
Throughput
Proportion of UDP Host over 1000 nodes Tiers Droptail Tiers RED Tiers CHOKe Tiers PBQ(RED) (a) TCP 0 0.5 1 1.5 2 2.5
0.2 0.4 0.6 0.8
Throughput
Proportion of UDP Host over 1000 nodes Tiers Droptail
Tiers RED Tiers CHOKe Tiers PBQ(RED)
(b) UDP
Fig. 10.Average throughput per flow:Tiers model
0 0.5 1 1.5 2 2.5
0 0.2 0.4 0.6 0.8
Throughput
Proportion of UDP Host over 1000 nodes TS Droptail TS RED TS CHOKe TS PBQ(RED) (a) TCP 0 0.5 1 1.5 2 2.5
0.2 0.4 0.6 0.8
Throughput
Proportion of UDP Host over 1000 nodes TS Droptail
TS RED TS CHOKe TS PBQ(RED)
(b) UDP
0 0.5 1 1.5 2 2.5
0 0.2 0.4 0.6 0.8
Throughput
Proportion of UDP Host over 1000 nodes BA Droptail
BA RED BA CHOKe BA PBQ(RED)
(a) TCP
0 0.5 1 1.5 2 2.5
0.2 0.4 0.6 0.8
Throughput
Proportion of UDP Host over 1000 nodes BA Droptail
BA RED BA CHOKe BA PBQ(RED)
(b) UDP
Fig. 12.Average throughput per flow:Scale free network (BA model)
7 Conclusion and Future work
Congestion control based on queue management gives simple and efficient way of managing over flow problem. Because that doesn’t need signature dabase, the implementation cost becomes very low. In this paper, we propose proto-col based queuing method. And we compare the effects of congestion controls in several different network topologies by numerical experiments. From the results of experiments, PBQ at layer 4 moderate average throughput fluctua-tion in different network topologies. That show us PBQ can be the basement measure against congestion problem.
However we classify flows by layer 4 state (TCP and UDP), there are many applications on TCP and UDP in real network. We will enhance the idea PBQ from at layer 4 state to upper layer state, and also analyze how many nodes and which nodes we have to implement PBQ method to mitigate congestion problem efficiently.
References
1. A. L. Barabasi and R. Albert. Emergence of scaling in random networks.Science, Vol. 286, pp. 509–512, 1999.
2. Matthew B. Doar. A better model for generating test networks. In proceedings of global telecommunications conference, pp. 86–93, November 1996.
3. Takanori Komatsu and Akira Namatame. Defending against high-bandwidth traffic aggregates.IJCSNS International Journal of Computer Science and Net-work Security, Vol. 7, No. 2, pp. 243–250, February 2007.
4. R. Pan, B. Prabhakar, and K. Psounis. A stateless active queue management. scheme for approximating fair bandwidth allocation. In proceedings of IEEE Infocom, pp. 942–951, April 2000.
5. Fabio Remondino and Tuan chih Chen. Isprs and internet: History, presence and future. International Archives of Photogrammetry and Remote Sensing,, September 2002.
6. Floyd S. and Jacobson V. Random early-detection gateways for congestion avoid-ance.IEEE/ACM Transantions on Networking, Vol. 1, No. 4, pp. 397–413, April 1993.
7. D. Schnackenberg, H. Holliday, R. Smith, K. Djahandari, and D. Sterne. Cooper-ative intrusion traceback and response architecture (citra). In proceedings of the second DARPA information survivability conference and exposition, pp. 56–58, June 2001.
8. Ellen W.Zegura, Kenneth L.Calvert, and Michae J. Donahoo. A quantitative comparison of graph-based models for internet topology. IEEE/ACM Transac-tions on networking, pp. 770–783, December 1997.
9. Ellen W. Zegura, K. Calvert, and S.Bhattacharjee. How to model an internet-work. In proceedings of IEEE Infocom, pp. 594–602, March 1996.