VMware vCenter Server 6.0
Cluster Performance
Performance Study
Table of Contents
Introduction... 3
Experimental Setup ... 3
Layout ... 3
Software Configuration ... 5
Performance Benchmark ... 5
Workload ... 5
vCenter Server 6.0 Cluster Performance: A Case Study ... 6
vCenter 5.5 Cluster vs. vCenter 6.0 Cluster ... 6
Workload Scaling... 8
vCenter 6.0 with ESXi 6.0 Hosts ... 9
vCenter Server Appliance vs. vCenter Server on Windows ... 11
vCenter Cluster Performance and Scalability ... 12
Performance Considerations ... 16
Introduction
Clusters in VMware vCenter Server™ are an important way to group ESXi hosts. When a host is added to a cluster, the host's resources become part of the cluster's resources. Within a cluster, resource management elements can be defined; for example, a resource pool, reservation, or limit. vCenter Server also provides features like DRS and HA at a cluster level [1].
The performance of clustering in vCenter Server 6.0 has improved over 5.5 in two key areas:
• Increase in supported single cluster limit: 64 ESXi hosts and 8,000 virtual machines (in 5.5, this was 32 ESXi hosts and 3,000 virtual machine)
• Linear throughput scaling with an increase in cluster size and workload Other performance highlights include impressive improvements:
• Up to 66% improvement in operational throughput over vCenter Server 5.5 • Improved performance under very heavy workloads
• Performance parity between vCenter Server on Windows and VCSA • Significantly faster virtual machine operations
Central to this paper is a case study that shows the performance of vCenter Server 6.0 clusters and illustrates the performance improvements over vCenter Server 5.5. This paper also compares the performance of vCenter Server on Windows and the vCenter Server Appliance (VCSA).
Experimental Setup
Layout
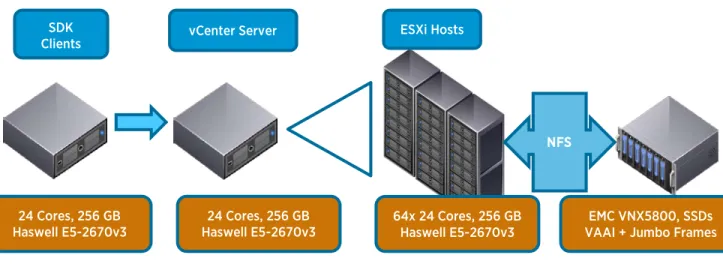
The base configuration used vCenter Server 6.0 managing a cluster of ESXi 5.5 hosts. vCenter Server and the ESXi hosts were installed on 24-core Intel Haswell-based servers. The storage backend was an SSD-based array linked to all the hosts by NFS (Figure 1) on a 10 gigabit Ethernet (GbE) link.
Figure 1. Physical testbed layout
The cluster was configured with vSphere DRS and vSphere HA, and it contained a single root resource pool with a set of resource pools under it, as depicted in Figure 2.
Figure 2. Cluster resource pool structure
NFS SDK
Clients vCenter Server ESXi Hosts
64x 24 Cores, 256 GB
Haswell E5-2670v3 VAAI + Jumbo Frames EMC VNX5800, SSDs 24 Cores, 256 GB
Haswell E5-2670v3 24 Cores, 256 GB
Software Configuration
vSphere Component VMware Software Version VM Configuration
ESXi Hosts vSphere 5.5 U2 / vSphere 6.0 --
vCenter Server Appliance (Linux) vCenter Server 6.0 VM: 16 vCPUs, 24GB vRAM 1
vCenter Server 5.5 U2 VM: 8 vCPUs, 24GB vRAM 1
vCenter Server Windows vCenter Server 6.0 VM for vCenter: 16 vCPUs, 32GB vRAM1,
Microsoft Windows Server 2012 R2 vCenter Server 5.5 U2 VM for vCenter DB: 8 vCPUs, 48GB vRAM 1 , Microsoft Windows Server
2012 R2, Microsoft SQL Server 2012
Table 1. Software configuration for testbed
Performance Benchmark
A benchmarking tool was used to stress the performance and scalability of vCenter Server. This tool allows performance engineers to specify a list of management operations for the vSphere Web Services SDK to deploy and allows the testing team to vary the number of concurrent operations that are issued to the server.
The mix of management operations was chosen based on data collected from a wide range of customer installations of vCenter Server [2].
Workload
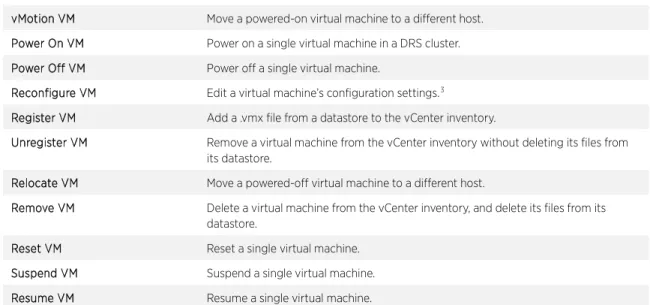
The workload uses the vSphere Web Services SDK to simulate a high-churn vCenter environment [2]. Each client repeatedly issues a series of management and provisioning operations to vCenter Server. Table 1 lists the operations performed in this workload. These operations and their relative frequency were chosen from a sampling of representative customer data.
The intensity of the SDK workload (the performance benchmark) in a given cluster is based on the number of concurrent clients run in that cluster. Workloads of varying intensity were run to study the scalability of the server.
Operation Description
Add Port Group Create a new port group on a vSphere Standard Virtual Switch. Remove Port Group Remove a port group from a vSphere Standard Virtual Switch. Clone VM Create a clone of a virtual machine.2
Create Folder Create a new folder in the vCenter inventory hierarchy. Delete Folder Delete a folder from the vCenter inventory hierarchy. Create Snapshot Create a snapshot of a virtual machine.
Delete Snapshot Delete a snapshot of a virtual machine.
1 This configuration supports an inventory of up to 1,000 hosts and 10,000 virtual machines 2 The performance of a clone operation depends on the size of the VM being cloned.
Group Power-On VMs Power on several virtual machines in a single operation. vMotion VM Move a powered-on virtual machine to a different host. Power On VM Power on a single virtual machine in a DRS cluster. Power Off VM Power off a single virtual machine.
Reconfigure VM Edit a virtual machine’s configuration settings.3
Register VM Add a .vmx file from a datastore to the vCenter inventory.
Unregister VM Remove a virtual machine from the vCenter inventory without deleting its files from its datastore.
Relocate VM Move a powered-off virtual machine to a different host.
Remove VM Delete a virtual machine from the vCenter inventory, and delete its files from its datastore.
Reset VM Reset a single virtual machine. Suspend VM Suspend a single virtual machine. Resume VM Resume a single virtual machine.
Table 2. List of management operations issued by performance benchmark
vCenter Server 6.0 Cluster Performance:
A Case Study
To study the cluster scalability and performance of vCenter Server 6.0, a series of experiments were undertaken: • Comparison of vCenter Server 5.5 with vCenter Server 6.0 version, using ESXi 5.5 hosts.
• Performance of vCenter Server 6.0 managing a cluster of all ESXi 6.0 hosts.
• Comparison of the performance of vCenter Server 6.0 on Windows with the vCenter Server Appliance (VCSA) 6.0.
• Scaling vCenter Server 6.0 with inventory size and workload.
vCenter 5.5 Cluster vs. vCenter 6.0 Cluster
The setup for this test was a vCenter Server cluster (vCenter Server 5.5 Linux appliance vs. vCenter Server Appliance 6.0). A high-churn workload, as indicated in the previous section, was run against each vCenter Server cluster. The maximum supported hosts and virtual machines with DRS enabled was used in each case:
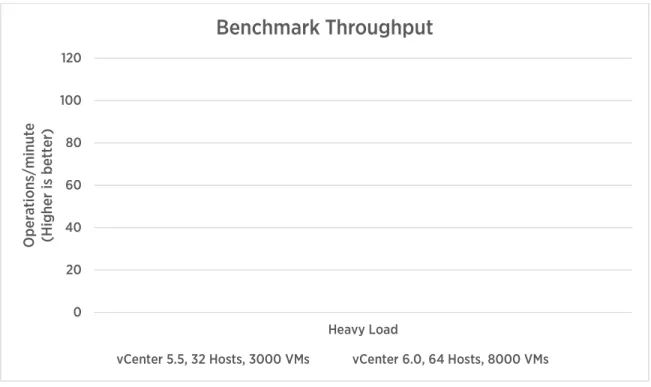
• The vCenter 5.5 environment had 32 ESXi hosts and 3,000 virtual machines. • The vCenter 6.0 environment had 64 ESXi hosts and 8,000 virtual machines.
Figure 3. vCenter 5.5 vs. 6.0 performance comparison
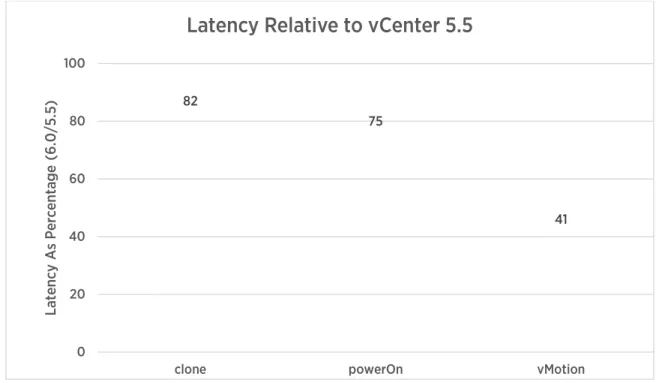
As Figure 3 illustrates, vCenter 6.0 can support a larger cluster size with increased operational throughput relative to vCenter 5.5. Moreover, despite the larger cluster size, the individual operational latencies have also improved from 5.5 to 6.0. Figure 4 shows a sample of these improvements: as the figure indicates, vMotion, powerOn and clone latency have improved 59%, 25%, and 18% respectively.
0 20 40 60 80 100 120
Heavy Load
O
pe
ra
tions
/m
inut
e
(H
ig
her
is
b
et
ter
)
Benchmark Throughput
Figure 4. Improvement in operational latency in vCenter 6.0 (lower is better)
The performance of many key operations in a DRS cluster, including powerOn and vMotion, depend on the performance of DRS itself. Improvements to DRS data collection and calculation of virtual machine placement have resulted in lower latencies for such operations in vCenter 6.0.
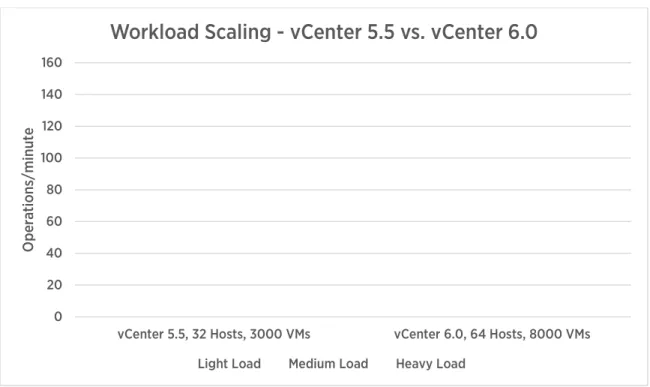
Workload Scaling
To study the impact of workload intensity on cluster performance, different workload configurations were run against both vCenter 5.5 and 6.0. In both cases, the cluster size remained constant (which was the maximum size supported for the given vCenter version). Each workload was defined as light, medium, or heavy based on the number of concurrent clients in each case.
Figure 5 illustrates the improvements in concurrency in vCenter 6.0. At a light load and with a larger inventory than 5.5, vCenter 6.0 can drive 3 times the number of concurrent operations. At a heavy load, vCenter 6.0 can drive more than 2 times the number of concurrent operations compared to 5.5.
82
75
41
0 20 40 60 80 100
clone powerOn vMotion
Lat
en
cy
A
s P
er
cen
tag
e
(6
.0
/5
.5
)
Figure 5. Benchmark throughput scaling with varying workloads and constant cluster size, illustrating better performance in vCenter 6.0 (higher is better)
vCenter 6.0 with ESXi 6.0 Hosts
The previous sections used vCenter Server 6.0 to manage ESXi 5.5 hosts. This section demonstrates the performance improvements when using ESXi 6.0 hosts in conjunction with vCenter Server 6.0. The testbed configuration was exactly the same as in the previous test.
0 20 40 60 80 100 120 140 160
vCenter 5.5, 32 Hosts, 3000 VMs vCenter 6.0, 64 Hosts, 8000 VMs
O
pe
ra
tions
/m
inut
e
Workload Scaling - vCenter 5.5 vs. vCenter 6.0
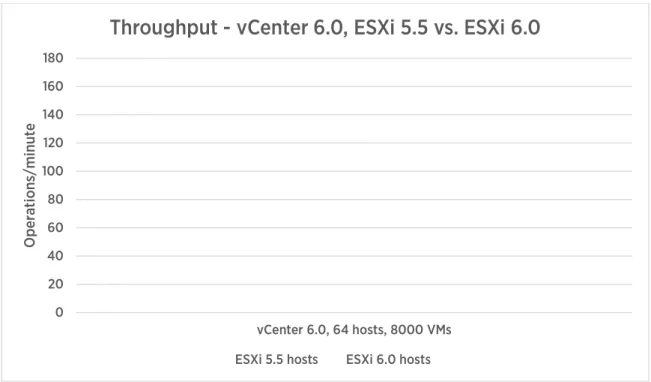
Figure 6. Throughput comparing vCenter 6.0 and ESXi 5.5 vs. vCenter 6.0 and ESXi 6.0 (higher is better)
The throughput of vCenter Server goes up by about 60% when using ESXi 6.0 hosts, compared to ESXi 5.5 hosts (Figure 5). vSphere 6.0 includes a number of significant improvements to the management agents on the ESXi host to reduce resource usage and lower the latency across key operation code paths, and the result is reduced per-host operational latencies.
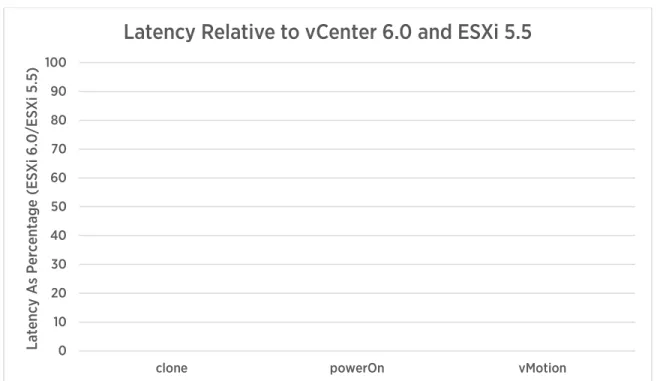
Figure 7 lists the amount of latency improvement in vCenter 6.0 with ESXi 6.0 over ESXi 5.5 for some of the operations.
0 20 40 60 80 100 120 140 160 180
vCenter 6.0, 64 hosts, 8000 VMs
O
pe
ra
tions
/m
inut
e
Throughput - vCenter 6.0, ESXi 5.5 vs. ESXi 6.0
Figure 7. Improvement in operational latency in vCenter 6.0 with ESXi 6.0 (lower is better)
vCenter Server Appliance vs. vCenter Server on Windows
The test in this section compares the performance of vCenter Server running in a Windows virtual machine with a Microsoft SQL Server database to the vCenter Server Appliance (VCSA), which runs in a Linux virtual machine and has an embedded vPostgres database.
• vCenter Server on Windows was configured according to best practice recommendations described in vCenter Server 6.0 Performance and Best Practices [2]. A SQL Server database was used because it can support more than 20 ESXi hosts and 200 virtual machines.
• VCSA was configured mostly with out-of-the-box settings, including using the embedded vPostgres database. 0 10 20 30 40 50 60 70 80 90 100
clone powerOn vMotion
Lat en cy A s P er cen tag e (E SX i 6 .0 /E SX i 5 .5 )
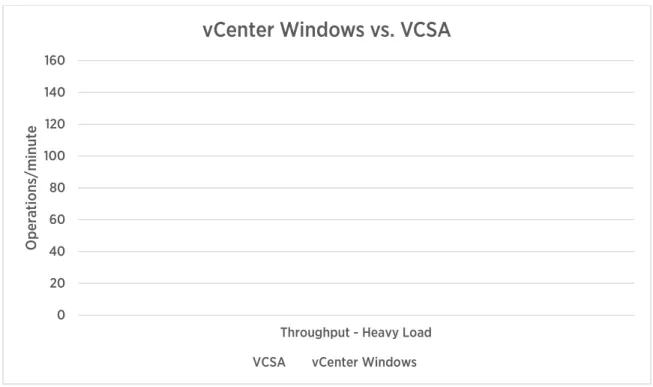
Figure 8. vCenter 6.0 Windows vs. VCSA throughput comparison
Figure 8 illustrates that with the same heavy workload, vCSA, with an embedded database, outperforms vCenter Windows with an external SQL Server database. One reason for this is that the database is on the same node as the vCenter Server itself, reducing the latency of database-related operations. For more best practices, see vCenter Server 6.0 Performance and Best Practices [2].
vCenter Cluster Performance and Scalability
Previous tests show the performance of vCenter at its cluster scale limits. The tests in this section illustrate how vCenter scales with inventory size and applied load.
0 20 40 60 80 100 120 140 160
Throughput - Heavy Load
O
pe
ra
tions
/m
inut
e
vCenter Windows vs. VCSA
Figure 9. vCenter 6.0 throughput with inventory and workload scaling
As shown in Figure 9 , vCenter Server 6.0 displays a steady increase in throughput as it is scaled out in terms of more inventory (ESXi hosts and virtual machines) and more workload-generator clients.
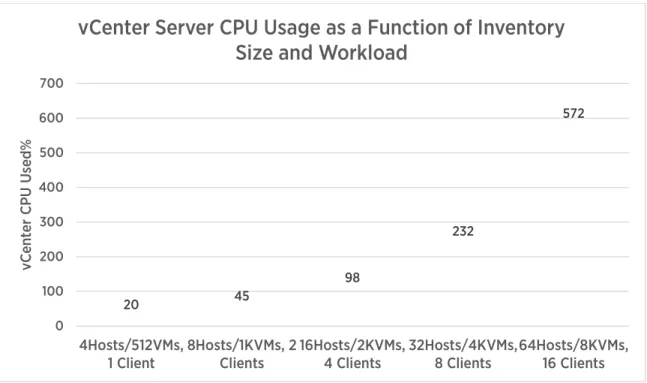
It is also useful to know vCenter CPU usage and memory as a function of workload and inventory size to demonstrate the scalability of vCenter Server.
0 20 40 60 80 100 120
Operation Throughput
O
pe
ra
tions
/m
inut
e
Inventory and Workload Scaling
4 Hosts, 500 VMs, 1 Client 8 Hosts, 1000 VMs, 2 Clients 16 Hosts, 2000 VMs, 4 Clients 32 Hosts, 4000 VMs, 8 Clients 64 Hosts, 8000 VMs, 16 Clients
Figure 10. CPU usage increases when the inventory size and workload are increased (vCenter Server 6.0)
Figure 10 shows vCenter CPU usage as a function of increasing workload and inventory size. As the graph shows, the CPU usage of vCenter Server 6.0 is strongly related to the number of management operations being performed (as the inventory size and workload size are increased, the amount of CPU used also increases). Figure 11 shows that the memory usage of vCenter Server grows as the inventory is scaled up: the more objects that vCenter Server is managing, the larger its memory footprint. Figure 12 shows the memory usage growth of vCenter Server as the workload is increased while the inventory size remains constant.
20 45
98
232
572
0 100 200 300 400 500 600 700
4Hosts/512VMs,
1 Client 8Hosts/1KVMs, 2Clients 16Hosts/2KVMs,4 Clients 32Hosts/4KVMs,8 Clients 64Hosts/8KVMs,16 Clients
vC
ent
er
C
PU
U
se
d%
vCenter Server CPU Usage as a Function of Inventory
Size and Workload
Figure 11. Memory usage increases when the inventory size and workload are increased
Figure 12. Memory usage increases as the workload is increased (with a constant inventory size)
Memory usage of vCenter Server 6.0 depends more on the inventory size than on the workload. This illustrates the importance of proper sizing when provisioning a vCenter Server. For specific guidelines on sizing vCenter Server, refer to the vCenter Server deployment guide [3].
442 594 1198 2458 5456 0 1000 2000 3000 4000 5000 6000
4 Hosts/512 VMs 8 Hosts/1K VMs 16 Hosts/2K VMs 32 Hosts/4K VMs 64 Hosts/8K VMs
vC en ter Mem or y U sed ( MB )
vCenter Server Memory Usage as a Function of
Inventory Size and Workload
5054 5456 6036 4400 4600 4800 5000 5200 5400 5600 5800 6000 6200
8 Clients 16 Clients 32 Clients
vC en ter Mem or y U sed ( MB )
Performance Considerations
The tests in this paper reveal several performance considerations to keep in mind:
• In a DRS-enabled cluster, as the cluster size (number of ESXi hosts and virtual machines) is increased, some operations are impacted more than others. The latency of power on (vm.powerOn, datacenter.powerOn), vMotion (vm.migrate), and relocate (vm.relocate) increase as the cluster size grows and the workload increases. This is mostly because DRS needs to do more work in a larger cluster to determine where to place a virtual machine that is being powered on.
• Running vCenter Server 6.0 with ESXi 6.0 hosts results in better performance than with ESXi 5.5 hosts. • Consider vCenter Server memory requirements when scaling a vCenter cluster.
References
[1] VMware, Inc. (2013) vSphere 5.5 Resource Management.
https://pubs.vmware.com/vsphere-55/topic/com.vmware.ICbase/PDF/vsphere-esxi-vcenter-server-55-resource-management-guide.pdf [2] Mike Stunes and Ravi Soundararajan. (2015, August) VMware vCenter 6.0 Performance and Best Practices.
https://communities.vmware.com/docs/DOC-29203
[3] Mike Brown. (2015, February) VMware vCenter Server 6.0 Deployment Guide.
VMware, Inc. 3401 Hillview Avenue Palo Alto CA 94304 USA Tel 877-486-9273 Fax 650-427-5001 www.vmware.com
Copyright © 2015 VMware, Inc. All rights reserved. This product is protected by U.S. and international copyright and intellectual property laws. VMware products are covered by one or more patents listed at http://www.vmware.com/go/patents. VMware is a registered trademark or trademark of VMware, Inc. in the United States and/or other jurisdictions. All other marks and names mentioned herein may be trademarks
About the Authors
Sai Manohar Inabattini is a performance engineer with the vCenter Server performance group. He works on vCenter Server performance and scalability, with special focus on the Distributed Resource Scheduling (DRS) algorithm. Sai holds a bachelor’s degree in computer science from the National Institute of Technology at Warangal, India.
Adarsh Jagadeeshwaran works in the vCenter Server performance group in VMware, leading a team that is focused on vCenter Server resource management and scalability. Adarsh holds a master’s degree in computer science from Syracuse University, Syracuse, USA.
Acknowledgements
The authors would like to express their sincere thanks to Shruthi Kodi for her efforts in running all the performance experiments and collecting data for this paper.
The authors would also like to thank Satyen Abrol and Lei Chai for their help with experiments, and Ravi Soundararajan, Priya Sethuraman, Maarten Wiggers, Naveen Nagaraj, and Zhelong Pan for their invaluable reviews and support of this paper.