MAGNETIC RESONANCE WATER SELF-DIFFUSION TENSOR
ENCODING OPTIMIZATION METHODS FOR FULL BRAIN
ACQUISITION
K
HADERM
H
ASAN1,2,
D
ENNISL
P
ARKER3 ANDA
NDREWL
A
LEXANDER1,2,4Departments of Medical Physics1 and Psychiatry4, WM Keck Laboratory for Functional Brain Imaging and Behavior2, The Waisman Center, 1500 Highland Ave, University of Wisconsin, Madison, Wisconsin 53705-2280 USA, Department of Radiology3, University of Utah, Salt Lake City, Utah 84132, USA
e-mail: [email protected]
(Accepted May 9, 2002)
ABSTRACT
Water diffusion tensor magnetic resonance imaging (DT-MRI) is a non-invasive and sensitive modality that is becoming increasingly popular in diagnostic radiology. DT-MRI provides in vivo directional information about the organization and microdynamics of deep brain tissue that is not available by other MRI relaxation-based methods. The DT-MRI experiment involves a host of imaging and diffusion parameters that influence the efficiency (signal-to-noise ratio per unit time), accuracy, and specificity of the information sought. These parameters may include typical imaging parameters such as TE, TR, slice thickness, sampling rate, etc. The DTI relevant parameter space includes pulse duration, separation, direction, number of directions (Ne), order, sign and strength of the diffusion encoding gradient pulses. The goal of this work is to present and compare different tensor encoding strategies used to obtain the DT-MRI information for the whole brain. In this paper an evaluation of tensor encoding advantage is presented using a multi-dimensional non-parametric Bootstrap resampling method. This work also explores the relationship between different tensor encoding schemes using the analytical encoding approach. This work shows that the minimum energy optimization approach can produce uniformly distributed tensor encoding that are comparable to the icosahedral sets. The minimum condition encoding sets are not uniformly distributed and are shown to be suboptimal and related to a commonly used heuristic tensor encoding set. This work shows that the icosahedral set is the only uniformly distributed set with Ne = 6. At equal imaging time, the Bootstrap experiments show that optimal tensor encoding sets can have 6 < Ne < 24.
Keywords: analytical encoding, bootstrap, diffusion tensor encoding, icosahedron, minimum energy, spatial distribution.
INTRODUCTION
Recent advances in magnetic resonance based diffusion tensor imaging (DT-MRI) provide important
in vivo information about water diffusion properties
(direction, magnitude and anisotropy) of biological tissues (Basser et al., 1994; Le Bihan, 1995). A typical DT-MRI experiment is commonly acquired using a spin-echo prepared single-shot echo-planar sequence with bipolar diffusion encoding gradient pulses applied along the three physical gradient channels (Taylor and Bushell, 1985). The measured diffusion sensitized signal is a superposition of spatially dependent incoherent phases, acquired due to random translational Brownian motion during the spatially dependent diffusion encoding magnetic field
achieved. A recent analysis by Basser (2002) has shown that the single tensor model is a practical option in a clinical setup if the acquisition parameters are carefully selected. This paper reviews the fundamental aspects of the single tensor encoding and estimation problem. The tensor encoding theory is used to define figures-of-merit that can be used in the design and evaluation of different encoding sets. A Bootstrap statistical procedure is used to compare the performance of different diffusion tensor encoding strategies. This paper also presents some results of full human brain DT-MRI maps acquired at 3T, using optimally designed tensor encoding sets.
DIFFUSION TENSOR PARAMETER
SPACE
The symmetric positive definite diffusion tensor (DT) has six independent elements, which can be diagonalized into three eigenvalues and three orthonormal eigenvectors (Fig. 1); therefore, a minimum of six independent encoded measurements, in addition to a reference image, is required to decode the diffusion tensor (Basser et al., 1995). In general, the total number of DT-MRI images, NT, is composed of a sum
N
TN
es N
ds
s Ns
=
=∑
( )
( )
1
, where Ne(s) is the number of encoding directions each averaged Nd(s) times at some diffusion weighting step (s). The diffusion weighting b-factor contribution for a bipolar gradient pulse is given by b = (δGγ)2(∆-δ/3)
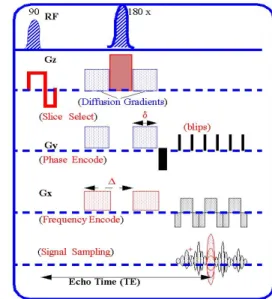
(Stejskal and Tanner, 1965), where γ is the nuclear spin gyromagnetic ratio and G is the amplitude of the diffusion gradient pulses. The two-step DT-MRI experiment is acquired by varying the direction, sign, order, strength (G), number of reference (Nref ; b~0) and diffusion weighted images (Nd), at fixed imaging parameters: repetition time (TR), effective echo time (TE), diffusion pulse duration (δ) and separation time (∆), slice thickness, and sampling parameters, etc. (Fig. 2). The total imaging time, T, for a two b-factor DT-MRI experiment (Ns = 2) can be expressed as
T = (Nref + NdNe)TR. The error associated with the set of DT-MRI encoded measurements is a function of the tensor gradient encoding scheme (Conturo et al., 1995) and the partitioning of the total diffusion imaging time, NT (Xing et al., 1997; Cercignani and Horsfield, 1999; Jones et al., 1999).
Fig. 1. The diffusion tensor ellipsoid, the local tissue
and physical gradient coordinate systems. Note that the positive definite and symmetric diffusion tensor can be diagonalized (Dei=λiei) into three eigenvalues
and three eigenvectors.
Fig. 2. Schematic of the spin-echo bipolar gradient
diffusion tensor imaging pulse sequence and the DT-MRI parameter space.
SELF-DIFFUSION TENSOR ENCODING
THEORY
theory developed to characterize the chemical shift tensor (Alderman et al., 1990) and the thermal expansivity tensor (Nye, 1957). Since the tensor is diagonally symmetric, a minimum of six non-collinear encoding directions is needed to obtain the six independent elements of the diffusion tensor, D (Basser et al., 1995)
D
=
D
D
D
D
D
D
D
D
D
x x x y x z
y x y y y z
zx zy zz
, (1)
where Dxy = Dyx, Dxz = Dzx and Dyz = Dzy.
Alternatively, the unique tensor elements can be represented be represented by the column vector (Nye, 1957)
[
]
d
D
xxD
yyD
zzD
xyD
xzD
yz t=
. (2)The single tensor model that relates the unknown tensor D with the encoding diffusion unit vector, £(k) = [gx(k) gy(k) gz(k)]
t
, the diffusion weighting
b-factor, b, the reference intensity image, I(0), and the
measured diffusion weighted images, I(k), can be expressed as
I k
( )
=
I
( ) e x p (
0
−
b g k
( )
tD
g k
( ))
. (3) To enhance the SNR and reduce phase fluctuations, the reference and diffusion weighted images are repeated and magnitude averaged Nref andNd times respectively. The scalar quantity
D
m( )
k
=
g k
( )
tD
g k
( )
, (4) can be viewed as the projection of the diffusiontensor onto the measurement encoding unit direction g. Dm(k)can also be expressed as a matrix product
D
m( )
k
=
h k
( )
td
, (5)where
( )
( )
( )
( )
( ) ( )
( ) ( )
( ) ( )
2 2 2
ˆ 2
2 2
x y z x y
t
x z y z
h k g k g k g k g k g k
g k g k g k g k
=
.(6)
Define the column vector Ó, which is formed from the measured data, with components
y k
( )
=
ln ( ( ) / ( ))
I
0
I k
, (7)where k = 1...Ne. The relationship between Ó and
d
can be expressed in matrix notation asY
=
H
d
+
η
, (8)where H is the design encoding matrix, which is formed from the row vectors ©(k)t. The least-squares optimization and the singular value decomposition methods (Hasan et al., 2001a) can now be used to estimate the diffusivity vector,
d
, where the superscript -1 refers to matrix pseudo-inversion:d
=
(
H H
t)
−1H
tY
. (9)ESTIMATION OF THE TENSOR MAPS
The estimated diffusion tensor elements,
d
, can be used to estimate the magnitude, anisotropy and orientation of the local diffusion tensor. Define the three rotationally independent principal tensor invariants, I1 = Trace(D), I3 = Det(D), I2 = I3Trace(D-1) and the Frobenius norm ||D|| which is the root ofI4 = Trace(D 2
)= I1 2
- 2I2. The mean apparent diffusivity coefficient is defined as ADC = µ(D) = I1/3. In addition, define the fractional tensor anisotropy index, FA (Pierpaoli and Basser, 1999).
2
4
( )
1 I
FA
I σ
∝ D = −
D . (10)
It has also been demonstrated by Hasan et al. (2001b) that the three principal invariants can be used in the computation of the eigenvalues and the orthonormal eigenvectors of the tensor and in relating different tensor anisotropy measures.
ERROR ESTIMATION OF THE
DIFFUSIVITIES AND ENCODING
QUALITY FIGURES-OF-MERIT
The covariance matrix of the estimated diffusivities (Peebles, 1993; Rust, 2001) is given by:
(
t -1 t)
(
t -1 t)
-1ˆ ˆ
cov(d) = (H H) H cov(Y) (H H) H (11) Eq. 7 predicts that the cov(
Y
) depends on theb-factor, the I(0) and I(k) SNR levels. The log-linear functional relationship also couples the cov(
d
) to theestimated unknown values
d
(Anderson, 2001). InThe structure of the encoding matrix is important in performing the inversion procedure as well as defining figures-of-merit, such as condition number, energy, variance, etc., to optimize the spatial distribution of the encoding vectors. We define the total tensor variance as
T V D
D
iji j
( )
=
(
)
=
=
∑
∑
3 1σ
1
3 2
, (13)
and the encoding matrix condition number as
c o n d
e ig v a ls
e ig v a ls
( )
m a x (
( ))
m in (
( ))
H
H
H
=
. (14)Borrowing from the analogy with the electrostatic repulsion problem of Ne identical unit charged pairs we compute the interaction energy, E, of Ne identical pair charges positioned at £ on the surface of a unit sphere (Conturo et al., 1995; Jones et al., 1999; Hasan
et al., 2001).
E
g k
g r
r N k r
Ne e
=
−
=>
∑
∑
1
1 2 2
( ) ( )
. (15)Note that since the unit charges are constrained to the surface of a unit sphere, ||£(k)||=1, we obtain the value for the relative distance matrix element
Rkr = || £(k) - £(r) || = 2sin(γkr/2), where γkr is the angle between the two unit vectors £(k) and £(r). To attain an equilibrium state or configuration with minimum energy, the angle between any two encoding vertices of some encoding set has to be as large as possible.
REVIEW OF OPTIMIZATION AND
SPATIAL DISTRIBUTION METHODS
In general, the distribution of tensor shapes and orientations are not known a priori for a given tissue of interest. Consequently, it is normally assumed that the optimum encoding set will have uniformly distributed (UD) directions over a sphere. Several optimization methods have been reported to distribute the encoding Ne vertices on the diffusion gradient encoding sphere (Hasan et al., 2001a). These methods can be classified into three main approaches: heuristic, natural (polyhedral), and numerical. The heuristic sets use combinations of the cubic vertices; these sets use the sides (orthogonal: x or y or z), corners (tetrahedral: x and y and z) (Conturo et al., 1995; 1996) and edge bisectors of the cube (x and y, x and z, y and z) (Basser and Pierpaoli, 1998). Heuristic sets can provide Ne = 6, 7, 10, or 13 directions; these sets are not generally uniformly
of orthogonal and tetrahedral encoding with Ne = 7 directions (Shimony et al., 1999; Hasan et al., 2001a). The analytical solution for uniformly distributing unit vectors on the sphere is an unsolved problem in mathematics for an arbitrary number Ne required for tensor encoding (see references in Hasan
et al., 2001a). The solution exists only for the
icosahedron (20-faces, 12-vertices, 30 edges) and its dual the dodecahedron (12-faces, 20-vertices). The icosahedral vertex, face and edge centroids can thus provide 6,10 and 15 directions. Face triangularization can also provide more discrete sets with Ne = 5n
2
+ 1, n = 1,2,3,.… (Hasan et al., 2001a).
For an arbitrary number of encoding directions
Ne > 6, the spatial distribution problem can be solved by numerically optimizing and ordering tiles of equal solid angles on a unit sphere (Hasan et al., 2001a). The optimization cost function can be minimized using the constrained least squares method subject to the scalar figure of merits discussed earlier. A comparison of numerical optimization criteria, including minimum condition number (MC) (Skare et
al., 2000), minimum tensor variance (MV)
(Papadikas et al., 1999), minimum force (MF) (Jones
et al., 1999) and minimum energy (ME), has been
investigated previously (Hasan et al., 2001a). The minimum force and energy approaches establish an analogy with the electrostatic interaction problem of
Ne identically charged pair dipoles constrained on the surface of a sphere. The minimum energy approach proved to be the fastest to converge, and it was able to give the natural icosahedral set for Ne = 6 (Hasan
et al., 2001a). The numerical sets generated have to
be further balanced to minimize the linear cross term couplings. The balancing adjusts the sign of each encoding diffusion gradient vector and seeks to minimize the magnitude of the net sum
( )
g k
k N e
=
∑
1
= 1. The balanced numerical sets can then be called UD tensor encoding isotropic sets.
MATERIALS AND METHODS
DIFFUSION TENSOR IMAGE
ACQUISITION EXPERIMENTS:
PARAMETERS AND SUBJECTS
The imaging and diffusion tensor parameters were
TR /TE /δ/∆ = 9000/65/16/21 ms with Gmax = 40
mT/m at 3Τ. The sequence was a spin-echo prepared EPI (see Fig. 2) that utilized a ramp and partial ky sampling. The image matrix = 256 × 256,
FOV = 240 mm, # slices/slice thickness/space between slices = 39/3 mm/0 mm. The gradient strength was tuned to achieve a b-factor of b = 1000 s.mm-2. An optimum tensor encoding scheme with Ne = 12 directions (numerically balanced minimum energy - ME12) was used. At 1.5T, full brain DTI data was acquired with the ME23 (Ne = 23) tensor encoding set and with TR /TE /δ/∆ = 4000/72/16/21 ms and
Gmax = 40 mT/m. The number of b ~ 0 images, I(0), used was Nref= 4.
IMAGE AND DTI PROCESSING
The DW magnitude images (after complex k-space 2d-fft construction) were averaged by the scanner. The data were then corrected for motion and distortion using the Automated Image Registration Package (AIR) (Wood et al., 1998). The registration template, for each diffusion weighted image, was selected based on a diffusion weighted image that shows the least distortion and sensitivity to the diffusion along the phase encoding direction. The diffusion tensor decoding, anisotropy computation and visualization of the raw and diffusion tensor model were constructed according to the formalism in the theory using a custom developed IDL-MATLAB DTI toolbox.
BOOTSTRAP EVALUATION
EXPERIMENT
A single section DTI data set was acquired for Bootstrap statistical analysis. Data were acquired by repeating the measurements for different encoding schemes according to NT = Nref + NdNe. The Bootstrap is a computer-intensive, non-parametric statistical method that is done by randomly resampling the original data pool (with replacement) for the Bootstrap number of trials, NB> 1000 (Efron and Tibshirani, 1993). The advantage of the Bootstrap analysis over Monte Carlo simulations is that the latter assumes that the measurement noise distribution is normally distributed; whereas, the former works on experimentally measured data with no a priori assumptions on the noise distribution (Pajevic and Basser, 1999). Here the comparison was done at equal imaging time (Hasan et al., 2000) for different tensor encoding schemes and different
to provide the distribution of any DTI metric on a single voxel basis as well as the variance of the DTI scalar and vectorial maps. The Bootstrap iteration was performed efficiently, using the analytical diagonalization approach (Hasan et al., 2001b). To reduce memory usage, the Bootstrap variance in some scalar function f is estimated using the real-time expression: σΒ2(f) = E(f)2 - E(f2), where E(f) refers to
the expected value <f>.
RESULTS
THE RELATIONSHIP BETWEEN
TENSOR ENCODING SCHEMES
To study the relationship between different encoding schemes, the analytical encoding method suggested by Hasan et al. (2001a) was used. The method constructs the simplest encoding vector matrix for Ne = 6 from cyclic permutations of the normalized vector g x( )
[
]
x x t = + ± ± 1 1 1 0
2 , which
can be constructed from the rows of the generating encoding set Em t x x x x x x x x ( ) = + − − − 1 1
0 0 1 1
1 1 0 0
0 0 1 1
2 , (16)
where x is a variable that allows analytical computation. The H matrix is given by (Eq. 6)
H ( )x x x x x x x x x x x x x x = + − − − 1 1
1 0 2 0 0
1 0 2 0 0
0 1 0 0 2
0 1 0 0 2
1 0 0 2 0
1 0 0 2 0
2 2 2 2 2 2 2 (17)
This analytical and general encoding matrix gives three familiar cases. For x=1 we obtain the cube edge bisectors described by Basser and Pierpaoli (1998); this encoding scheme is referred to here as the double oblique gradient scheme (ODG). The principal icosahedral encoding scheme is obtained for
x = xicosa = 2cos(π/5) = 5 +1
2 and x = τ =
1/xicosa= 5 -1
obtained with x = xmc=5 ± 21
2 , with condition number = 7
2 . The icosahedral family is the only uniformly distributed set with Ne = 6. The minimum energy spatial distribution algorithm will also provide uniformly distributed sets for arbitrary Ne including
Ne = 6. In Fig. 3, we plot four scalar functions versus
x for the minimum energy, variance, condition
number and minimum angle between any two pairs constrained to the unit encoding sphere. Notice that 1) the minimum energy and minimum variance scheme is provided by the icosahedral set, 2) the encoding sets at x = 1 and x = xmc have the same tensor variance and are biased as illustrated by the minimum angle plot, 3) the minimum condition criterion does not yield uniformly distributed encoding directions, nor does the commonly used (ODG) encoding scheme for x = 1, and 4) the icosahedral solution at x = τ is expected to be more
stable to small perturbations or errors in the design diffusion gradient directions.
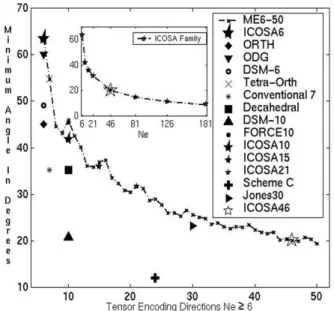
ENCODING SCHEME MINIMUM ANGLE
TEST
Fig. 4 compares the minimum angle computed from the vector dot product of all pairs in a family of isotropic icosahedral encoding sets constrained to the unit encoding sphere, as well as other heuristic approaches. The icosahedral family is used to provide the theoretical values. Note that the observations made in the previous section are still valid. In addition, the minimum energy encoding sets (ME) are indistinguishable from the icosahedral for Ne = 6, 21, and 46. The Conventional-7 (x, y, z, xy, xz, yz, xyz), Jones30, and Force10 encoding schemes are described by Jones (1999). The decahedral, DSM-6 and DSM-10 are minimum condition sets, as generated by Skare (2000). The ORTH scheme uses x, y, z, xy, xz, and yz cubic vertices. The scaled tetra-orth scheme is used in Shimony (2000) and Nye (1957). The minimum angle is a sensitive test to characterize the bias and sensitivity of tensor encoding sets. The angle has to be as large as possible when an optimal UD configuration is attained. Fig. 5 shows a triangularization of the minimum energy and icosahedral sets. Notice that the ME procedure can generate isotropically distributed encoding sets with
arbitrary Ne; whereas, the icosahedral based sets are limited to the discrete values of Ne = 5n2 + 1,
n = 1,2,3,4…. (Hasan et al., 2001a).
Fig. 3. Scalar functions obtained from the analytical
encoding matrix. The energy, variance, condition number and minimum angle as function of the variable, x..
Fig. 4. A summary of the minimum angle subtended
Fig. 5. Triangularization of several isotropically
distributed tensor encoding sets; mainly icosahedral (with discrete Ne values of 6, 21,46, and 126) and
minimum energy (numerical) sets with Ne = 6, 12, 24
and 48.
APPLICATION OF UD SETS AND
VALIDATION OF ISOTROPIC
PRINCIPAL VECTOR IN THE HUMAN
BRAIN
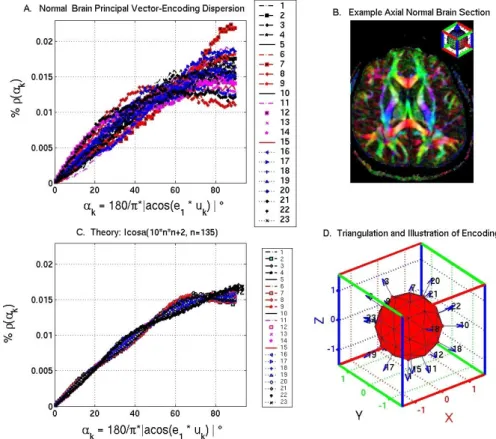
In this section we seek to study the distribution of the principal eigenvector in a normal human brain DT-MRI data set. A full brain DT-MRI set was obtained from a healthy male volunteer. A balanced ME23 encoding scheme, acquired at 1.5T, was used. The relative angle between the principal eigenvector and each of the 23 directions was computed. In addition, the same procedure was applied on the vertex directions obtained from the triangularization of the principal icosahedron with a total number of vertices almost matching the number of voxels in the normal human brain, 10n2 + 2 for n = 135. Fig. 6 shows that the normal subject’s brain principal vector with FA > 0.2 is approximately distributed in all directions. Notice the resemblance with the predicted theoretical relationship for a uniformly distributed vector field: dN(α)/dα ~ sin(α) (Mardia and Jupp, 2000).
Fig. 6. A test of the isotropic distribution of brain fibers hypothesis on a normal subject (A,B). The expected
BOOTSTRAP VALIDATION OF
ISOTROPIC TENSOR ENCODING
ADVANTAGE N
E_
6
Fig. 8 illustrates the application of the multi-dimensional Bootstrap statistical method in the study of tensor metric (e.g., ADC, FA) dependence on the DTI parameter space. The figure shows the expectation values of ADC, FA and their corresponding errors for equivalent imaging times. The standard error and total variance maps of the ME6 (ICOSA6, Ne = 6), ME12 and ME24 are noticeably smaller than the heuristic ORTH, ODG and ME48 schemes. Note that an optimal isotropic tensor encoding scheme may have 6 < Ne < 24 for the quoted image parameters.
In Fig. 9, the single voxel bootstrap distributions of ADC and FA are shown for two low and high anisotropy representative voxels at two different SNR levels for the icosahedral encoding scheme. The lowest SNR level corresponds to an SNR value of about 40, NT = Nref + NdNe = 55. Note that 1) the distribution is approximately normally distributed, 2) the anisotropy is generally overestimated at low SNR and low anisotropy and 3) since the three eigenvalue images are combined to obtain the ADC we expect the ADC to be less biased to noise than the tensor fractional anisotropy index, FA. In Fig. 9, the single voxel angular dispersion of the principal eigenvector,
e1, is shown for different encoding schemes, low and high anisotropy voxels and two SNR levels. The reference vector, eref, is computed from the highest SNR possible for each encoding set. The analysis is done as a function of the tensor encoding scheme, SNR and anisotropy. Constant total acquisition times,
TE, TR, b, I(0), etc. were maintained. The encoding sets compared have Ne = 6, 12, 24 and 48.
DISCUSSION AND
CONCLUSIONS
Diffusion tensor imaging is a sensitive modality that is very promising in radiological and psychiatric applications (Le Bihan et al., 2001; Melhem et al., 2002). A full brain DT-MRI exam can be obtained in less than 10 min using the single shot echo-planar method (see Fig. 10). An efficient, accurate and specific DTI experiment seeks to partition the total imaging time into the different parameter space variables to obtain high quality images with minimal artifacts. The data sufficiency condition for tensor decoding requires at least seven independent measurements. Without a priori knowledge about the full brain fiber distribution, the encoding directions
are required to be uniformly distributed over the encoding unit sphere in order to reduce the encoding directional bias. This work has presented the fundamental aspects of the MRI based single diffusion tensor encoding and estimation theory. This work discussed some criteria (figures-of-merit) for the evaluation and optimization of single tensor encoding directions assuming a two-diffusion weighting scheme. The icosahedral and minimum energy sets have been found to be optimal for single tensor encoding when the tensor distribution is uniformly distributed. This work also related the minimum condition set with Ne = 6 to a commonly used tensor encoding scheme (ODG). The minimum condition criterion does not lead to uniformly distributed tensor encoding sets.
The Bootstrap non-parametric statistical method was used at equal imaging time to study the tensor encoding advantage with more than the least required optimal six icosahedral vertices. The Bootstrap method is less restrictive than the Monte Carlo approach and is more useful in obtaining the distribution of any DT-MRI related map. This work shows that minimum energy sets with 6 ^ Ne^ 24 are able to reduce the total tensor variance and the variance in the estimated ADC and FA maps. The observations made on the behavior of the heuristic ORTH and ODG and minimum variance encoding schemes were confirmed with the Bootstrap method and are consistent with an earlier study using Monte Carlo simulations (Hasan et al., 2001a). The Bootstrap evaluation results in this work, although limited to one section and one subject, are useful in providing feedback on the protocol design. The Bootstrap method presents a framework to test the effect of other important DTI parameters, that have not been addressed directly in this paper, such as Nref and the b-factor on the accuracy of the estimated tensor (Xing et al., 1997; Cercignani and Horsfield, 1999; Jones et al., 1999). The SNR-anisotropy-encoding-angular dispersion results are useful also in optimizing and regularizing fiber tracking algorithms. Tensor encoding with uniformly distributed sets seems to be more justified for whole brain studies, as it has been demonstrated that the human brain fiber orientations can sweep all possible orientations. In addition, tensor encoding with the sufficient icosahedral set with Ne = 6 and optimal sets with
studies with more subjects are needed to evaluate the theoretical predictions and the experimental observations presented in this work at 3 T.
ACKNOWLEDGMENTS
This work was funded by the American National Institute of Health Grant NIMH R01-6215. The editorial assistance of Marci Harris and Michael Anderle is appreciated.
REFERENCES
Alderman DW, Sherwood M, Grant D (1990). Two-dimensional chemical-shift tensor correlation spectroscopy: analysis of sensitivity and optimal measurement directions. J Magn Reson 86:60-9. Anderson AW (2001). Theoretical analysis of the effects of
noise on diffusion tensor imaging. Magn Reson Med 46(6):1174-88.
Axer H, Berks G, Keyserlingk DG (2000). Visualization of nerve fiber orientation in gross histological sections of the human brain. Microsc Res Tech 51(5):481-92. Basser PJ, Mattiello J, Le Bihan D (1994). Estimation of
the effective self-diffusion tensor from the NMR spin echo. J Magn Reson B 103(3):247-54.
Basser PJ, Pierpaoli C (1998). A simplified method to measure the diffusion tensor from seven MR images. Magn Reson Med 39:928-34.
Basser P (2002). Relationships between diffusion tensor and q-space MRI. Magn Reson Med 47(2):3.
Cercignani M, Horsfield MA (2001). The physical basis of diffusion-weighted MRI. J Neurol Sci 186:S11-4. Cercignani M, Horsfield MA (1999). An optimized pulse
sequence for isotropically weighted diffusion imaging. J Magn Reson 140(1):58-68.
Conturo TE, Mckinstry RC, Aronovitz J, Jeffry JN (1995). A Diffusion MRI: precision, accuracy and flow effects. NMR Biomed 8:307-32.
Conturo TE, McKinstry RC, Akbudak E, Robinson BH (1996). Encoding of anisotropic diffusion with tetrahedral gradients: a general mathematical diffusion formalism and experimental results. Magn Reson Med 35(3):399-412.
Efron B, Tibshirani RJ (1993). An Introduction to the Bootstrap. New York: Chapman & Hall.
Gass A, Niendorf T, Hirsch JG (2001). Acute and chronic changes of the apparent diffusion coefficient in neurological disorders--biophysical mechanisms and possible underlying histopathology. J Neurol Sci 186:S15-23.
Hasan KM, Parker DL, Alexander AL (2000). Bootstrap analysis of DT-MRI encoding techniques. 8th Annual ISMRM, 792.
Hasan KM, Basser PJ, Parker DL, Alexander AL (2001b). Analytical computation of the eigenvalues and eigenvectors in DT-MRI. J Magn Reson 152(1):41-7. Haueisen J, Tuch DS, Ramon C, Schimpf PH, Wedeen VJ,
George JS, Belliveau JW (2002). The influence of brain tissue anisotropy on human EEG and MEG. Neuroimage 15(1):159-66.
Hoehn-Berlage M (1995). Diffusion-weighted NMR imaging: Application to experimental focal Ischemia. NMR in Biomed 8:345-58. http://www.ujf-grenoble.fr/ismrm/Diffusion/diffusion_outline.htm Hsu EW, Muzikant AL, Matulevicius SA, Penland RC,
Henriquez CS (1998). Magnetic resonance myocardial fiber-orientation mapping with direct histological correlation. Am J Physiol 274(5 Pt 2):H1627-34. Jones DK, Horsfield MA, Simmons A (1999). Optimal
strategies for measuring diffusion in anisotropic systems by magnetic resonance imaging. Magn Reson Med 42:515-25.
Le Bihan D (1995). Molecular diffusion, tissue microdynamics and microstructure. NMR Biomed 8(7-8):375-86.
Le Bihan D, Mangin JF, Poupon C, Clark CA, Pappata S, Molko N, Chabriat H (2001). Diffusion tensor imaging: concepts and applications. J Magn Reson Imaging 13(4):534-46.
Makris N, Worth AJ, Sorensen AG, Papadimitriou GM, Wu O, Reese TG, Wedeen VJ, Davis TL, Stakes JW, Caviness VS, Kaplan E, Rosen BR, Pandya DN, Kennedy DN (1997). Morphometry of in vivo human white matter association pathways with diffusion- weighted magnetic resonance imaging. Ann Neurol 42:951-62.
Manly BFJ (1997). Randomization, Bootstrap and Monte Carlo Methods in Biology. New York: Chapman & Hall. Mardia KV, Jupp PE (2000). Directional Statistics.
Chichester: John Wiley & Sons, 159-92.
Melhem ER, Mori S, Mukundan G, Kraut MA, Pomper MG, van Zijl PC (2002). Diffusion tensor MR imaging of the brain and white matter tractography. AJR Am J Roentgenol 178(1):3-16.
Mori S, Kaufmann WE, Davatzikos C, Stieltjes B, Amodei L, Fredericksen K, Pearlson GD, Melhem ER, Solaiyappan M, Raymond GV, Moser HW, van Zijl PC (2002). Imaging cortical association tracts in the human brain using diffusion-tensor based axonal tracking. Magn Reson Med 47(2):215-23.
Norris DG (2001). The effects of microscopic tissue parameters on the diffusion weighted magnetic resonance imaging experiment. NMR Biomed 14(2):77-93.
Papadakis NG, Xing D, Huang CL, Hall LD, Carpenter TA (1999). A comparative study of acquisition schemes for diffusion tensor imaging using MRI. J Magn Reson 137:67-82.
Peebles PZ (1993). Probability, Random Variables, and Random Signal Principles. New York: McGraw-Hill, 134-62.
Pierpaoli C, Basser PJ (1999). Toward a quantitative assessment of diffusion anisotropy. Magn Reson Med 36:893-906.
Rust BW (2001). Fitting nature's basic functions part I & II. Computing in Science and Engineering 3(5-6):84-69, 60-66.
Shimony JS, McKinstry RC, Akbudak E, Aronovitz JA, Snyder AZ, Lori NF, Cull TS, Conturo TE (1999). Quantitative diffusion-tensor anisotropy brain MR imaging: normative human data and anatomic analysis. Radiology 212(3):770-84.
Skare S, Hedehus M, Mosley ME, Li TQ (2000). Condition number as a measure of noise performance of diffusion tensor data acquisition schemes with MRI.
J Magn Reson 147(2):340-52.
Stejskal EO, Tanner JE (1965). Spin diffusion measurements: spin echoes in the presence of a time-dependent field gradient. Journal of Chemical Physics 42:288-92.
Taylor DG, Bushell MC (1985). The spatial mapping of translational diffusion coefficients by the NMR imaging technique. Phys Med Biol 30(4):345-9.
Wall CJ, Kendall EJ, Obenaus A (2000). Rapid alterations in diffusion-weighted images with anatomic correlates in a rodent model of status epilepticus. AJNR Am J Neuroradiol 21(10):1841-52.