U Sa Jen Mog and Dr. Jahar Debbarma Page 361 SOCIO-ECONOMIC STATUS OF TRIBAL COMMUNITIES IN TRIPURA
U Sa Jen Mog
Ph. D Scholar, Department of Economics, Tripura University, Tripura(India)
Dr. Jahar Debbarma
Associate Professor, Department of Economics, Tripura University, Tripura (India)
Abstract
Tribes in the Indian context have been defined as groups remaining outside of the structures of State and civilisation.. The level of the socio-economic development varies considerably between tribal and non-tribal population, between one tribe and another tribe and even among different sub-group of tribal groups. Number of programmes have been taken by Central and State Government, individually or collaboratively to develop the level of wellbeing of backward population. Besides those programmes, several Non Government Organizations are also providing their best effort to upgrade tribal communities. Still there is considerable percentage of tribal populations are living below poverty line. Though they are relatively better than the past but in relation to their standard of living, most of the tribal people have low quality of livelihood. These disparities and diversities make tribal development and micro level planning of tribal at the grass root level imperative. It is also a fact that more than ninety percent of the Scheduled Tribe population depends upon agriculture and allied activities in the State. Tribal people in the State more or less depend on the Government job and because of the fact that the industrial sector is not developed. From the study it transpires that the State could achieve development in many sectors and therefore, tribal areas are remaining neglected.
Key words: Collaborative, Literacy, Poverty line, Socio-economy and Wellbeing.
Introduction
The twin concepts of deprivation and discrimination are closely interconnected with tribe and race. In Indian context, Schedule Tribe (ST) and Schedule Caste (SC) are the marginalized social groups. Historically, these groups have been suffering from discrimination and exclusion from the mainstream population in economic and social spheres. Even after 70 years of Independence, there is still visible inequality between marginalized (STs& SCs) and mainstream population in case of major human
development components and socio-economic variables.
The Article 366(25) of Indian Constitution described that, "Scheduled Tribes" means such tribes or tribal communities or parts of or groups within such tribes or tribal communities as are deemed under article 342 to be Scheduled Tribes for the purposes of this Constitution. The Schedule Tribe population constitutes (disadvantaged group) 8.6 percent of the total population of the country as per 2011 census. The overall lower socio-economic position of the STs, made the framers of the constitution, realise that unless some special provisions for safeguarding the interest of the segment of people is made, they will remain backward for centuries. As a result some specific provisions have been incorporated in the Constitution to provide social justice to the members of their tribes through protective discrimination. Consequent of these protective discrimination policies, no doubt, since Independence improvement in social and economic conditions has been recorded among these categories of the society, but desirable outcome is still far away from the reality. In Tripura, total tribal population according to 2011 census is 36, 73,917, which accounts for 31.75 percentage of the whole population of the state. As recognized by the Indian constitution there is 19 tribes in Tripura (Economic Review of Tripura, 2014-15). Good numbers of tribal families are preview of below poverty line and the literacy rate of tribes is below the state average. Dhalai district is having highest number of tribal population with 2, 10,608 people and accounting for 78.92% percent of the total tribal population. About 96 percent of tribe lives in rural areas and their livelihood mostly depends upon agriculture &are engaged in shifting cultivation (jhum). Among the tribal groups in Tripura there is a diversification in cultural, social and economic and the difference in the level of attainments of various aspects of their wellbeing particularly in the socio-economic positions. It was observed that some level of qualitative improvement in the life and living standards of the rehabilitated shifting cultivators, (Bhowmik-2013). Therefore, it will be of paramount importance to study and compare the level of attainment in respect to their socio-economic status amongst different major tribes of Tripura.
Literature Review
U Sa Jen Mog and Dr. Jahar Debbarma Page 362 institutions has conducted studies dealing with
socio-economic impact on tribes after independence. On the basis of the extensive literature reviewed undertaken; few relevant literatures are appended below:
The term „tribe‟ originated around the time of the Greek city-states and the early formation of the Roman Empire. The Latin term, “tribus” has since been transformed to mean, “A group of persons forming a community and claiming descent from a common ancestor” (Oxford English Dictionary). According to anthropologists, Majumdar & Madan(1956), tribe as a social group with territorial affiliation, endogamous with no specialization of functions ruled by tribal officers hereditary or otherwise, united in language or dialect recognizing social distance with other tribes or castes. Sukai (2010) in the article “Tribal Development in India: An Overview” stressed up on the intensive approach to the tribal problems in terms of their geographic and demographic concentration. The author opines that a lot more need to be done with concerted focus on the issues crucial to improve their status on par with the rest of the population. Kumar and Choudhary (2005) in their study “A Socio-Economic and Legal Study of Schedule Tribes, Land in Orissa, Bhubaneswar” analysed though land based resources are main livelihoods of tribal people, they have poor access to land and they have been affected by land loss through alienation of plain lands to non tribal and over 72 percent of them are living under the poverty line. The study conducted by Paul(2013) entitled “Income, Livelihood and Education of Tribal Communities in Kerala- Exploring inter community Disparities “considered 12 communities which constitute around 90 percent of the tribal population in the state. Standard of Living Index (SLI) has been constructed to understand the general living conditions of tribes taken into consideration the type of housing, availability of toilets, drinking water, and possession of durable assets, cooking fuel used and energy used for lighting. Each indicator was given scores in the band of one to three, where 1 is given for minimum value or poor quality living, 2 for medium value and 3 for maximum value or best quality of living available in tribal region. Descriptive statistics has been used to test the differences data collected. To check for the mean differences, author used ANOVA. The study shows that majority of the tribal communities depend on primary sector for their livelihood, the spread in the main source of employment is more among the forward tribes. In Government job the tribal communities are under representation only 9 Government departments out of 71 have managed
to fill the vacancies as per the reservation criteria for schedule tribes.
Scenario of Tribal Development in North East India: The strategy for tribal development requires, defining in clear terms, the contexts of development for tribal which are bound to be different from the national contexts as described by Goswami (1984) in the article “Tribal Development with special reference to North-East India”. In the study on “Tribals in Transition: A Socio-Economic Study”. Similarly in the study conducted by Lollen (2000) “Impact of development planning on tribal communities: A case study of Arunachal Pradesh” focused on four tribal communities the Adi, Apatani, Khamti and Sulungs communities and opined that the impact of development measures has notbenefited those who deserved it the most. Tribal Development in Tripura: Tribal society in Tripura does not own much assets except personal belongings. The jhumia settlement scheme, which was introduced since 1953-54, has created a new dimension in the problem of socioeconomic adjustment of the Tripura Jhumias. The Jhumia settlement scheme has introduced a new dimension in the problem of socioeconomic adjustment of Tripura Jhumias, the impact of which will be unavoidably felt in the years to come was the observation of Mishra (1976).Ganchoudhury (1980) in the article “The Perennially Charming Tripura”, narrated that the search for resourceful forests, inter-tribal feuds, and uncanny incidents were the reasons for the migration of the tribal communities. On the other hand, the land granted by the Rajas and jobs and business opportunity induced many plains people to settle down in Tripura. Das Gupta (1993) in the book “Status of Tribal Women in Tripura” described that bride-price, is an indicator of the higher status enjoyed by specially Reang tribal women and the woman is thus the backbone of the Reang economy and household life. The study conducted by Sengupta(2013) “Shifting Cultivation and the Reang Tribe in Tripura” pointed out that Government programmes have widened social disparities among the Reangs and the settled cultivation that cannot sustain Reang tribe round the year, rather shifting cultivation, which aims at self-sufficiency, is still remunerative compared to other forms of cultivation.
Importance Of The Study
U Sa Jen Mog and Dr. Jahar Debbarma Page 363 cultivation. The productivity levels are much below
the level attained by their counterpart non-tribal farmers. The Jhumia survey conducted in 2015 revealed that the Jumia Tribal families account for seven percent of total tribal families in the State. Apart from practice of shifting cultivation, the main problem related to agriculture is lack of cultivable land and poor irrigation facilities. In the recent years State Government has introduced 20 points, 25 points and 37 points (Himswkang) programme for overall development in tribal area apart from implementation of other regular tribal development schemes. However, the official data reflects variation among the various aspects of development tribal people. The present study is, therefore, an attempt to examine the deprivation of the tribal communities of the State and formulate strategy for bringing about a radical improvement in the socio- economic status of the tribal population.
Objectives of the Study
The specific objectives of the study are as follows- 1) To examine the socio-economic status of tribes 2) To analyze the socio economic problems faced by tribes
Methodology
For the purpose of the study, the following methodology has been adopted:
Study area- Entire Tripura and All tribal communities have been considered for the purpose of the study. Source of Data: Secondary data used and have been collected from various Government institutions, agencies, books, Journals, websites etc.
Data analysis: Data has been analyzed using usual statistical tools like percentages, averages, figures, graphs, ratios etc.
Tribal Demography of the State
Tripura is one of the smallest states in North Eastern India. It is completely land locked and has a long international boundary with Bangladesh. It was a princely state ruled by the 184 Maharajas of Tripura. After Independence, Tripura was merged with India on 15th October, 1949. Thereafter, Tripura was administered by the Chief Commissioner appointed by the Government of India. The Tripura Territorial Council was constituted in 1956 with total members of 32 out of which 2 were nominated members. The Government of India declared Tripura, a fully fledged state on 21st January, 1972. The total population of Tripura during 2011 census is 36, 73,917 and tribal population is 11, 66,813 and whereas total
population in 1951 was 1, 73,325 and tribal population alone was 91,679. The population density of Tripura in the year 1951 was 61 and that stands 350 in 2011. There are two major racial groups, namely, Indo-Aryans represented by the Bengalese and Indo-Mongoloids represented by few communities like, Tripuri, Reang, Jamatia, Noatia, Kuki, Halam, Chakma, Mog and Lusai who are indigenous people in the state.
Variation of Tribal Population Ratio In The State The tribal communities are the original inhabitants of this state. The peaceful life of the tribal people has been changed due to the migration of a large number of refugees from East Pakistan. The partition of India is a curse and due to the creation of Pakistan, thousands of Hindu refugees are compelled to migrate to India in this nearest hill state of Tripura. The first recorded estimate of the population of Hill Tipperah is available for 1872 when it was only 35,262. In the later years this figure has been considered as an underestimate, and for valid reasons. As the system of collecting population date was still not well organized and its importance was even not properly understood, the estimate was made in a casual manner (Ganguli, 1983). The tribal life based on the cultivation of jhum and forest resources has been largely affected. At the time of Independence there was perfect peace in Tripura between the tribal and non-tribal people. After 1980, peace and harmony got disturbed. As a result, the State experienced communal and ethnic riots. It is evident that in 1931 the percentage of tribal population in the state was 50.26 percent, but after emergence with the India, the percentage of tribal population dropped down to 36.09 percent. This reduction in tribal population in the state has a great impact on the economy of the tribal people.
Literacy Rate among Tribal
U Sa Jen Mog and Dr. Jahar Debbarma Page 364 2011 census. Lack of literacy among tribal people
has been identified as a major development problem. Literacy level and educational attainment are vital developmental indicators in a developing nation like India as they are key variable of measure of development as they indicate quality of life, awareness level and also level of skill of people in the society. Better literacy and educational level definitely have a positive impact on the health
parameter too. Education parameters have an equal weight-age in the Human Development Index as well. Considering the importance of education, the Right to Education was enacted in the year 2009, to ensure free and compulsory education for children in the age group 6- 14 years which is rightly implemented in Tripura from the date of Enactment of the Act.
Table No. 1: Literacy Rate Comparison in between Tribal and Non-Tribal: Census
Year Total Literacy % Non-Tribal Literacy % Tribal Literacy % Gap
1961 20.24 - 10.01 -
1971 30.98 - 15.03 -
1981 42.12 - 23.07 -
1991 60.44 69.11 40.37 28.74
2001 73.20 76.80 56.50 20.30
2011 87.22 90.85 79.05 11.80
Source= Census reports.
Tribal Education Scenario
Education of tribal has always been a matter a great concern and the lack of it has always shows the negative impact on the development of section of people. The rural tribal children experience many difficulties in their studies. It seems that the teachers in tribal area are not adequately equipped with methods of instruction; students are usually hesitating to go to their teachers for guidance and help. Most of the Tribal students are first or second generation literate. On the other hand the teacher‟s community is not proactive for helping the desired tribal students. Majority of teachers have no special training for working in backward tribal areas. Moreover, inadequate number and untrained teachers in tribal schools are important reasons for slow progress of tribal education. Primary education in the rural and remote areas has suffered due to lack of proper institutional facilities, absence of interested teachers, study materials, lack of proper communication and other physical facilities in the primary schools as well as in upper primary schools.
U Sa Jen Mog and Dr. Jahar Debbarma Page 365 Table No. 2: Status of School &Colleges availability in ADC and Non-ADC area:
Category Total No. of Schools/ Colleges in the State
Sq. Km. within which 1 school/ college is available in entire state
Total No. of Schools/ Colleges in
ADC
Sq. Km. within which 1 school/ college is available in Tribal area High
Schools
541 06 222 32
Higher Secondary Schools
392 09 85 83
English Medium Schools
68 49 28 254
General Degree Colleges
22 152 03 2377
Source= Education Department, GoT.
TRIPURA TRIBAL AREA AUTONOMOUS DISTRICT COUNCIL AND THE EXPECTATION The Tripura Tribal Areas Autonomous District Council (TTAADC) was set up in 1982 under Seventh Schedule of the Constitution. Later, the Council was brought under 6th Schedule of the Constitution with effect from 1st April‟ 1985 to entrust more responsibilities and power to the Council. The geographical area of TTAADC is 7132.56 Sq. km out of the total area of 10491.69 Sq. km of the State. The State Government provides funds as grant to the TTAADC against State plan, share of Taxes and
transfer fund of scheme from different Departments for specific development projects. The planning and Co-ordination Department of the State Government decides the plan fund to be provided to the District Council in one financial year and such funds are provided from the budget of the Tribal Welfare Department. The tribal leader‟s expectation while creation of Tribal Autonomous District Council was manifold in respect of economic interests, tribal autonomy and self governance etc.. But the expectation leaves in vain while they experienced that the TTAADC is fully depend on the wish of State Government for governing its area and as per guidelines fixed by the State Welfare Department. Table No. 3: Variation of Tribal Welfare Department
Budget:-(Rs. In lakh)
Year 1984-85 1994-95 2004-05 2014-15
State total Budget(Rs.)
205.28 963.41 3097.22 12246.11
TW budget(Rs.) 8.07 58.17 77.28 141.09
Percentage of TW budget
3.93 6.03 2.49 1.15
U Sa Jen Mog and Dr. Jahar Debbarma Page 366 The allocation of funds for the development and
welfare of the Scheduled Tribes in the state has shown a steadily declining since last two decades. Allocations do not match the developmental needs and priorities of the Scheduled Tribes. Implementation of schemes makes matter worse. From the above table it is shown that during 1994-95, the percentage of annual budget allocation for Tribal welfare department was 6.03 percent and that reduced to 2.49 percent in 2004-05 and 1.15 percent in 2014-15. These allocations of budget do not indicate the welfare attitude towards tribal people of
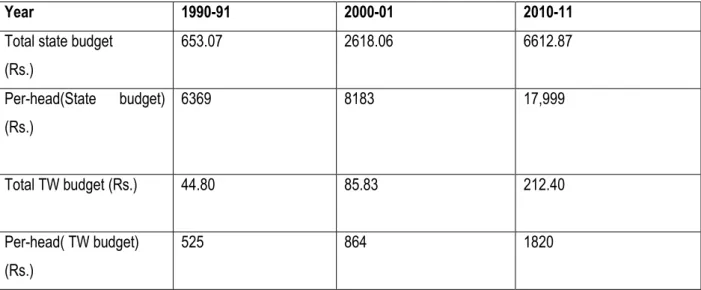
the state. Similarly, if we look into per capita budget allocation towards total State budget and Tribal Welfare Department budget, it may find that in the financial year 2010-11, the per head State budget allocation Rs. 17,999/-, where as the Tribal Welfare budget was only Rs. 1820/-.
Table No.4: State and TW per head budget position (Rs. In lakh)
Year 1990-91 2000-01 2010-11
Total state budget (Rs.)
653.07 2618.06 6612.87
Per-head(State budget) (Rs.)
6369 8183 17,999
Total TW budget (Rs.) 44.80 85.83 212.40
Per-head( TW budget) (Rs.)
525 864 1820
Source= Department of Finance, GoT.
Inappropriate Utilization Of Tsp Fund
Tripura before emerging with India was a tribal majority State has become a Tribal minority State over the past few decades. The dramatic variation in the demographic structure had its manifestations in terms of land alienation and feeling of deprivation among the tribes and there by resulting into ethnic tension. Therefore, a special strategy was adopted during the fifth five year plan (1975-79) for accelerated development of the Scheduled Tribes. This strategy is called Tribal Sub-plan (TSP). It is a mechanism under which each development department of the State Government is required to quantify and set apart an amount of their plan budget provision for implementation of schemes exclusively for the Welfare of Scheduled Tribes in Tripura. The fund so quantified shall not be less than the percentage of Scheduled Tribe population in the state. In 1995-96, an important decision was taken by the State Government to the effect that the fund earmarked as Tribal Sub-Plan should be booked
U Sa Jen Mog and Dr. Jahar Debbarma Page 367 Availability Of Basic Amenities In Tribal And
Non- Tribal Area
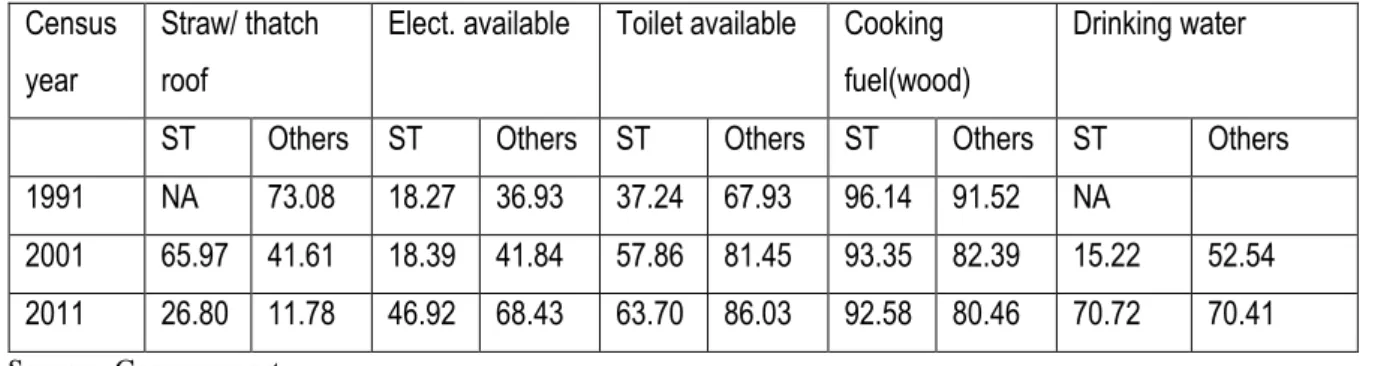
Availability of basic amenities to the communities is most essential parameter to measure the development progress of a particular area. The government has taken several steps for fulfilling of all such requirement of the public. Indira Awas Yojana and Prime Minister Griha Yojana schemes are providing rural housing to the needy tribal. Similarly, Gramin Vidyotikaran Yojana and drinking water schemes are continuing for providing all such basic amenities to the tribal people. But still there is gap of such requirements for fulfilling the need of
electricity, safe drinking water, toilets, and housing etc for tribal populous. From the above table it is shown that all those basic amenities are still unmatched. After attainment of Indian independence and adoption of the Constitution, Government has taken several initiatives to promote and protect the rights of the Scheduled Tribes and to secure their development but yielded only limited result. However, considerable improvements have achieved in terms of many development measures but in spite of that there is also wide gaps prevailing in between tribal and non-tribal in all respect. There may be many reasons for those gaps of developmental achievement like economic, social and political, etc.
Table No.5: Basic Amenities available with Tribal Household (in %)
Census year
Straw/ thatch roof
Elect. available Toilet available Cooking fuel(wood)
Drinking water
ST Others ST Others ST Others ST Others ST Others 1991 NA 73.08 18.27 36.93 37.24 67.93 96.14 91.52 NA
2001 65.97 41.61 18.39 41.84 57.86 81.45 93.35 82.39 15.22 52.54 2011 26.80 11.78 46.92 68.43 63.70 86.03 92.58 80.46 70.72 70.41 Source= Census reports.
Tribal Land Holding Position In Tripura
In Tripura there are more than 96 percent of Scheduled Tribes lives in rural areas and a
substantial percentage of rural population depend on cultivation.
Table No.6: Tribal Land holding position in Tripura:
Year Number of Holding Area (in Hect.) Average holding (in
Hect.)
National
Average
1995-96 96661 84533 0.87 1.77
2000-01 96661 114268 0.75 1.76
2005-06 151370 112648 0.72 1.64
2010-11 155802 123854 0.75 1.52
Source= Agriculture Census.
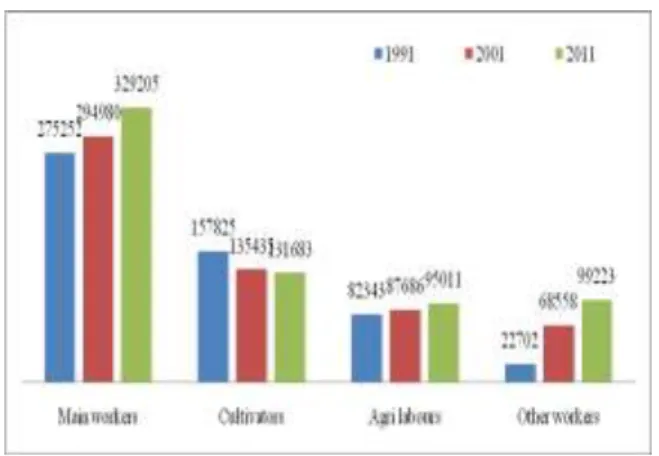
The above table depicts that average land holding of Scheduled Tribes is less than one hectare and the holding percentage are getting down in last 3 to 4 decades, resulting of that the landlessness family is increasing at a faster rate among the Scheduled Tribes. From the work participation table it also transpires that the number of Tribal cultivators are decreasing and agricultural laborers are increasing indicates that farmers are losing their land and they
U Sa Jen Mog and Dr. Jahar Debbarma Page 368 Table No. 7: Tribal Work Participation rate
Source= Census report. Distress Pockets In Tribal Areas
The definition given by State Government, “distress pockets” are those pockets where human basic amenities are not available and those places are more or less deprived from developmental activities. Report exhibits that there are altogether 141 nos. of distress pockets in the State (Dainik Sambad, dated 27th Dec‟16). Those pockets are spreading in four different districts i.e. in Dhalai, Khowai, North and Sipahijala District. In Dhalai District, there are 68 pockets in six Blocks area. In Khowai, 64 pockets in two blocks area, in North Tripura District 7 pockets in one Block area and in Sipahijala District, there are two distress pockets in one Block area. Reportedly, no such distress pocket is available in the Non-tribal area and development activities are much faster and advanced compare to tribal area.
Tribal Land Alienation And The Problem
Land alienation is one of the most important issues with the tribes in Tripura. In spite of appropriate
tenancy laws for the protection of tribal land there is a continuous process of land alienation by non-tribal. Generally, tribals are alienating their lands mainly for meeting their domestic expenses and for clearing their past debts. A large number of Bengali refugee families were settled in State after partition and creation of Bangladesh that put pressure on agricultural land and eventually put pressure on areas reserved for tribal, which were used by them for jhum cultivation. Study showed that prolonged indebtedness of the tribal households was the main cause of tribal land alienation. Report of the State Revenue Department, reveals that total 29,168 nos. of land restoration applications had been submitted with the department, but it is a matter of great concerned that out of which total 19,596 applications were rejected. State government should examine all such petition meticulously to restore tribal land if it at all would like to redress the sensitive land alienation matter. The State Government should also be more proactive in protecting the interests of tribal people and in preventing alienation of tribal land.
Traditional Jhum Cultivation And Its Present Scenario
Traditionally, most of the tribal population practiced shifting cultivation/jhum. A significant number of families are depending on jhum cultivation as their main source of livelihood (Ganguli 1968). In 1961 there were about 25000 families who were depending on jhum cultivation for their livelihood. By 1978, the number had increased to 46,854 families and by 1987, the number touched at 55,049 families. However, as per survey report done by TTAADC in 2015, the number of jhumia families came down at 16,948, which indicates that still 7% Tribal families are fully depend on shifting/ jhum cultivation.
Table No 8: Jhumia Survey Report:
Year Source No. of household No. of dependent people
1968 J. B Ganguly 25,000 -
1978 Benchmark Survey 46,847 2.59 lakh
1987 Benchmark Survey 55,049 2.88 lakh
1999 Tribal Welfare Dept. 51,265 -
2001 Agriculture Deptt. Survey - 2.97 lakh.
2007 Forest Department 27,278 1.36 lakh.
2015 TTAADC Survey( only hardcore jhumia considered)
16,948 -
Source: Tribal Welfare Dept. GoT. (2016) & Tripura HDR (2007)
U Sa Jen Mog and Dr. Jahar Debbarma Page 369 Inadequate Representation In Government
Services
The percentage of tribal population in the State is 31.75%. But the report of Tribal Welfare Department shows that the tribal employee‟s representation in the state is not adequate in respect of Government Departments and Autonomous Bodies. In the case of pure government department only 23 % posts are represented by the Scheduled Tribes and similarly, only 21.49% of Scheduled Tribe posts are represented in Autonomous Bodies. There has been demand for taking remedial steps to fill up of all Scheduled Tribe vacant posts in Government Department and Autonomous Bodies, in order to ensure adequate representation of Scheduled Tribes in public services as mandated by the Constitution. Adequate representation of tribal is, however, still a far cry and special efforts need to be made for effectively enforcing reservation of backward classes and to achieve their adequate representation in State services.
Summary and Conclusion
The study shows that majority of tribal people are depending on agriculture and most of them reside in rural areas. It is fact that the State could achieve development in many sectors but tribal areas are remaining neglected. Tribal people in the State depend on the service sector (Government) because of the fact that the industrial sector is not developed. Therefore, based on the above analysis and discussion it is to draw the following broad conclusions with regard to the status of tribal community in the state.
Allocations for tribal development grossly inadequate and it should be enhanced and spent exclusively for their welfares. Tribal welfare budget allocation has decreased over the years from 6.03% to 1.15% of total state budget. Thus, for over all development of Tribal communities, the budget must be earmarked at least 10% of total State budget. Measures are needed to ensure availability of adequate public funds for the welfare of the Scheduled Tribes and for ensuring funds allocation which must exclusively be used for their overall welfare.
Education of tribal has always been a matter a great concern. Efforts have been taken to increase Tribal literacy rate but still there is gap of 11.80 % with the non-tribal literacy rate. Report reveals that in Tribal area; there is one high school within a 32 k. m‟s radius, where as in case of non-tribal area, one high school within 6 k. m‟s radius. Therefore, for better performance of tribal education and higher percentage of literacy rate, more educational
institution and with trained teachers, infrastructure must be provided in tribal area for improvement of present situation.
The TSP fund, so quantified, shall not be less than the percentage of Scheduled Tribe population in the state. As per decision the State Government Tribal Sub-Plan fund should be booked against the Budget Demand of the Tribal Welfare Department. It is fact that the TSP expenditure has increased during last decade, but there are many instances of utilizing the fund outside of TSP area. Care must be taken that the earmarked TSP fund should spend in tribal area for the purpose it was directed, giving due respect the provision of the TSP guidelines
As per agricultural census report, the operational Land holding of Tribal in the State is decreasing indicating that the tribal people are losing their land and becoming labour for their livelihood. Land alienation is one of the major issues among tribal communities. Tribals have lost their land once occupied either to settles or to encroachers and large number of tribal land restoration petitions were rejected in different level of Government institutions. These petitions need to be re-examining properly to redress the matter sympathetically. Similarly, there is quite number of Hardcore Jhumia families (7%) in the state who are fully depending on jhum cultivation. Proper jhumia settlement through horticulture and rubber based activities providing with all other basic facilities should be extended to them. Basic requirement i.e. housing, electricity, drinking water, toilet facilities are utmost necessary to all such tribal families. Besides, rejected land restoration applications are to be re-examined and genuine cases may be restored.
Inadequate percentage of Scheduled Tribes in State Government services is a matter of great concern. But that is surely symbolic of their empowerment and assures a sense of participation and share in governance. Effort must be taken to fulfil this cry and adequate representation for Scheduled Tribes in public services.
References
[1] Acharya, R. K. (1999). Insight into the Reangs. Agartala: Tribal Research Institute, Government of Tripura.
[2] Bera, G. K., & Bera, N. (2009). Echoes From the Hillocks- A Compendium on the Tribes of Tripura. Agartla: Tripura Bani Prakashani.
U Sa Jen Mog and Dr. Jahar Debbarma Page 370 [4]Choudhury, J. G. (1980). Tripura the land and its people.
Delhi-110035: Leeladevi Publication.
[5] Dasgupta, M. (1993). Status of Tribal Women in Tripura. New Delhi-110014: Vikash Publishing house Private Limited.
[6] Dewri, D. (2014). The Socio-Economic Position of the People of North-East India. In G. Pathak, North-East India-The Paradigm of Historical, Socio-Economic and Cultural Interaction (pp. 346-348). New Delhi-02: Jnanada Prakashan(P&D).
[7] Ganguli, J. B. (1983). The Benign Hills. Agartala: Tripura Darpan Prakashani.
[8] Goswami, A. (1984). Tribal Development with Special Reference to North-East India. Social Scientist , Vol. 12.
[9] Government of India. (2007). Research study on livelilhood options assets creation out of special component plan(SCP) and Tribal sub-plan(TSP) schemes and its impact among SC's and ST's in India. Yojana Bhawan, New Delhi-110001: Planning Commission. [10] Government of Tripura. (n.d.). 37 Point Package(HIMSWKANG).
Retrieved July 12, 2016, from www.twd.tripura.gov.in/37-point-package
[11] Government of Tripura. (2014-15). Economic Review of Tripura . Agartala: Directorate of Economics and Statistics Planning(Statistics) Department..
[12] Kumar, K., & Choudhary, P. R. (2005). A Socio-Economic and Legal Study of Schedule Tribes. Retrieved December 12, 2015, from www.freewebs.com
[13] Lollen, T. (2000). Impact of Development Planning on Tribal Communities: A Case Study of Arunachal Pradesh. Retrieved April
12, 2016, from
shodhganga.inflibnet.ac.in/bitstream/10603/15904/1/01_pdf [14] Majumder, D. N., & Madan, T. N. (1956). An Introduction to Social
Anthropology. Delhi-02: National Publishing House.
[15] Mishra, B. P. (1976). Socio-Economic Adjustment of Tribals. New Delhi-110055: Peoples Publishing House.
[16] Paul, B. P. (2013). Income,Livelihood and Education of Tribal Communities in Kerala- Exploring Inter Community Disparities.
Retrieved January 18, 2016, from
www.dyuthi.cust.ac.in/xmlui/bitstream/handle/purl/3554
[17] Sengupta, M. (2013). Shifting Cultivation and the Reang Tribe in Tripura. Economic & Political Weekly .
[18] Sukai, T. B. (2010). Tribal Development in India: an Overview. Kurukshetra , pp.03-05.