www.jyoungpharm.org | www.phcog.net
Comparative Study Among Drying Techniques in the
Development of Nimesulide Tablet
Marina Barra Rodrigues1, Antonio Cesar Honorato Barreto2, Edilson Martins Rodrigues Neto3,* Tamara Gonçalves de Araújo3 1Department of Pharmacy, IPOG - Instituto de Pós-graduação e Graduação, Belo Horizonte, MG, BRAZIL.
2Department of Physics, Federal University of Ceará Fortaleza, CE, BRAZIL. 3Department of Pharmacy, Federal University of Ceará Fortaleza, CE, BRAZIL.
ABSTRACT
Objective: The present work has as objective to evaluate the influence of the drying process of the granules in the drying stove and in the fluidized bed, as well as, as stages of compression in the formation of nimesulide drug polymorphism. Method: Two tests, TB02 and TB06 were produced in the same way, from weighing to granulation, but during the drying process the TB02 test was dried using the fluidized bed, while the TB06 test was oven dried. X-ray diffraction tests show that, in all samples, the nimesu-lide active remains crystalline. Result: Although both batches of test drugs show 85% release of nimesulide in 30 mins and the coefficient of variation values for the TB06 test weight and hardness tests are lower than the TB02 test, it was observed that the TB02 test showed the greater similarity fac-tor (F2) when compared to the reference drug. Conclusion: Thus, it can be concluded that the fluidized bed as a drying apparatus shows a greater
ef-ficiency and that the test drug TB02 can be considered as a pharmaceutical alternative to the reference medicine.
Key words: Nimesulide, Polymorphism, Comparative dissolution, Drying techniques, Similarity factor.
Correspondence
Prof. Edilson Martins Rodrigues Neto
Department Pharmacy, Federal University of Ceará Fortaleza, CE-60020-181, BRAZIL.
Phone: +55-85-33660000 Email: [email protected]
DOI: 10.5530/jyp.2020.12.9
This is an open access article distributed under the terms of the Creative Commons Attribution-NonCommercial-ShareAlike 4.0 License, which allows others to remix, tweak, and build upon the work non-commercially, as long as the author is credited and the new creations are licensed under the identical terms.
INTRODUCTION
The drug nimesulide (N- (4-Nitro-2-phenoxyphenyl) methanesulfon-amide) is a non-steroidal anti-inflammatory selective inhibitor of the enzyme cyclooxygenase (COX) type 2 and is chemically classified as an alkylsulfonamide because of its anti-inflammatory potency and thera-peutic safety profile.1 It is a weak acid practically insoluble in water and,
according to the Brazilian Pharmacopoeia 5th Edition, presents as a pale
yellow powder, crystalline, slightly unctuous to the touch, odorless and non-hygroscopic.2
Oral Solid Dosage Forms (OSDF) are the most used by the popula-tion and most prescribed by health professionals1 and present several
advantages when compared to other pharmaceutical forms, such as low production cost, good stability Physico-chemical and microbiological properties and the lower perception of the unpleasant taste and odor of certain active principles when compared with liquid forms, for example. OSDFs present as a unit dosage form offering greater dose precision and less variability in content, are also lighter and more compact than other oral dosage forms, so they are more easily transported, produced more easily on a large scale and with greater ease administration, dispensing the need for trained technical personnel.3
Tablets can be obtained by direct compression, wet granulation or dry granulation techniques (double compression) technique. Direct com-pression, where the powders are blended and then compressed, presents itself as the best production technique for the industry, due to the re-duction of process time and cost. However, this technique is only pos-sible because of the addition of special adjuvants, since most of the active principles do not have compressibility and lubrication characteristics, necessary to be directly compressed. The main objectives of the granula-tion, whether wet or dry, are aimed at improving the flow properties and compressibility characteristics of a powder mixture, as well as preventing
the segregation of the constituents.4-6 Dry granulation, also called
pre-compression or double pre-compression, is used for active principles that may suffer some form of degradation and / or instability against heat and / or moisture.7 When the drug has an unctuous appearance, as is the case
of nimesulide, its flow property is compromised and as a possible solu-tion to this problem the wet granulasolu-tion technique is used to produce tablets.8
The wet granulation technique includes, in addition to the mixing and pressing steps, the wetting and drying step. After the humidification pro-cess, any wet product must pass through the drying stage, which can be performed by various types of equipment, such as a stove, rotary dryer, spray dryer, pneumatic or fluidized bed. The main purpose of the dry-ing process is to remove or reduce a certain amount of moisture from the product to improve or maintain some specific characteristics such as mechanical strength, flow, grain size and the particles shape.9 The drying
time in the greenhouse may vary due to several factors: division of the product through the trays, temperature difference between the circulat-ing air and the product to be dried and the air circulation velocity along the equipment.9 In the fluidized bed, another widely used equipment,
the product is suspended in the air under vigorous agitation and each particle is surrounded by the hot air that is blown, giving greater drying efficiency to the system.9 In a generally way, after the drying step, the
product is routed to the mixing step and then to the compression.5
Production processes such as milling, wet granulation, drying and com-pression of powders can generate changes in the crystalline structure of the drug, known as polymorphic transformations and are often detri-mental to the effectiveness of the formulation.
higher energy form, meta-stable, will be tended to become the more sta-ble state. Therefore, the identification of the polymorphs is of great im-portance for the development of the product, since, during production or storage, the less stable form will tend to become more stable, leading to physical, chemical and pharmacological alterations.10,11
In some formulations, as in the case of nimesulide, the difference be-tween the two polymorphic forms causes difference of solubility of the active principle in the final product, which would disapprove the prod-uct in the bioequivalence study, since it would not reach the therapeutic response in the given time. For this reason, it is of the utmost importance identified in the upstream of the production process during the stages of the production process. The present work has as objective to evaluate the influence of the drying process of the granules in the greenhouse and in the fluidized bed, as well as, as stages of compression in the formation of nimesulide drug polymorphism.
MATERIALS AND METHODS
Materials
Nimesulide (AartDrugs), Lactose (DFE Pharma), Cellulose (Blanver), Crospovidone (Ashland), Colloidal Silicon Dioxide (Evonik), Talc (Mag-nesite), Vegetable Hydrated Oil (JRS Pharma), Sodium Saccharin (Vo-gler), Citric Acid (Cargill), lemon aroma (IFF Essências e Fragrâncias) and sodium cyclamate (Golden Time Chemical).
Tablets production
The components of the formulation (Table 1) were weighed in analytical balance (Brand: Ohaus). The active, the diluent and the disintegrant were sifted in 1.00 mm mesh and mixed using the High Shear (Brand: Saral). Then the blend was subjected to wetting followed by granulation using an oscillating granulator (Brand: Lawes) and routed to the drying step. After evaluating the moisture of the powder, it was added to the V-Mixer (Mark: Lemaq) along with the previously sieved lubricant, flavoring, acidifying agent, sweetener, disintegrant and diluent. With the aid of the compressor (Mark: Lawes) batches TB02 and TB06 of nimesulide tablets weighing 570 mg were produced.
The manufacturing process, from weighing to granulation, was the same for the two tests, TB02 and TB06, but during the drying process the TB02 test was dried using the fluidized bed (Brand: Saral) for a period of 29 mins at 45°C, while the TB06 test was oven dried (Mark: Lawes) for a period of 120 mins at 40°C. The drying time and temperature of both
processes were determined to obtain the same final moisture content of the samples.
Weight evaluation
20 tablets were individually weighed on the analytical balance (Mark: Ohaus). The tolerance range recommended by the Brazilian Pharmaco-poeia (2010)2 is 5% (weight greater than 250 mg).
Hardness determination
During the tablet production step, samples were taken to determine the hardness (n=10),2 sing a durometer (Mark: Erweka) and adjustment of
the compressor was performed from a predetermined range of variation (5 to 8 kgf).
Friability Determination
The friability test was performed using tablets (n=10), which were sub-mitted to the action of a friabilometer (Marca: Nova Ética), during a period of 4 mins (25 rpm). The result was obtained by the difference between the initial and final weight, measured as a function of the per-centage of powder lost. The value recommended by the Brazilian Phar-macopoeia (2010) is less than 1.5% of the established weight.2
Disintegration test
The Disintegration test was performed in a disintegrator (Brand: New Ethics) using 6 tablets, one in each tube of the basket with the addition of the disc. The water was used as the immersion medium and the tem-perature was maintained at 37 +/- 1°C. All tablets should disintegrate within 30 mins.
X-Ray Diffraction
The X-ray diffraction (XRD) measurements were obtained for samples after the drying process of tests TB02 and TB06, as well as of their re-spective tablets. The equipment used was the D8 Advanced from Bruker AXS, equipped with a goniometer θ⁄θ, Coupled to the transmission ge-ometry with fixed sample holder and Cu radiation source (transmission line Kα for 0,15419nm). The measurements were performed under an acceleration voltage of 40 Kv and a current of 40 mA in the Bragg Bren-tano geometry, ranging from 50 to 600, with a speed of 1º / min and a step
of 0.020 in continuous mode.
Dissolution Profile
The methodology used was described in the Brazilian Pharmacopoeia 5th Edition for the product under study. The dissolution assay was
per-formed in Phosphate Buffer pH 7.4 with 2% polysorbate 80 at 37°C un-der sink conditions for 60 mins. The dissolutor (Brand: Nova Ética) was used, with apparatus II (paddle), with agitation speed of 75rpm and vol-ume of the dissolution medium of 900 mL.2
Aliquots of the previously determined dissolution medium were re-moved (5.10,15,30.45.60). The samples were filtered and measured at wavelength of 392nm using the Shimadzu UV 2401PC spectrophotom-eter.
Comparative analysis of the dissolution profile
The results of the dissolution profiles were calculated and evaluated by the Simple Independent Model Method, which employs a similarity fac-tor (F2). The f2 facfac-tor is a logarithmic reciprocal square root transforma-tion of the sum of squared error and is a measurement of the similarity in the percent dissolution between the two profiles:
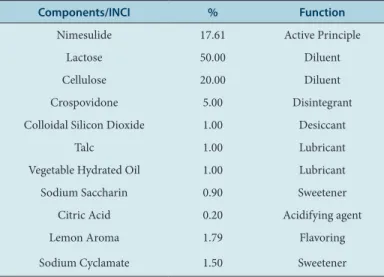
Table 1: Quantitative and qualitative formula of the tests.
Components/INCI % Function
Nimesulide 17.61 Active Principle
Lactose 50.00 Diluent
Cellulose 20.00 Diluent
Crospovidone 5.00 Disintegrant
Colloidal Silicon Dioxide 1.00 Desiccant
Talc 1.00 Lubricant
Vegetable Hydrated Oil 1.00 Lubricant
Sodium Saccharin 0.90 Sweetener
Citric Acid 0.20 Acidifying agent
Lemon Aroma 1.79 Flavoring
Since n is the number of collection times considered for the calculation of F2; Rt is percentage value dissolved at time t, obtained with the Ref-erence Drug or Comparator; Tt is the percent dissolved value of the Test Drug or the altered formulation at time t. According to Marcolongo et al. (2003) the comparison of dissolution profiles is useful for selecting
formulations during the pharmacotechnical development process, evalu-ating stability, optimizing formulations, evaluevalu-ating the effect of certain alterations on products already in commercialization and, for to estab-lish the similarity between formulations.13
The f2 value is equal to 100 when the test and reference profiles are iden-tical and exponentially decreases as the two profiles become less similar. Statistical Analysis
The analysis of the data was conducted by the determination of mean and standard deviation, in addition to analysis of variance ANOVA fol-lowed by the Tukey test (p <0.05), when appropriate.
RESULTS
During the whole process of compression of the two batches, TB02 and TB06, the in-process control (weight and hardness measurement) was carried out with 10 units at 15 mins intervals. At the end of the process the friability and disintegration tests were performed and all results are following the specifications of the Brazilian Pharmacopoeia 5th Edition
(Tables 2, 3 and 4).
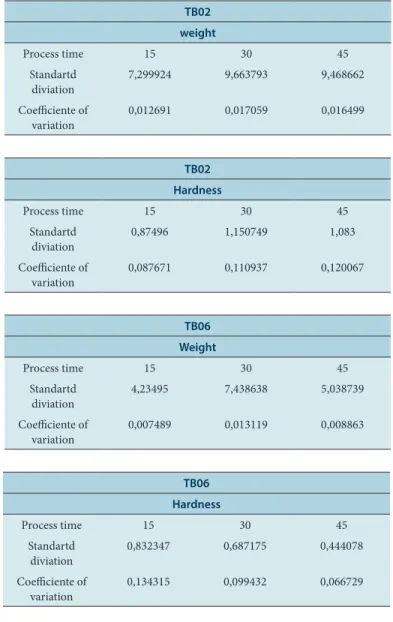
The coefficient of variation values for both weight and hardness show low coefficient of variation, demonstrating that the compression process is quite robust. (Table 4)
X-ray diffraction tests (Figure 1) show that, in all samples, there was a shift in the intensity of the drug peaks, but the nimesulide active re-mains crystalline, that is, the different drying processes followed by the compression of the granulated particles do not promoted the amorphiza-tion of nimesulide.
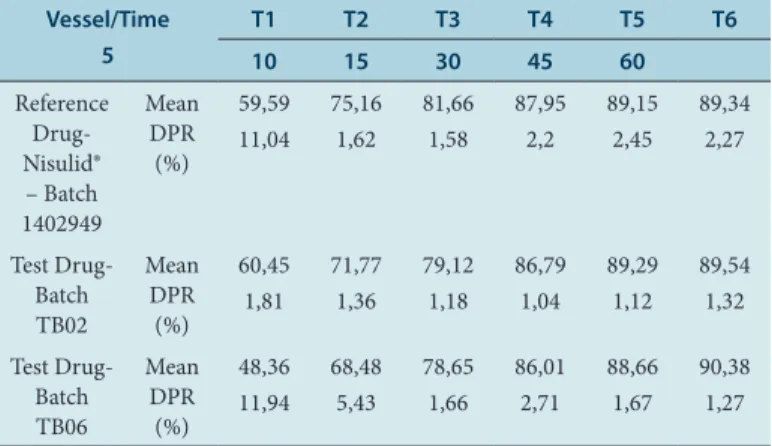
For all the samples evaluated (reference drug and tests), the dissolu-tion profile showed 85% release of the active dissolved in 30 mins, as described in Table 5.
The Figure 2 represents the comparative dissolution profiles between the reference drug Nisulid and the TB02 and TB06 tests respectively. Comparative profiles were performed between the test drugs (TB02 and TB06) and the reference drug Nisulid (Lot: 1402949) as described in
Figure 1: X-Ray Diffraction patterns of native Nimesulide, TB06 granules, TB06 tablets, TB02 granules and TB02 tablets.
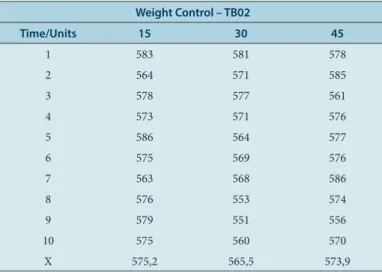
Table 2: Raw values of process control: weight, hardness, friability and disintegration of test drug TB02.
Weight Control – TB02
Time/Units 15 30 45
1 583 581 578
2 564 571 585
3 578 577 561
4 573 571 576
5 586 564 577
6 575 569 576
7 563 568 586
8 576 553 574
9 579 551 556
10 575 560 570
X 575,2 565,5 573,9
Hardness Control – TB02
Time/Units 15 30 45
1 9,48 9,28 9,9
2 10,19 11,31 6,8
3 9,07 11,82 8,4
4 9,38 10,7 10,3
5 10,3 11,82 9,7
6 10,3 8,77 9,6
7 10,6 9,17 9,2
8 9,17 9,89 7,8
9 9,38 11,31 9,7
10 11,93 9,68 8,8
X 9,98 10,37 9,02
Friability Test – TB02
Number of tabletes 10
Starting weight 5,726g
Final weight 5,717g
Friability 0,15%
Disintegration Test – TB02
Medium water
Temperature 37+/-1°C
Time 26 seconds
Table 5 and plotted in Figure 2. From the calculation of the mean of the drug values released at each time one can calculate the F2 (resemblance factor) by comparing the test drugs with the reference drug. The value of F2 is indicative of similarity between the evaluated drugs and should be in the range of 50 to 100, how bigger the value, greater is the similarity between the evaluated drugs.
From the data obtained, a percentage drug rate curve was constructed as a function of time, to evaluate the similarity between the medically referenced and the test drugs. The mean results for the dissolution profile of the reference drug and the test drugs (TB02 and TB06) are shown in Table 5 and graphically represented in Figure 2.
those used in the evaluation of Test and Reference / Comparator Drugs.13
The dissolution profile tests should be performed in 12 vats with the ref-erence medicine and with the test drug for comparison between the two and thus have the result of F2. For two dissolution profiles to be consid-ered similar, the value of the resemblance factor (F2) must be between 50 and 100.14
From the raw data found in the dissolution of the test drugs and the reference drug, F2 calculations were performed to evaluate the similarity between the tests and the reference, according to Table 6.
DISCUSSION
As observed in Tables 2, 3 and 4, among the physical properties tested the two batches were approved. All parameters were within the range de-termined by the Brazilian Pharmacopoeia 5th Edition.2 Table 3 shows the
coefficient of variation (CV) for the tests of weight and hardness of the two batches, calculated for the three times of product collection during the compression. Comparing the CV value between TB02 and TB06, for the weight test, we have that in the times of 15, 30 and 45 mins the CV was lower for TB06. By making the same comparison for the hardness parameter we have that in the time of 15 mins the CV of TB02 is lower than the CV of TB06, but in the times of 30 and 45 mins, this situation is reversed and CV of TB06 is lower in relation to TB02. This may be an in-dication that the TB06 lot granules were more homogeneous in density, shape and size, which are directly related to the weight and hardness of the tablets. Possibly, this fact can be explained by the type of drying pro-cess applied to the product. The test drug exposed to fluidized bed drying showed heterogeneous particles in size, which may justify a larger CV. Differently from the results presented here, Souza (2012) obtained gran-ules of metformin from a fluidized bed drying process with uniform size, strict control of the final moisture and with a relatively short process time when compared to the technique Greenhouse drying.15
Table 3: Raw values of process control: weight, hardness, friability and disintegration of test drug TB06.
Weight Control – TB06
Time/Units 15 30 45
1 571 577 560
2 565 572 569
3 570 558 566
4 569 558 570
5 560 570 566
6 565 566 576
7 573 557 568
8 567 576 565
9 564 565 577
10 561 571 568
X 5667,7 567 568,5
Hardness Control – TB06
Time/Units 15 30 45
1 5,81 7,54 6,73
2 105,91 6,52 6,52
3 6,12 6,22 6,93
4 6,01 7,24 6,01
5 7,85 6,52 5,91
6 7,34 5,71 6,52
7 6,42 7,44 7,34
8 5,1 6,63 6,93
9 6,01 7,85 7,03
10 5,4 7,44 6,63
X 6,197 6,911 6,655
Friability Test – TB06
Number of tabletes 10
Starting weight 5,705g
Final weight 5,786g
Friability 0,33%
Disintegration Test – TB06
Medium water
Temperature 37+/-1°C
Time 26 seconds
Table 4: The values of coefficient of variation of weight and hardness, for the test drugs TB02 and TB06.
TB02 weight
Process time 15 30 45
Standartd
diviation 7,299924 9,663793 9,468662
Coefficiente of
variation 0,012691 0,017059 0,016499
TB02 Hardness
Process time 15 30 45
Standartd
diviation 0,87496 1,150749 1,083
Coefficiente of
variation 0,087671 0,110937 0,120067
TB06 Weight
Process time 15 30 45
Standartd
diviation 4,23495 7,438638 5,038739
Coefficiente of
variation 0,007489 0,013119 0,008863
TB06 Hardness
Process time 15 30 45
Standartd
diviation 0,832347 0,687175 0,444078
Coefficiente of
During the granulation process, the water molecules can bind in differ-ent ways to the crystals and, upon drying, a high temperature can re-move the water provoking a change in the solid form. Different drying processes may justify the displacement of the crystallinity intensity of the nimesulide active observed in pattern A.
The RSD value (%) recommended for this study is 20% for the first two periods (5 and 10 mins) and at the other times (15, 30, 45 and 60 mins) the RSD value (%) should be Less than 10%,5 According to RDC 31/2010.
All samples are within the allowed range (Table 4). According to Laporta et al. (2013) the relative standard deviation (RSD) is a good indication of the homogeneity of the results obtained in a study.17
The results concerning the amount of the active substance dissolved in the maximum pharmacokinetic dissolution time of the developed test drugs and reference tablets are shown in Table 5. The results show that the TB06 test formulation had a slower release profile in the first 15 mins than the test drug TB02 and Nisulid. However, at 30 mins, all drugs released similar nimesulide values (%), of which 87, 95% for Nisulid, 86.79% for TB02 and 86.01% for TB06. According to the Brazilian Phar-macopoeia 5th Edition (2010) the minimum of 85% of the drug
nimesu-lide should be released in 30 mines.2 Based on this parameter, the TB02
and TB06 test drugs and the reference drug Nisulid met the pharmaco-poeial specifications.
In the present study, we also evaluated the results of calculations of F2 for Nisulid x TB02 and F2 for Nisulid X TB06. It has been found that the TB02 test shows a greater similarity to the reference drug, since it has an F2 value of 84.05, within the RDC 31/2010 specification and therefore can be considered a pharmaceutical alternative for reference. Meanwhile, the TB06 test cannot be considered similar, since the F2 value found was 43.32 and is out of specification. In this case, the above results suggest a change in the formulation and / or development technique of lot TB06 for dissolution adjustment.
CONCLUSION
Although both batches of test drugs show 85% release of nimesulide in 30 mins and the coefficient of variation values for the TB06 test weight and hardness tests are lower than the TB02 test, it was observed that the TB02 test showed the Greater similarity factor (F2) when compared to the reference drug Nisulid (lot: 1402949). Thus, it can be concluded that the technique using the fluidized bed as a drying apparatus shows a greater efficiency in relation to oven drying and that the test drug TB02 can be considered as a pharmaceutical alternative to the reference medi-cine.
CONFLICT OF INTEREST
The authors declare no conflict of interest.REFERENCES
1. Dellis D, Giaginis C, Tsantili-Kakoulidou A. Physicochemical profile of nimesu-lide. Exploring the interplay of lipophilicity, solubility and ionization. J Pharm Biomed Anal. 2007;44(1):57-62.
2. Brazil. Agência Nacional de Vigilância Sanitária (ANVISA); Farmacopéia Brasilei-ra,. 5th Ed. Brasilia, Brasil. 2010;1.
3. Allen LV, Ansel HC. Ansel’s pharmaceutical dosage forms and drug delivery sys-tems: Tenth edition. Ansel’s Pharmaceutical Dosage Forms and Drug Delivery Systems: Tenth Edition. 2014.
4. Parikh DM. Handbook of pharmaceutical granulation technology. Handbook of Pharmaceutical Granulation Technology, Second Edition. 2005.
5. Michael E, Aulton PY. Design of dosage forms. Aulton’s Pharmaceutics The De-sign and Manufacture of Medicines. 2013.
6. Tardos GI, Khan MI, Mort PR. Critical parameters and limiting conditions in binder granulation of fine powders. Powder Technology. 1997;94(3):245-58.
7. Fernandes TRP. Desenvolvimento Farmacotécnico evalidação de metodologia analítica para comprimidos revestidos à base de diclofenaco de potássio.
Mas-Table 5: Mean of the dissolution and DPR value by time for the refer-ence drug, 1402949, and the test drugs, TB02 and TB06.
Vessel/Time 5
T1 T2 T3 T4 T5 T6
10 15 30 45 60
Reference Drug- Nisulid® – Batch 1402949 Mean DPR (%) 59,59 11,04 75,16 1,62 81,66 1,58 87,95 2,2 89,15 2,45 89,34 2,27 Test Drug- Batch TB02 Mean DPR (%) 60,45 1,81 71,77 1,36 79,12 1,18 86,79 1,04 89,29 1,12 89,54 1,32 Test Drug- Batch TB06 Mean DPR (%) 48,36 11,94 68,48 5,43 78,65 1,66 86,01 2,71 88,66 1,67 90,38 1,27
Table 6: Results of F2 values for test drugs TB02 and TB06.
Values of F2 Reference x Tests
Reference x Tests TB02 84,052416
Reference x Tests TB06 43,324202
Figure 2: Dissolution profiles of the reference drug, Nisulid lot: 1402949 and two drug tests, TB02 and TB06.
By evaluating the hardness and friability results for TB02 and TB06, it was observed a higher hardness and lower friability for TB02 Block tablets (Tables 2 and 3). Some studies suggest that fluidized bed dry-ing forms granules with strong solid bridges leaddry-ing to the production of harder tablets. For the disintegration test, there was no difference in the drying methodology used and although the friability value of Block TB06 was almost twice the friability value of Block TB02, the disintegra-tion time of both lots was the same. Rolim (2001) shows in their study that the hardness and friability values of the different batches evaluated did not influence the disintegration time of the tablets and that this was due to the amount of disintegrants and humectants present in the for-mulation.16
X-ray diffraction tests (Figure 1) show that, in all samples, there was a shift in the intensity of the drug peaks, but the nimesulide active remains crystalline, that is, the different drying processes followed by the com-pression of the granulated particles do not promoted the amorphization of nimesulide.
ter dissertation, Postgraduate Program in Pharmaceutical Sciences, Federal University of Pernambuco, Brazil. 2003.
8. Monteiro DB. Tecnologia de obtenção de comprimidos revestidos de lamivu-dina, transposição de escala, validação da metodologia analítica, estudo de estabilidade eequivalência farmacêutica. Master dissertation, Postgraduate Program in Pharmaceutical Sciences, Federal University of Pernambuco. Re-cife. 2000.
9. Malesuik MD, Cardoso SG, Lanzanova FA, Bajerski L, Dorigoni E. Desenvolvim-ento de teste de dissolução e estudo comparativo de comprimidos e cápsulas magistrais contendo anlodipino. Rev Ciencias Farm Basica e Apl. 2006
10. Byrn S, Pfeiffer R, Ganey M, Hoiberg C, Poochikian G. Pharmaceutical Solids: A Strategic Approach to Regulatory Considerations. Pharmaceutical Research: An Official Journal of the American Association of Pharmaceutical Scientists. 2008.
11. Ribeiro AQ, Araújo CMDC, DeAcurcio FA, Magalhães SMS, Chaimowicz F. Qualidade do uso de medicamentos por idosos: Uma revisão dos métodos de avaliação disponíveis. Cien Saude Colet. 2005;10:1037-45.
12. Marcolongo R. Dissolução de medicamentos: fundamentos, aplicações, as-pectos regulatórios e perspectivas na área farmacêutica. Master Dissertation, Postgraduate Program in Pharmaceutical Sciences, University of São Paulo, Brazil. 2003.
13. Brazil. Agencia Nacional De Vigilância Sanitária (ANVISA.); Dispõe sobre a reali-zação dos Estudos de Equivalência Farmacêuticae de Perfil de Dissolução Com-parativo. Resolução RDC nº31, Brasil. 2010.
14. BRAZIL.http://portal.anvisa.gov.br/wps/wcm/connect/d487638040e-9caa0b358b39cca79f4cf/Fun%C3%A7%C3%A3o+do+Excipiente. pdf?MOD=AJPERES – Accessed 01 de mach 2019.
15. Souza JL. Avaliação da secagem de metformina 850mg em leito fluidizado in-dustrial. Master dissertation, State University of Western Paraná, Brazil. 2012.
16. Rolim CMB. Bioequivalencia de comprimidos de nimesulida do mercado nacio-nal. PhD Thesis, University of São Paulo, Brasil. 2001.
17. Laporta LV, DeFaccim BT, DaPons JFR, DosSantos MR, Adolfo GC. Validação de método analítico para avaliação da qualidade de cápsulas de cloridrato de metformina manipuladas. Revista De Ciências Farmacêuticas Básicae Aplicada. 2013;34(2):235-44.
Article History: Submission Date : 29-12-2019 ; Revised Date : 10-01-2020 ; Acceptance Date : 28-01-2020