182
RESEARCH CONCERNING THE DEVELOPMENT OF ROMANIA’S WINE
MARKET IN THE LAST DECADE
AGATHA POPESCU
University of Agricultural Sciences and Veterinary Medicine of Bucharest, 59 Marasti, District 1, Bucharest, 011464, Romania, Phone:+40213182564, Fax:+40213182888, Email:[email protected]
Keywords: market, production, Romania, trade, wine
ABSTRACT
In 2010, Romania produced 495.7 Million liters wine, coming on the 6th position in the EU and the 12th position in the world. Wine consumption was 509.7 million liters placing Romania on the 6th position in the EU and 11th position in the world. With 22.94 liters wine consumed per inhabitant, Romania came on the 12th position in the EU and 22nd position at global level. Romania’s wine import was higher than export. Romania occupies the 19th position for wine export and the 18th position for wine import in the EU. At world level, it came on the 27th position for wine export and the 30th position for wine import value. Romanian producers have to pay a special attention to wine production growth, quality, marketing and promotion.
INTRODUCTION
Grapes are among the most desired fruits having a juicy consistence and sweet pleasant taste. Their chemical composition (water 78.85 %, sugar 15-25 %, organic acids 0,2-5 %, phenols 0.2-1 %, nitrogenous substances 0.5-1.2 %, fats 0.08- 0.2 %, enzymes, minerals 1-3 %, B,C, PP vitamins etc) varies according to wine variety, vineyard geographical position, soil and climate conditions, applied growing technology (Pomohaci et al., 2000). Grapes are mainly used for producing wine but also for other food products and could be consumed fresh as such (Beldescu et al., 2012).
Wine is among the most preferred drinks, but also it is considered a food and medicine, having a nutritional and health effect when it consumed in a moderate manner (Motofelea et al., 2011, Dejeu, 2000, Cotea et al., 1996).
Romania has favorable soil and climate conditions for vine growing and also a long tradition in producing grapes and white and red wines well appreciated at international fairs and competitions. Vine varieties produced in the country have a high biological and productive potential being adapted to the local conditions, resistant to drought, diseases and pests ( Popescu Agatha, 2007).
Romania’s area planted with Vitis vinifera as well as grape and wine production have recorded a continuous decline because of the old and low productive vine plantations and climate change (Zahiu et al., 2010, Macici, 1996, Motofolea et al., 2011) with a deep impact on consumption and trade on the domestic and external market (Beldescu et al., 2012, Soare et al., 2011).
In this context, the paper aimed to analyze the evolution of Romania’s grape and wine market in the last decade, 2000-2010, regarding area planted with vine, grape yield and production, wine production, consumption, export and import and to compare its performance to the one recorded by the top producers in the EU and finally to establish Romania’s position in the EU-27 and global wine market.
MATERIALS AND METHODS
183
sources. The data have been processed using index and share methods as well as comparison method.
The analysis is based on the main specific indicators as follows: surface planted with Vitis vinifera, grape yield and production, wine production, consumption, consumption per inhabitant, and trade, pointing out the evolution of each indicator in the period 2000-2010 and Romania’s position among the EU-27 member states and at world level as well.
RESULTS AND DISCUSSIONS
Romania’s vineyards area has continuously decreased, so that in the year 2010 it accounted for 176.9 thousand ha, being by 28.53 % smaller than in the year 2000. The vine reform aimed to diminishing the old and low productive plantations, as provided by the EU policy. About 51.13 % of vineyards area is represented by grafted bearing vineyards. (Table 1).
About 85 % of viticultural area is covered by vine varieties for producing white wines (Feteasca alba and Feteasca regala, followed by Riesling, Aligote, Sauvignon and Muscat) and 15 % for red wines (Merlot and Cabernet Sauvignon) (Beldescu et al., 2012).
Table 1 Romania’s vineyards area, 2000-2010 (Thousand ha)
2000 2005 2010 2010/ 2000 % Total vineyards 247.5 190.6 176.9 71.47 Grafted vineyards 128.5 98.5 90.0 70.03 Hybrid vineyards 119.0 90.1 86.9 73.02 Share of grafted
vineyards (%)
51.91 51.67 51.13 -
Source: Romania’s Statistical Yearbook, 2011, Own calculations
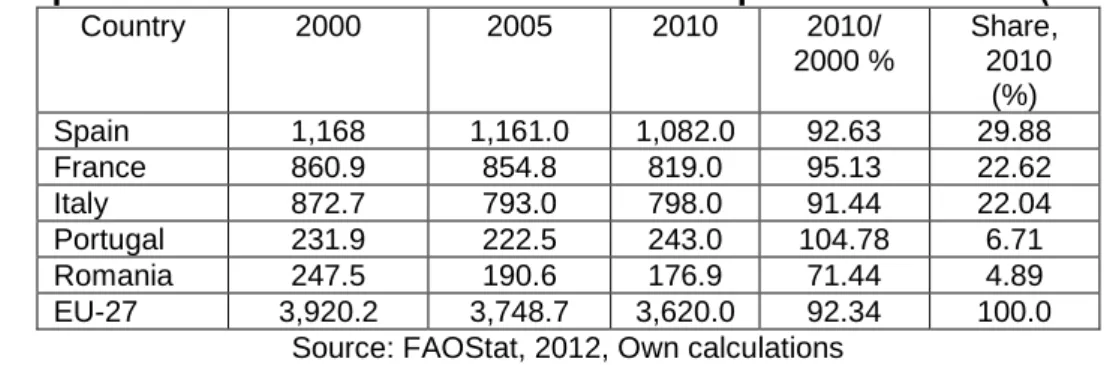
Romania comes on the 5th position in the EU-27 based on the surface planted with vine. Its market share is 4.89 % and follows after Spain, France, Italy and Portugal, whose surface planted with vine is much larger, being the top vine cultivators in Europe and in the world (Table 2).
Grape yield varied from a year to another, depending on the region, vine variety, climate conditions, applied growing and maintenance technology etc. The severe droughts and hard winter from the last years have had a negative impact on grape yield. But, the drought had a benefic effect on the content of sugar in grape berries stimulating a higher quality of wine production.
In 2010, grape yield accounted for 4,182 kg/ha being by about 20 % smaller than in the year 2000. In 2010, the grafted vineyards produced 5,055 kg grapes/ha compared to hybrid vineyards, 3,277 kg/ha. The yield of grafted vineyards decreased by about 14 %, while average production of grapes produced by hybrid plantations declined by about 25 % (Table 3).
Table 2 Romania’s position in the EU based on the surface planted with vine (thousand ha)
Country 2000 2005 2010 2010/ 2000 %
Share, 2010 (%) Spain 1,168 1,161.0 1,082.0 92.63 29.88 France 860.9 854.8 819.0 95.13 22.62 Italy 872.7 793.0 798.0 91.44 22.04 Portugal 231.9 222.5 243.0 104.78 6.71 Romania 247.5 190.6 176.9 71.44 4.89 EU-27 3,920.2 3,748.7 3,620.0 92.34 100.0
184
Romania’s grape yield is still low compared to the one registered at the EU-27 level. In 2010, the EU-27 average grape production was 7.670 kg/ha, being by 45 % higher than the one recorded in Romania (FAOStat, 2012).
Table 3 Romania’s Average Grape Production, 2000-2010 (kg/ha)
2000 2005 2010 2010/ 2000 (%) Average grape
production
5,213 2,530 4,182 80.22
Grafted vineyards 5,857 2,716 5,055 86.30 Hybrid vineyards 4,398 2,284 3,277 74.51
Source: Romania’s Statistical Yearbook, 2011, Own calculations
Romania’s grape production was deeply influenced both by the reduction of planted area and decline in grape yield. As a consequence, grape production has substantially fallen recording 737 tons in the year 2010, by 43.09 % less than in the year 2000 (Table 4).
Table 4 Romania’s Grape and Wine Production, 2000-2010
MU 2000 2005 2010 2010/ 2000 % Grape production Tons 1,295 505.8 737 56.91 Wine Production Million
liters
545.3 260.2 495.7 90.90
Source: Romania’s Statistical Yearbook, 2011. Own calculations.
In 2010, Romania’s grape production represented 2.65 % of the EU-27 grape production (27,764 thousand tons) and 1.04 % of the world grape production (71,008 thousand tons).
Wine Production. Compared to 545.3 Million liters in 2000, in 2010, Romania produced 495.7 Million liters, but about 10 % less than at the beginning of the analyzed period.
The production decline was similar in the EU-27, where production decreased by about 16 %, because of the wine reform focused on the reduction of surfaces planted with vine in order to eliminate the old less productive plantations, to diminish the overproduction and wine consumption on the domestic market.
Romania is placed among the top EU wine producers, coming on the 6th position after France, Italy, Spain, Germany and Portugal. Its market share is 3.08 % in the EU wine production (Table 5).
About 10 % of Romania’s wines have protected origin, that is they are DOP wines and 18 % are IGP wines, that is geographical protected indication. The most important wine producers in Romania are Cotnari, Odobeşti, Recas, Dealu Mare, Jidvei, Murfatlar, Tohani, Sâmbureşti and Segarcea vineries.
Table 5 Romania’s position among the top EU-27 wine producers (million liters)
Country 2000 2005 2010 2010/ 2000
(%)
Share, 2010 (%)
France 5,754.1 5,344.1 4,626.9 80.4 28.76 Italy 5,408.8 5,056.6 4,580 84.7 28.47 Spain 4,117.3 3,643.7 3,606.0 87.6 22.42 Germany 1,008.1 945.3 932.0 92.4 5.79 Portugal 784.4 706.3 587.2 74.9 3.65 Romania 545.3 260.7 495.7 90.9 3.08
185
In Romania about 402 types of wines are produced, of which 11 types are stable wines, 42 types are high quality wines, 118 types are high quality wines with protected origin and 231 types are wines with designation of origin and quality (Soare et al., 2011).
Wine consumption accounted for 509.7 million liters in 2010 being by about 10 % smaller than in 2000. This was due to the change in consumers’ behaviour more oriented to beer, which is cheaper and more drinkable in the hot period of the year. However, wine consumption has fallen for premium wines, but it has remained relatively constant for average and inferior quality wines. A similar trend was noticed in the EU-27, where wine consumption declined by about 11.3 % from 14,886 million liters in 2000 to 13,209 million liters in 2010. Romania comes on the 6th position in the EU for wine consumption with a market share of 3.85 % in 2010, after France, Italy, Germany, United Kingdom and Spain (Table 6).
Table 6 Position of Romania in the EU regarding wine consumption (million liters)
Country 2000 2005 2010 2010/ 2000
( %)
Share, 2010
(%) France 3,336.4 3,652.7 2,892 86.7 21.89 Italy 3,378.6 2,988.5 2,450 72.5 18.55
Germany 2,246.4 2,238.6 2,020 89.9 15.29
United Kingdom
1,020.6 1,432.3 1,320 129.3 9.99
Spain 1,574.8 1,714.7 1,060 67.3 8.02
Romania 564,4 474.1 509.7 90.3 3.85
Source:FAO Stat, 2012, Own calculations
Wine consumption per inhabitant declined from 23 liters in the year 2000 to 19.8 liters in 2005 and then it registered an increase again reaching 22.9 liters/capita in 2010. In the EU-27, wine consumption per inhabitant decreased by 15 % from 30.83 liters in 2000 to 26.36 liters in the year 2010.
Based on this indicator, Romania is placed on the 12th position in the EU-27 after Luxembourg, France, Italy, Portugal, Slovenia, Denmark, Austria, Belgium, Spain, Germany and Hungary.
Romania’s wine trade has recorded a deep decline regarding export and high increase concerning import. In 2010, Romania exported 10.9 million liters wines, by 57 % less than in the year 2000, while the EU wine import increased by 60 % (Table 7).
Based on the amount of exported wine, Romania is situated on the 19th position among the EU wine exporters. Its market share in the EU declined from 0.56 % in 2000 to 0.15 % in 2010.
Table 7 Romania’s wine export and import and its share in the EU wine trade (million liters)
2000 2005 2010 2010/ 2000 (%) Romania’s wine export 25.3 26.9 10.9 43.1 EU-27 wine export 4,522.4 5,314.7 7,251.9 160.3 Share in the EU-27 (%) 0.56 0.51 0.15 - Romania’s wine import 1.3 4.2 24.6 1,892.3 EU-27 wine import 3,737.4 4,907.6 5,894.0 157.7 Share in the EU-27 % 0.03 0.09 0.42 -
186
In 2010, the main beneficiaries of Romanian wines produced of fresh grapes, have been: China, USA, Italy, Estonia, Canada, United Kingdom, Spain, Poland, Germany and Slovakia. The first 5 export partners accounted for 66 % of Romania’s wine export. Among the beneficiaries of the Romanian spumant wines have been: Germany, Czech Republic, Bulgaria, Estonia, Russia, Belarus, Denmark, Japan, Poland and China ( International Trade Center/UNCTAD/WTO-Comtrade UNSD) (Beldescu et al., 2012).
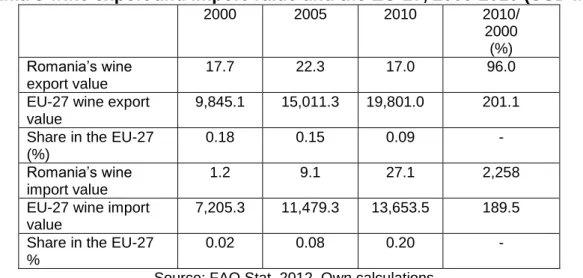
Table 8 Romania’s wine export and import value and the EU-27, 2000-2010 (USD Million)
2000 2005 2010 2010/ 2000 (%) Romania’s wine
export value
17.7 22.3 17.0 96.0
EU-27 wine export value
9,845.1 15,011.3 19,801.0 201.1
Share in the EU-27 (%)
0.18 0.15 0.09 -
Romania’s wine import value
1.2 9.1 27.1 2,258
EU-27 wine import value
7,205.3 11,479.3 13,653.5 189.5
Share in the EU-27 %
0.02 0.08 0.20 -
Source: FAO Stat, 2012, Own calculations
Romania’s wine import increased by 18.92 times, accounting for 24.6 million liters in 2010. It came on the 18th position in the EU in the year 2010. Its share in the EU increased from 0.03 % in 2000 to 0.42 % in 2010. The major wine suppliers for Romania are France, Italy, Republic of Moldova, Slovakia, Germany, Hungary, Chile, Bulgaria, Czech Republic and Spain (International Trade Center/UNCTAD/WTO-Comtrade UNSD, Beldescu et al., 2012).
Romania’s wine export value declined by 4 % from USD 17.7 million in the year 2000 to USD 17 million in 2010. As a consequence, Romania’s market share in the EU-27 decreased from 0.18 % to 0.09 % in the analyzed period, placing Romania in the 20th position in the EU. Romania’s wine import value increased by 22.85 times from USD 1.2 million in the year 2000 to USD 27.1 million in the year 2010. Its market share increased from 0.02 % to 0.20 % placing Romania on the 21th position in the EU-27(Table 8).
CONCLUSIONS
Romania has a high potential for producing grapes and wines, sustained by its favorable climate conditions, high performance vine varieties and long tradition in wine growing.
187
came on the 27th position in the world for wine export value (USD 4.8 Million) and on the 30th position for wine import value (USD 8.7 Million).
The increased competition in the wine international market involves a more flexible and efficient wine production and marketing for Romanian producers.
BIBLIOGRAPY
Beldescu, A., Mărăscu, C., 2012, Romania’s Wine Export Potential, Romanian Center for Trade, Foreign Investment Promotion.
Cotea, V., Cotea, V.V., 1996, Viticulture, Ampelography and Oenology. Didactical and Pedagogical Publishing House, Bucharest.
Dejeu, L., 2000, Wine-Nutrition and Health, Elisavaros Press House, Bucharest. Macici, M., 1996, Romania’s wines, Alcor Press House, Impex SRL Press House, Bucharest.
Motofolea, C., Beldescu, A., 2011, Romania’s Wines, Sectorial Analysis, Romanian Center for Trade, Foreign Investment Promotion.
Pomohaci, N., Nămoloşanu, I., Nămoloşanu, A., 2000, Wine producing and carrying, Ceres House Press, 9-13.
Popescu Agatha, 2007, Romania’s wine export, Analele Universitatii Craiova Seria Biologie, Horticultura, Tehnolgia Prelucrarii Produselor Agricole, Ingineria Mediului in agricultura, Vol.XII ( XLVIII), p.17-22
Soare, E., Cofas, E., Bălan, A., David, L., 2011, Study regarding wine market in Romania, Scientific Papers, Agricultural Management, Series I, vol. XIV (2): 193-200.
Zahiu, L., Toma, E., Dachin, A., Alexandru, C., 2010, Agriculture in Romania’s Economy, Ceres Publishing House, Bucharest, p. 77-78.
FAO Stat Database, www.faostat.fao.org.