execution time of tasks as depending on where the data is placed in memory, tasks of the same type may end up having different performances. Multiple scheduling heuristics have managed to improve performance by taking into account memory-related properties such as data locality and cache sharing. However, we may see tasks in certain applications or phases of applications that take little or no advantage of these optimizations. Without understanding when such optimizations are effective, we may trigger unnecessary overhead at the runtime level.
In previous work we introduced TaskInsight, a technique to characterize how the memory behavior of the application is affected by different task schedulers through the analysis of data reuse across tasks. We now use this tool to dynamically trace the scheduling decisions of multi-threaded applications through their execution and analyze how memory reuse can provide information on when and why locality-aware optimizations are effective and impact performance.
We demonstrate how we can detect particular scheduling decisions that produced a variation in performance, and the underlying reasons for applying TaskInsight to several of the Montblanc benchmarks. This flexible insight is a key for both the programmer and runtime to allow assigning the optimal scheduling policy to certain executions or phases.
Keywords: task-based scheduling, data reuse, data locality, cache model.
Introduction
Scheduling tasks in task-based applications have become significantly more difficult due to overall system complexity, particularly to the deep shared memory hierarchies. Typical ap-proaches to optimizing scheduling algorithms consist of either providing an interactive visual-ization of the execution trace [1, 5] or simulating the tasks execution to evaluate the overall scheduling policy in a controlled environment [4, 9]. A developer then has to analyze the re-sulting profiling information and deduce if the scheduler behaves as expected, andqualitatively
compare different schedulers.
Poor scheduling decisions can result in idle execution time due to load imbalance from the inability to prioritize tasks on the critical path or appropriate map tasks to processors. However, the scheduler decisions also impact data locality in the cache hierarchy by changing the order of tasks. The result of these decisions is performance variation across tasks that can only be understood by analyzing how the tasks share data and how the schedule affects that sharing.
Usually developers of a task-based application blame this performance degradation on data locality and attempt to characterize their workload based on data reuse without considering the dynamic interaction between the scheduler and the caches [3, 10]. This is simply because there has been no way to obtain precise information on how the data was reused through the execution of the application, such as how long it remained in the caches, and how the scheduling decisions influenced this reuse. Without an automatic tool capable of providing insight as to whether and where the scheduler misbehaved, the programmer must rely on intuition to understand and adjust the scheduler for improved performance.
In previous work we presented TaskInsight, a new methodology to characterize, in a quantifi-ableway, the scheduling process in the context of one of the most important performance-related
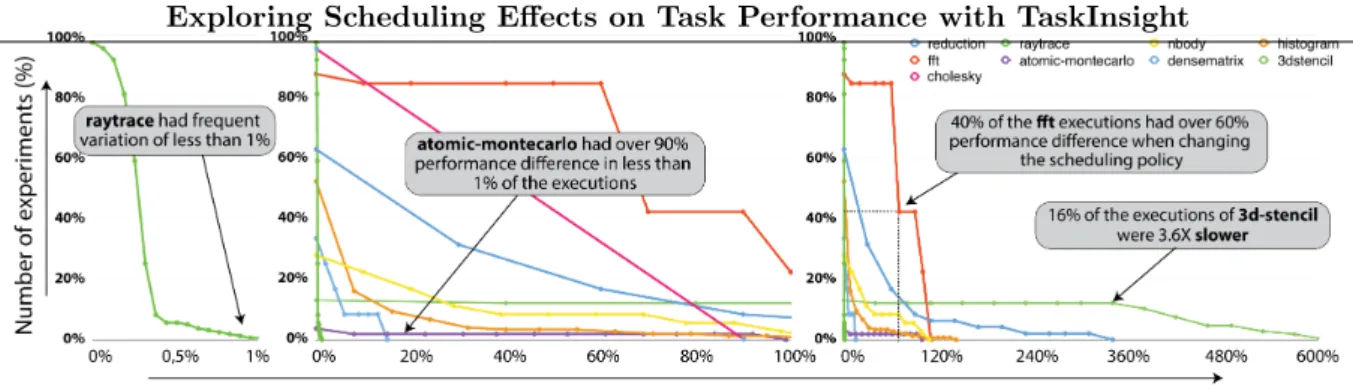
Figure 1. Distribution of the performance differences of all the experiments per benchmark. E.g. 80% of the runs of ffthad over 20% performance difference when executed with a different schedule. All three graphs are the same but with different scales on the x-axis
characteristics: how the schedule affects data reuse between tasks through the cache hierarchy over time, which provides insight into performance of the scheduler.
In this work, we show how applying TaskInsight to the widely adopted Montblanc bench-marks reveals deep insight into why scheduling changed the memory behavior of applications, the key to understanding performance variation across different executions. The article is or-ganized as follows. We firstly analyze all the applications with different scheduling policies and input sizes (Section 1). From all the executions, we select three specific applications, presenting case-studies to show how applying TaskInsight reveals what were the problematic issues (Section 2). Then, we cover related previous work (Section 3) to finally conclude with some remarks on how the TaskInsight analysis enables us to understand other behaviors across the benchmarks and schedulers (Conclusion).
1. Motivation
It is well-known that cache optimization is crucial for performance, but real-world applica-tions expose different sensitivities to changes in memory behavior. Task-based applicaapplica-tions can vary wildly in their behavior based on several factors such as the size of the input problem (total data), the number of tasks they spawn, how they distribute work among those tasks (paral-lelism), and how many tasks they can run in parallel (dependencies). Each of these factors can typically be controlled, either by configuring the application or by the runtime. Nevertheless, it is often difficult to know which one is the best and how would the scheduler behave with these new configurations.
marks such as fft, cholesky, reduction and n-body have a high variation in performance across a significant number of their configurations: 40% of the executions of fft have more than 60% performance difference when changing the scheduling policy; for reduction 30% of the executions have over 30% performance difference; and for cholesky, 40% have differences of over 30%.
On the other hand,raytrace,dense-matrixandatomic-montecarloshow negligible per-formance changes between the schedulers across all configurations. Interestingly, being insensi-tive to scheduler changes appears in two forms depending on whether the performance impact is small or the number of configurations that experience it is small. raytrace(green line) shows that there is a variation when changing the scheduling policy in almost every execution, how-ever, all those differences are less than 1%, and a similar (but more noticeable) effect is observed indense-matrix, with differences under 13%. On the flip side atomic-montecarlo shows that variation is very unlikely to occur (1 in 100 configurations), but when it does, the performance difference is significant (over 90%). These are two opposite and very extreme behaviors, but in the context of this work they have the same implication that there is little to be gained from optimizing the scheduler. For simplicity, we will classify both types as benchmarks that are performance insensitive to scheduling changes.
The results of comparing the schedulers in Figure 1 shows significant variation in how appli-cations respond to changes in scheduling, and a substantial potential for improving performance through better scheduling. However, today’s tools and techniques do not enable us to analyze and understand how they are related to scheduling, why they occur, and how to avoid them.
TaskInsight, originally presented in [2], can characterize performance differences caused by changes in memory behavior of the application due to scheduling. In the following section, we will select three applications that exposed performance variation (reduction, histogram and fft), and show how TaskInsight enables us to understand the reasons behind it.
2. Analyzing Performance Variation Due To Scheduling
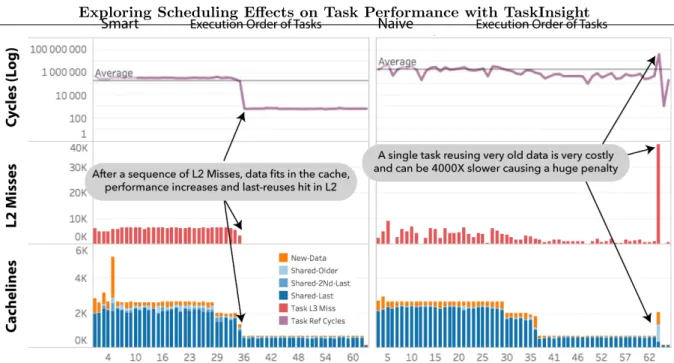
Figure 2. If data is used in a tidy pattern (smart, left), it fits in the cache exposing perfect reuse and incurring fewer cache misses. However, a more spread pattern (naive, right) has constant cache misses across the entire execution with a performance penalty.Cacheline refers to the number of unique cachelines touched by the task, which can be directly correlated to cache misses
2.1. Single Task with Negative Impact if Data is not in the Cache (Reduction)
An interesting case study is reduction (with inputs: nelem=8M, nt=128), where most of the performance differences come from missing in the L2 cache. Data for L3 is not displayed because there is no relevant change across schedules. From Figure 2 we can see that in smart, there is a cycle drop after executing the first 36 tasks, and it corresponds to a drop in L2 misses. From TaskInsights reuse analysis we see that data is still being reused, and has been reused very recently (manylast-reuses), meaning that the data is present in L2. On the other hand,
naivehas a lower number of L2 misses but they are spread across the entire execution, causing a more constant average cycle count. From the TaskInsight reuse analysis we see that data has also been reused recently, but in a different pattern.
The interesting singularity that we observe is the task number 63 which brings a significant amount of new data. In smart, this task was scheduled in the very beginning (5th), and it is both touching a large set of new data and reusing very recent data. Innaivethis task, because of dependency flexibility, was scheduled much later (63rd), and by that time the data it has to reuse is much older as we see from TaskInsight’s classification. As its reuse is not much further away, the task generates roughly 10x more L2 misses (also 10x more L3 misses) and its execution now is 400X slower than in smart (note the Log scale). We are able to draw these type of conclusions because OmpSs assigns unique tasks IDs to the tasks at initialization time. Thus, we can identify how the same tasks were scheduled differently.
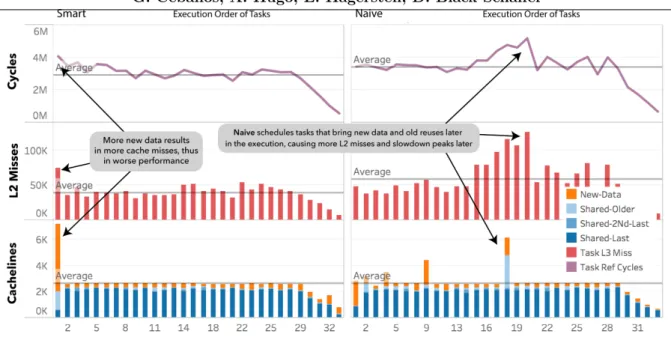
Figure 3.Scheduling bigger tasks sooner (smart, left) will bring a larger amount ofnew-datasooner, exposing morelast-reusesbetween subsequent tasks
applications overall performance. In order to understand these issues we need TaskInsight’s data usage classification combined with the performance profile.
2.2. Differences in Bringing New Data Sooner or Later (Histogram)
Another example where temporal locality of data at the private caches matters significantly is the benchmark histogram (with inputs: nelem=4M, nbins=256, nt=128), Figure 3. The largest slowdown we observe in a spike in the cycle count for naive, due to an increase in L2 misses (creating a difference of over 20% across the two schedules).
TaskInsight shows what the problem is (the reuse of old data and use of new data) and
where it comes from (the 18th task). Task 18 was executed as number 1 in smart, and has a particularly large data set. By bringing its data in first, it enables that data to be installed in the cache and we see reuse by subsequent tasks. On the other hand, if this task is scheduled later, as in naive, it will reuse many smaller portions of already executed tasks (with smaller data sets) which were very likely evicted from the cache. This causes a domino-effect that affects several tasks creating a substantial difference in the overall cycle count.
TaskInsight not only shows the importance of scheduling a task sooner or later because of its consequences, but it also allows us to detect which specific tasks have this type of behavior and which other tasks are affected, enabling new insight into the scheduler’s behavior.
2.3. Reusing Old Data Spikes Last Level Cache Misses (FFT)
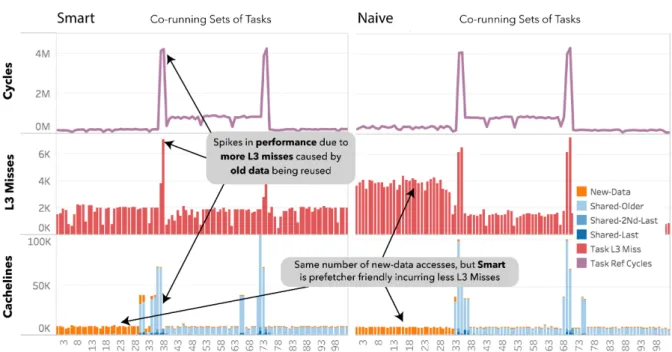
Infft(with inputs: nelem=1M,bs-tr=64,bs-fft=128) there is an interesting effect worth studying at the L3 cache level. We use the multithreaded capability of TaskInsights to analyze this. As we see from Figure 4, both schedulers show two spikes with a sudden slowdown in cycles at co-running sets 35 and 73, which are correlated with spikes in L3 misses. The number of L2 misses is not displayed in this case, for simplicity, but the trend is similar to L3.
Figure 4.TaskInsight analysis of fft, where reuse of older data incurred in more L3 cache misses, causing two spikes in the tasks cycle count
present in the cache. By correlating this data over time, we can see that this is caused by the fact that tasks executed together at these times are not scheduled to reuse data effectively.
By comparing the two schedules, we see thatnaivehas over 10% worse performance. When looking at the cycle count over time and L3 misses, we see that during co-running sets 0 to 33, it incurred in twice as many L3 cache misses, explaining where the overall performance difference is coming from.
Even though we can observe this performance and memory behavior directly with perfor-mance counters, is is only by adding TaskInsights data classification that we can understand that the extra cycles seen innaiveisonlyfromnew-dataaccesses which should be coming from the main memory. This might seem counter-intuitive, as the reuse analysis is almost identical in both schedulers, but other memory factor (not yet included in this model) like prefetching fit as a very good candidate responsible for the performance difference.
3. Related Work
Multiple visualization tools [1, 5, 7] propose diagnosing scheduling anomalies by summa-rizing and averaging information provided by both the runtime and the hardware performance counters. However, when certain tasks end up being executed in a certain order and with differ-ent performance, it is up to the programmer to reverse-engineer the scheduler’s decisions, the reasons behind them, and the moment in time where these decisions happen. With TaskInsight we analyze the memory reuse and show the reasons and the exact points in time that trigger performance variation.
Stanisic et al. [9] simulate tasks’ execution in order to isolate the scheduler’s effect on performance from tasks’ unpredictable behavior. In our work we execute the entire application on real hardware and we characterize the interaction between the scheduler and the tasks, which triggers online scheduling decisions and performance variation.
task performance, to diagnose the reasons behind performance differences across different runs of the Montblanc applications. By combining schedule independent memory access profiling (to classify how data is reused between tasks) and schedule specific hardware performance counter data (to determine performance on a given system) we are able to identify which scheduling decisions impact performance,when they happen, and why they cause a problem.
TaskInsight not only shows how a scheduler can be improved, but also gives explanations for why tasks of the same type can demonstrate drastic variation in performance (up to 60% in our examples). With this, programmers can now quantitatively analyze the behavior of the scheduling algorithm and the runtime can use this information to dynamically make better decisions, for example, by using a saved profile of the memory behavior of each task to determine what to schedule next.
Our analysis exposed scheduler-induced performance differences of above 10% due to 20% changes in data reuse through the private caches and up to 80% difference data reuse through the shared last level cache. By providing this insight into the coupling between the schedule’s behavior, data reuse through the cache hierarchy, and the resulting performance, we lay the groundwork for improving scheduling policies.
Acknowledgments
This work was supported by the Swedish Research Council, the Swedish Foundation for Strategic Research [project FFL12-0051] and carried out within the Linnaeus Centre of Excel-lence UPMARC, Uppsala Programming for Multicore Architectures Research Center.
This paper is distributed under the terms of the Creative Commons Attribution-Non Com-mercial 3.0 License which permits non-comCom-mercial use, reproduction and distribution of the work without further permission provided the original work is properly cited.
References
1. Bell, R., Malony, A.D., Shende, S.: Paraprof: A portable, extensible, and scalable tool for parallel performance profile analysis. In: Proceedings of the 9th International Euro-Par Conference, Klagenfurt, Austria, August 26-29, 2003 (2003), DOI:10.1007/ 978-3-540-45209-6_7
2. Ceballos, G., Grass, T., Hugo, A., Black-Schaffer, D.: Taskinsight: Understanding task schedules effects on memory and performance. In: Proceedings of the 8th International Workshop on Programming Models and Applications for Multicores and Manycores. pp. 11–20. PMAM’17, ACM, New York, NY, USA (2017), DOI:10.1145/3026937.3026943
high performance and technical computing. In: Proceedings of the 21th Annual International Conference on Supercomputing, ICS 2007, Seattle, Washington, USA, June 17-21, 2007 (2007), DOI:10.1145/1274971.1274984
4. Chronaki, K., Rico, A., Badia, R.M., Ayguad´e, E., Labarta, J., Valero, M.: Criticality-aware dynamic task scheduling for heterogeneous architectures. In: Proceedings of the 29th ACM on International Conference on Supercomputing, ICS’15, Newport Beach/Irvine, CA, USA, June 08 - 11, 2015 (2015),DOI:10.1145/2751205.2751235
5. Drebes, A., Pop, A., Heydemann, K., Cohen, A.: Interactive visualization of cross-layer performance anomalies in dynamic task-parallel applications and systems. In: 2016 IEEE International Symposium on Performance Analysis of Systems and Software, ISPASS 2016, Uppsala, Sweden, April 17-19, 2016. IEEE Computer Society (2016),DOI:10.1109/ISPASS. 2016.7482102
6. Duran, A., Ayguad´e, E., Badia, R.M., Labarta, J., Martinell, L., Martorell, X., Planas, J.: Ompss: a proposal for programming heterogeneous multi-core architectures. Parallel Processing Letters 21(2) (2011), DOI:10.1142/S0129626411000151
7. M¨uller, M.S., Kn¨upfer, A., Jurenz, M., Lieber, M., Brunst, H., Mix, H., Nagel, W.E.: Developing scalable applications with vampir, vampirserver and vampirtrace. In: Parallel Computing: Architectures, Algorithms and Applications, ParCo 2007, Forschungszentrum J¨ulich and RWTH Aachen University, Germany, 4-7 September 2007 (2007)
8. Peric`as, M., Amer, A., Taura, K., Matsuoka, S.: Analysis of data reuse in task-parallel runtimes. In: High Performance Computing Systems. Performance Modeling, Benchmarking and Simulation - 4th International Workshop, PMBS 2013, Denver, CO, USA, November 18, 2013. Revised Selected Papers (2013),DOI:10.1007/978-3-319-10214-6_4
9. Stanisic, L., Thibault, S., Legrand, A., Videau, B., M´ehaut, J.: Faithful performance prediction of a dynamic task-based runtime system for heterogeneous multi-core archi-tectures. Concurrency and Computation: Practice and Experience 27(16) (2015), DOI: 10.1002/cpe.3555
10. Weinberg, J., McCracken, M.O., Strohmaier, E., Snavely, A.: Quantifying locality in the memory access patterns of hpc applications. In: Proceedings of the 2005 ACM/IEEE Con-ference on Supercomputing. SC ’05, IEEE Computer Society, Washington, DC, USA (2005),