129
All Rights Reserved © 2012 IJARCSEE
Size & Complexity Design Metrics Identification to
Predict Software’s Future Attack Surface at Design Stage
for Object Oriented Design
Pankaj Pandey, Prof. Niket Bhargava
Department of Computer Science & Engineering,
Bansal Institute of Science & Technology Bhopal(M.P.)
Abstract— Software security failures are common and a long standing challenge to the research community. We can conceptualize the vulnerability of an application through its attack surface size. A system's attack surface is an indicator of the system’s security. Unfortunately predicting software’s future attack surface size during design phase in earlier stage of software development life cycle (SDLC) is largely missing.
Our objective is to investigate the statistical relationship between system’s attack surface with various size and complexity metrics to find a set of size and complexity metrics which is/are best suitable to predict software’s future attack surface early in software development cycle. In this research paper, we investigate whether software design metrics can be utilized as early indicators of system’s future attack surface size. For an experimental setting, nine open-source java-based projects were analyzed.
Our experimental results indicate that architectural information from the non-security realm such as design metrics are useful in system’s attack surface size prediction.
Keywords
— Attack surface, Complexity, Inheritance,
Coupling, Object Oriented
I. INTRODUCTION
Motivation: There is growing dependency valuable assets on computer in modern world. Think of the current prevalence of human live dependency on online banking, ecommerce, online airline reservation etc. We see that modern world demands secure software as a core requirement for human lives. Unfortunately, software security failures are increasing exponentially [1].Vulnerability and other faults in a software under construction manifest at code level though they have injected during design phase of software under construction. Preventing Vulnerability during design phase is a great idea to design secure software systems.
Software design metrics measure the software artefacts like size & complexity, inheritance, coupling and coheshion.These software artefacts can be measured during various SDLC
phases(such as design or coding)[8]. The complexity of any software system depends on program size and control structures among many other factors. Several research studies [2, 3, 4-11, 13-15] show that high size and complexity make software difficult to abstract, develop, test and maintain. Intuitively size and complexity of software may, as well, lead to introduction of vulnerabilities that can be exploited by malicious users and increase damage propagation when a system gets compromised [25].
We have selected the standard design metrics describing the size and system complexity of object oriented software. Prior research has been done on fault and vulnerability prediction by using design metrics [17, 19-23, 34]. The design-level metrics are the structural measurements defined in the Chidamber- Kemerer (CK) [24] metric suite for Object-Oriented (OO) architectures.
.
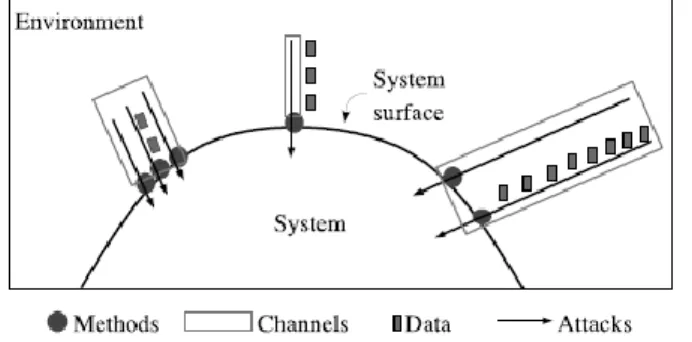
On the other side vulnerability of an application can be conceptualized through its attack surface size. A system’s attack surface is ―the set of ways in which an adversary can enter the system and potentially cause damage‖ [24]. So, the smaller an attack surface, the safer from harm and more secure the system. The channels that facilitate an attack include system entry and exit points (method calls), input strings, and data items (files). These channels are all considered attack resources that affect the size of an attack surface.
An attacker uses a system's methods, channels, and data items present in the system's environment to attack the system.
Manadhata and Wing used the entry point and exit point framework to identify the resources that are part of a system's attack surface[24].
130
All Rights Reserved © 2012 IJARCSEE environment. The method they propose for measuring attack
surface serves two purposes. First, the attack surface metric numerically characterizes the touchpoints that a system has with its external environment. Second, the metric serves as a prediction system to enable the assessment of security-related risks.
Figure 2.7 a system’s attack surface is the subset of the system’s resources (methods, channels,and data) .
II. BACKGROUND AND RELATED WORK
Attack surface has been quantified through much iteration by research community, scholars and security professionals. Attack vectors [29] was One of the earlier methods used to quantify attack surface. An attack vector is a feature such as a file with weak permissions, an unpatched loophole in software execution, a possibility of buffer overflow, etc in a system that is often used in attacks on that system. The particular set of attack vectors is different for each system analyzed and the choice of attack vectors was not systematic, and was completely up to the discretion of the individual who was analyzing the system. In this early attack surface focused work typically, a security expert chose appropriate attack vectors to identify all possible attack points. Then these attack points were ranked in order of damage potential. Often in attack vector method an expert was also required to identify system’s known security flaws and issues along with security expert. Although attack vector method was effective for measuring the attack surface of a program, but it was not practical and could not be completed by an educated security novice, or completed systematically, such as through an analysis program. It required expert knowledge of both security and the program itself. The next method for measuring an attack surface adopted a qualitative approach. An input/output automaton was developed for a system, which allowed the easy identification of channels of attack and attackable resources [31].
Pratyusa K. Manadhata et al proposed a formal model for a system’s attack surface [1] .They formalized the notion of a system’s attack surface using an I/O automata model of the system[28] and defined a quantitative measure of the attack surface in terms of three kinds of resources used in attacks on the system: methods, channels, and data.In their research work[1] they introduced the entry point and exit point
framework based on an I/O automata model of a system and define the system’s attack surface in terms of the framework.They had also established that with respect to the same attacker, a larger attack surface of a system leads to a larger number of potential attacks on the system and introduced the notions of damage potential and effort to estimate a resource’s contribution to the measure of a system’s attack surface and define a qualitative and a quantitative measure of the attack surface.
Complexity and Attack Surface
Recently, there have been a few attempts at identifying vulnerability-prone functions using code-level complexity metrics by Shin and William [30-32].But there is no known work to predict system’s future attack surface during design phase using complexity design metrics. Therefore, our study incorporates design metrics which are not considered in [30-32]. We use statistical techniques to predict system’s future attack surface attack surface size during SDLC process of software development.
Our objective is to investigate the statistical relationship between system’s attack surface with various size and complexity metrics to find a set of size and complexity metrics which is/are best suitable to predict software’s future attack surface early in software development cycle.
III.MATERIALSANDMETHODS
This study focuses solely on Java-based applications. Several open source java applications are selected to be the case studies for this research. We have chosen nine java applications (see appendix A) spanning to a wide range of software applications as follows:
The size and complexity design metrics are collected from the source code of above selected java applications.Following size and complexity design metrics are chosen and analyzed based on the belief that what they measure is likely to have a significant impact on an attack surface measurement.:
NOP Number of Packages: the number of high-level packaging mechanisms, e.g., packages in Java, namespaces in C++, etc.
NOC Number of Classes, i.e., the number of classes defined inthe system, not counting library classes.
NOM Number of Operations,1 i.e., the total number of user defined operations within the system, including both methods and global functions (in programming languages that allow such constructs).
LOC Lines of Code, i.e., the lines of all user-defined operations(lines of code belonging to methods) are counted.
131
All Rights Reserved © 2012 IJARCSEE [McC76] for all operations.We use this metric to quantify the
intrinsic functional complexity of the system.
The Microsoft Attack Surface Analyzer beta version is used to measure the attack surface of the java applications. The analyzer scans for items such as running processes, open ports, new firewall rules, directories with weak permissions, and other unsecure events or states. The analyzer assigns a severity ranking to the security issues found, which represents the ratio of damage potential to effort value. After each application is scanned and a report is generated, the issues are totaled to get a measurement of the attack surface for each java application.
TABLEI
DESIGN METRICS AND ATTACK SURFACE FOR 9JAVA OPEN-SOURCE
PROGRAMS
Java Applications
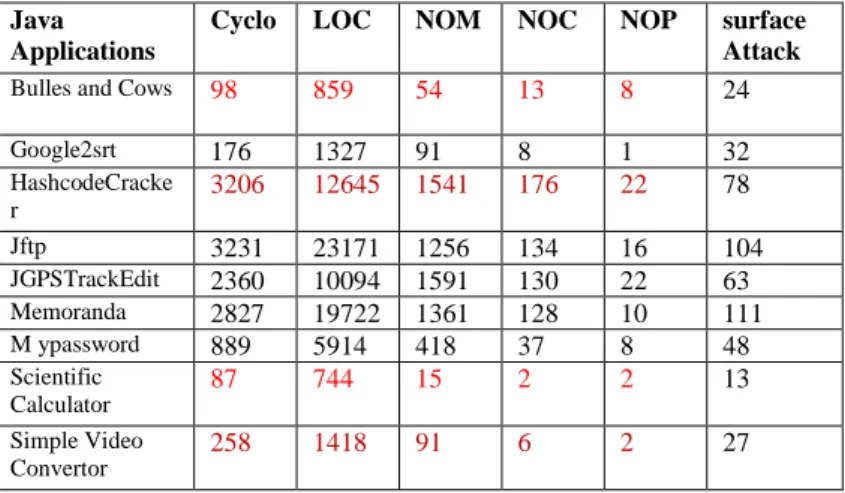
Cyclo LOC NOM NOC NOP surface Attack Bulles and Cows 98 859 54 13 8 24
Google2srt 176 1327 91 8 1 32
HashcodeCracke r
3206 12645 1541 176 22 78
Jftp 3231 23171 1256 134 16 104 JGPSTrackEdit 2360 10094 1591 130 22 63 Memoranda 2827 19722 1361 128 10 111 M ypassword 889 5914 418 37 8 48 Scientific
Calculator
87 744 15 2 2 13
Simple Video Convertor
258 1418 91 6 2 27
The correlation coefficients are calculated for each metric and the attack surface as two data sets, yielding five different coefficients, which can be seen in Table II. Correlation coefficients range from -1 to 1. For correlations between two sets of data, a value of 0 means that no correlation whatsoever exists. If you have a value from one set, with a correlation of 0 you can make no assumptions at all about the corresponding value from the other set. If the correlation coefficient is positive, however, it means that as the values of one data set get larger so do the values in the other set. Similarly, if the correlation is negative, as values of one data set get larger, the values in the other data set will get smaller. A correlation coefficient of 1 or -1 means there is aperfect correlation between the two data sets; if the sets were graphed as a scatter plot, connecting the dots would yield a perfectly straight line. Typically, a correlation coefficient from .85 to 1 or from -.85 to -1 is considered a strong correlation. In this context, it would mean that there is a strong correlation between a given metric and the attack surface size for this data set.
TABLEIII
CORRELATION OF THE DESIGN METRICS AND ATTACK SURFACES
Size and
Complexity Metrics
Correlation Coefficient
CYCLO
0.93
LOC
0.98
NOM
0.86
NOC
0.87
NOP
0.64
RESULT ANALYSIS:
The first observation is that all of the correlation coefficients are .85 or greater except for NOP., indicating that the relationships between each metric and attack surface are strong correlations(except NOP).From the above observation LOC and CYCLO is strong predictor of software’s future attack surface size whereas NOM and NOC is also good indicator of predicting any software’s future attack surface size. Although NOP is not strongly correlated with attack surface size metrics yet there is positive correlation of attack surface size with NOP.
T-Test Analysis
We conduct a t-test to determine whether the statistical relationship between the design metrics and the attack surface measure is real or just the result of chance. All of the t-tests are significant at the 0.05 level. The p-values for each of the T- tests are listed in Table III.
TABLIIIII
T-Test P-Values Pairing Each Collected Metric with the Attack Surface Measurements
T-Test P-Values
Design Metrics Two tailed P- Value
CYCLO 0.01
LOC 0.01
NOM 0.02
NOC 0.02
NOP 0.003
132
All Rights Reserved © 2012 IJARCSEE Fig. 1 Attack Surface Size versus the Complexity Design Metric CYCLO
Value
Every metric except for NOP has a correlation with attack surface that is greater than .85, indicating that the total number of possible program paths summed from all the operations in the system, the number of classes, the lines of all user-defined operations, the number of operations in classes, the total number of user defined operations within the system and the number of classes defined in the system are all strong predictors of attack surface size.
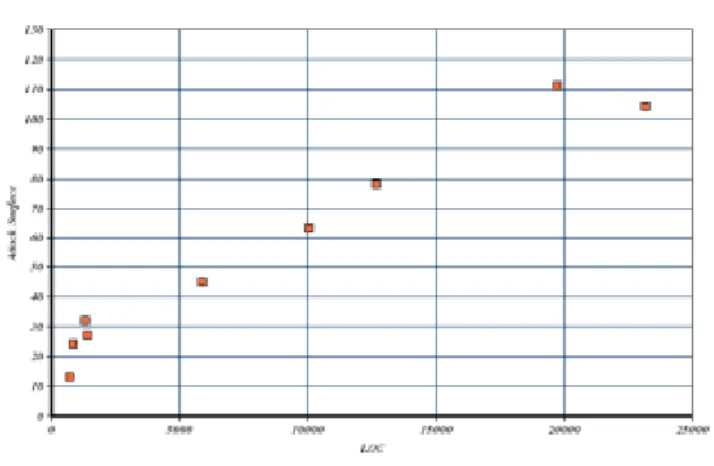
The strongest correlation is LOC. It has a .98 correlation, which is nearly perfect. Why LOC ties so closely to attack surface size is that many of the user defined operations are highly weighted and relies on the external sources such as files, ports, and entities that are used to evaluate attack surface measurement.
Another reason that LOC is linked so closely to attack surface is that every time a user defined operations call an external service, it essentially opens an extra avenue of attack into the operation itself and make the application easier to attack, many will, and the developer is then basing the security of his package on the security of the outside service that he is relying on. Essentially, it only takes one weak user defined operation to break a chain, and the higher the weight of user defined operations, the more chance of adding weak links to the security chain of a program.
Fig. 2 Attack Surface Size versus the Complexity Design Metric LOC Value
Fig. 3 Attack Surface Size versus the Complexity Design Metric NOM Value
133
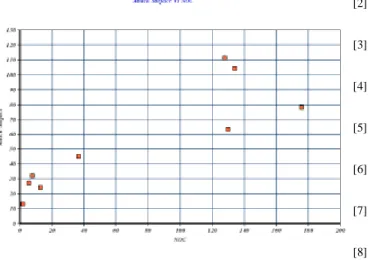
All Rights Reserved © 2012 IJARCSEE Fig. 4 Attack Surface Size versus the Complexity Design Metric NOC Value
Fig. 5 Attack Surface Size versus the Complexity Design Metric NOP Value
In this research paper we have shown how size and complexity design metrics appear to be feasible predictors of system’s future attack surface size.Considering all these metrics during the design process of any software will potentially lead to more secure applications.
In the future, research in this area should be taken in several different directions. First, other languages should be analyzed to determine if these java specific findings still hold true. Another avenue of research would be to specify the specific area in software design area that most contributes to attack surface.
REFERENCES
[1] Computer Emergency Response Team Coordination Center (CERT/CC), http://www.cert.org/stats/cert_stats.html (accessed July 2009).
[2] V. Basili, L. Briand and W. Melo, "A Validation of Object-Oriented Design Metrics as Quality Indicators," IEEE Trans. on Software Eng., vol. 22, 1996, pp. 751-761.
[3] M. Cartwright and M. Shepperd, "An Empirical Investigation of an Object-Oriented Software System," IEEE Trans. on Software Eng., vol. 26, no. 8, 2000, pp. 786-796.
[4] K. O. Elish and M. O. Elish, "Predicting Defect-prone Software Modules Using Support Vector Machines," The Journal of Systems & Software, vol. 81, 2008, pp. 649-660.
[5] K. E. Emam, W. Melo, and J. C. Machado, "The Prediction of Faulty Classes Using Object-Oriented Design metrics," The Journal of Systems & Software, vol. 56, 2001, pp. 63-75.
[6] W. M. Evanco and W. W. Agresti, "A Composite Complexity Approach for Software Defect Modelling," Software Quality Journal, vol. 3, 1994, pp. 27-44.
[7] N. E. Fenton, P. Krause, and M. Neil, "A Probabilistic Model for Software Defect Prediction," IEEE Trans. on Software Eng., vol. 2143, 2001, pp. 444-453.
[8] N. E. Fenton and S. L. Pfleeger, Software Metrics: A Rigorous and Practical Approach, PWS Publishing Co., Boston, MA, USA, 1997.
[9] A. Janes, M. Scotto, W. Pedrycz, B. Russo, M. Stefanovic, and G. Succi, "Identification of Defect-prone Classes in Telecommunication Software Systems Using Design Metrics," The Journal of Systems & Software, vol. 176, 2006, pp. 3711-3734.
[10] J. K. Kearney, R. L. Sedlmeyer, W. B. Thompson, M. A. Gray, and M. A. Adler, "Software Complexity Measurement," ACM Communications, vol. 29, no. 11, 1986, pp. 1044-1050.
[11] G. Koru and J. Tian, "An Empirical Comparison and Characterization of High Defect and High Complexity Modules," The Journal of Systems & Software, vol. 67, 2003, pp. 153- 163.
[12] [47] T. Menzies, J. Greenwald, and A. Frank, "Data Mining Static Code Attributes to Learn Defect Predictors," IEEE Trans. on Software Eng., vol. 33, no. 9, 2007, pp. 2-13.
[13] N. Nagappan, T. Ball, and A. Zeller, "Mining Metrics to Predict Component Failures," in Proceedings of the 28th International Conference on Software Engineering, Shanghai, China, May 2006, pp. 452-461.
[14] G. Succi, W. Pedrycz, M. Stefanovic, and J. Miller, "Practical Assessment of the Models for Identification of Defect-prone Classes in Object-Oriented Commercial Systems Using Design Metrics," The Journal of Systems & Software, vol. 65, 2003, pp. 1-12.
[15] H. Zhang, X. Zhang, and M. Gu, "Predicting Defective Software Components from Code Complexity Measures," in Proceedings of the 13th Pacific Rim International Symposium on Dependable Computing, Melbourne, Australia, Dec. 2007, pp. 93-96.FLEXChip Signal Processor (MC68175/D), Motorola, 1996.
[16] I. Chowdhury , B. Chan , and M. Zulkernine, ―Security Metrics for Source Code Structures,‖ in Proceedings of the 4th International Workshop on Software Engineering for Secure Systems, Leipzig, Germany, May 2008, pp.57-64.
[17] W. M. Evanco and W. W. Agresti, "A Composite Complexity Approach for Software Defect Modelling," Software Quality Journal, vol. 3, 1994, pp. 27-44.
[18] [24] N. E. Fenton, P. Krause, and M. Neil, "A Probabilistic Model for Software Defect Prediction," IEEE Trans. on Software Eng., vol. 2143, 2001, pp. 444-453.
[19] J. Grossman, ―Website Vulnerabilities Revealed: What everyone knew, but afraid to believe,‖ White Hat Security Inc,
http://www.whitehatsec.com/home/assets/presentations/ PPTstats 032608.pdf (accessed July 2009).
[20] M. H. Halstead, Elements of Software Science. New York: Elsevier, 1977.
[21] A. E. Hassan, ―Predicting Faults Using the Complexity of Code Changes,‖ in Proceedings of the 31st International Conference on Software Engineering, Vancouver, Canada, May 2009, pp. 45-56. [22] A. E. Hassan, Mining Software Repositories to Assist Developers and
134
All Rights Reserved © 2012 IJARCSEE [23] IEEE, IEEE Std. 982.1-1988 IEEE Standard Dictionary of Measures to
Produce Reliable Software, The Institute of Electrical and Electronics Engineers, Jun. 1988.
[24] Manadhata, Pratyusa K. An Attack Surface Metric. Pittsburgh: Carnegie Mellon University, 2008.
[25] Howard, M., Pincus, J., Wing, J.: Measuring relative attack surfaces. In: Proc. of Workshop on Advanced Developments in Software and Systems Security (2003).
[26] Manadhata, P. andWing, J.: An Attack Surface Metric. IEEE Trans. Software Eng. 37, 371–386, 2011
[27] Pratyusa K. Manadhata Dilsun K. Kaynar , Jeannette M. Wing A Formal Model for A System’s Attack Surface CMU-CS-07-144 July 2007
[28] N. Lynch and M. Tuttle. An introduction to input/output automata. CWI-Quarterly, 2(3):219– 246, September 1989.
[29] Howard, Michael. " Mitigate Security Risks by Minimizing the Code You Expose to Untrusted Users." http://msdn.microsoft.com/en-us/magazine/cc163882.aspx
[30] Hafiz, M., Adamczyk, P. and Johnson, R.: A Catalog of Security-Oriented Program Transformations. Technical Report UIUCDCS-R-2009-3031, University of Illinois at Urbana-Champaign, Jan 2009. [31] Y. Shin, ―Exploring Complexity Metrics as Indicators of Software
Vulnerability,‖ in Proceedings of the 3rd International Doctoral Symposium on Empirical Software Engineering, Kaiserslautem, Germany, Oct. 2008, available from the author’s website http://www4.ncsu.edu/~yshin2/ papers /esem2008ds_shin.pdf (accessed July 2009).
[32] Y. Shin and L. Williams, "An Empirical Model to Predict Security Vulnerabilities Using Code Complexity Metrics," in Proceedings of the 2nd ACM-IEEE International Symposium on Empirical Software
Engineering and Measurement, Kaiserslautern, Germany, Oct. 2008, pp. 315-317.
APPENDIXA
Bulles and Cows: Classic mastermind game.
http://sourceforge.net/projects/mybullsandcows/
Google2srt: Google2SRT is a tool that can download "not embedded" subtitles (Closed Captions - CC) from YouTube/Google Video videos (if those are present) and convert them to a standard format (SubRip - SRT) supported by most video players. http://google2srt.sourceforge.net
HashcodeCracker: This software cracks the MD5,
SHA1,NTLM(Windows Password) hash codes.
Jftp: JFtp it is a FTP Client, written on java. Project provides well convenient user interface for performing ftp operations, generally for file or/and directories transfer. http://gftp.sourceforge.net/
JGPSTrackEdit: JGPSTrackEdit is a tool for editing gps tracks and
planning (multiple days) tours (GPS track editor).. http://sourceforge.net/p/jgpstrackedit/wiki/Home/
Memoranda: Memoranda (formerly known as jNotes2) is a
cross-platform diary manager and a personal project management tool. http://memoranda.sourceforge.net/
Mypassword: MyPasswords is a very light-weight, secure and easy-to-use password manager. http://www.mypasswords7.com/
Scientific Calculator : This Calculator is beautifully designed, having both standard and scientific modes of calculations. It is built to run anywhere, as its written completely in java. http://codecypher.blogspot.in/
Simple Video Convertor: FRONTEND for mencoder for Windows and