Original Research Article
*Corresponding Author:
Utilization Of SSR Markers For Identification Of Horse Gram (
Macrotyloma
uniflorum
(Lam.) Genotypes
Uma Rani K1*, Narayanaswamy S1, Nethra N1 and Rajendra Prasad S2 1National Seed Project, University of Agricultural Science, GKVK, Bangalore-560 065
2Directorate of Seed Research, ICAR, Kushmuar village, PO: Kaithauli, Maunath Bhanjan 275 101 UP (INDIA)
Received for publication: November 04, 2013; Accepted: November 18, 2013.
Introduction
Horse gram (Macrotyloma uniflorum (Lam.) verdc. belongs to genera Macrotyloma, family Fabaceae (alt.
Leguminosae), subfamily Faboideae, tribe
Phaseoleae, subtribe Phaseolinae. It as synonyms of Dolichos uniflorus and Dolichos biflorus with chromosome number of 2n=20, 22 and 24. Macrotyloma comprises about 25 species; most of them are restricted to Africa. Within Macrotyloma uniflorum 4 varieties have been distinguished viz., Var. Uniflorum, Var. Stenocarpum, Var. Verrucosum and Var. Benadirianum.
The origin of horse gram is not known but the region of maximum genetic diversity is considered to be in the Old World Tropics, especially in India and Himalayas (Zeven and de Wet, 1982). It is protein rich (20-24%) cattle feed largely used in south India. Although, horse gram is an important crop of south India and predominantly grown in about 2 million hectares, the latest survey indicates that its cultivation has been drastically reduced to nearly 0.6 million hectares, indicates its replacement by other crops. Horse gram is the poor man's pulse
crop in Southern India where the seeds are parched and then eaten after boiling or frying, either whole or as a meal. The seeds are important food for cattle and horses and are usually given after boiling. The stems, leaves and husks are used as fodder. In Burma, the dry seeds are boiled, pounded with salt and fermented to produce a sauce similar to soy sauce from Glycine max. Horse gram is also grown as a green manure crop. It is also said to be good for patients suffering from urinary and kidney problem.
Until recently, the crop improvement programme in horse gram was not given the required attention and very few selections
viz., CO.1 (Tamil Nadu), Hebbal Huralli-1 and Hebbal Hurali-2 (Karnataka), Sina and man (Maharastra), HPK (Himachal Pradesh), BK-1 (Bihar) have been released for cultivation. The productivity level is still below the profitable line. Hence, there is immense scope to improve upon. Though, traditionally, it is being grown in South India, recently in North India substantial area is under horse gram cultivation. In this background, NBPGR regional station, Akola has assembled the Abstract: Horse gram is the poor man's pulse crop in southern India where the seeds are parched and then eaten after boiling or frying, either whole or as a meal. Horse gram (Macrotyloma uniflorum) varietal characterization and identification of distinguishing characters is most important in agricultural crops to assess genetic purity of seed in seed production programme. Characterization of twenty two horse gram genotypes viz., 38, AK-42,AK-42C, BGM-1, BJPL-2, CRHG-4, CRHG-17, CRHG-18, HG-07, HG-34, PHG-9C, VLG-22, VLG-21, TCR-81, TCR-73, TCR-117, TCR-223, TCR-244, TCR-268, TCR-614, TCR-74 and PHG-9 was carried out with different SSR markers of the runner bean or scarlet runner bean (Phaseolus coccineus), which will be useful in broad classification of genotypes. A set of 10 SSR primers amplified 26 alleles from 22 horse gram genotypes. On an average of 2.6 alleles per marker were amplified. All most all the primers amplified minimum of 2 alleles. Some of the primers viz., CA-910489, CA-911990, CA-911600 and CA-912170 amplified maximum of 3 alleles. Highly distinct genotypes among the selected germplasm were BGM-1 with TCR-74 and AK-38 followed by TCR-74 with TCR-614 and VLG-22 with TCR-223 which could be successfully utilized in the breeding programme and genetic purity testing of horse gram crop improvement.
germplasm under exploited or orphan
multiutility economic crop. Several
exploration trips have been under taken by the scientists of the NBPGR headquarters and its regional stations to capture the variability of this crop. However, the Akola regional
station has been actively engaged in
characterization, evaluation, documentation and conservation activities of this crop. Further, scope of crop improvement depends on the conserved line of genetic variability and diversity in the plant breeding programmes and use of new biotechnological tools. Despite its economical importance, horse gram molecular genetics and genomics have not been explored yet. So, as a first step, there is need to put effort for the isolation and characterization of genotypes. Characterization based on phenological and morphological characters usually varies with environments and evaluation of these traits requires growing the plant to full material prior to identification. Now, the rapid development of biotechnology allows easy analysis of a large number of loci distributed throughout the genome of plants. Recent trend of identification of genotypes is through simple sequence repeats (SSR).
SSR’s are short sequence elements arranged in simple internal repeat structure (Tautz 1989) that are densely and randomly distributed throughout eukaryotic genomics. The number of microsatellite/ SSR has been shown to be highly variable within and between species and subspecies. Because of their high mutation rate, they constitute the molecular markers with the highest polymorphic information content. This characteristic has promoted the application of SSR’s as molecular markers in fingerprinting (Weising et al., 1995; Diwan and Cregan 1997; Shikawa et al., 1999), genome mapping (Marion et al., 1995; Broun and Tanksley 1996; McCouch et al., 1997; Rader
et al., 1998; Winter et al., 1999; Scotti et al.,
2000), marker assisted breeding and population genetics (Goldstein et al., 1999).
Molecular markers have proven to be powerful tools in the assessment of genetic variation and in the elucidation of genetic relationship within and among species (Cooke, 1999). In the present investigation the main objective was to assess / identify the efficiency of SSR markers in characterization of twenty two horse gram genotypes.
Material and methods
Plant material:Authentic seeds of twenty two horse gram genotypes were procured from All India Coordinated Research Project (AICRP) on legumes ZARS, UAS, Bangalore and were listed in Table 1. The genotypes were raised in seed trays at National Seed Project, UAS, Bangalore.
Table 1: Elite genotypes of horse gram used for the study
Sample preparation:
The leaf samples from 21 days old seedlings were collected and frozen in liquid nitrogen and isolated in at -800c freezers.
Isolation of DNA:
DNA was extracted as per the CTAB (Cetyl Trimethyl Ammonium Bromide) method (Cao and Oard, 1997) with slight modifications. 1.5-2g frozen leaves were taken in 2 ml centrifuge tube with addition of 6 ml ice cold extraction buffer (0.1 M Tris, 0.5 M NaCl, 0.05 M EDTA and 0.01 M β-mercaptoethonol). The sample was grinded in to fine mixture by using fine grinder along with beads and the ground powder was incubated at 650C for 30 minutes with intermittent shaking. The mixture was centrifuged at 4000 rpm for 10 minutes at 40C, then supernatant was taken into separate tube and equal amount of wet chloroform was added and again centrifuged at 4000 rpm for 10 minutes. This step was repeated twice. For the final supernatant equal volume of ice cold isopropanol was added and kept in -200 C for overnight. The solution was centrifuged at 4000 rpm for 10 minutes and supernatant was discarded and the DNA pellet was washed with 70% ethanol. The dried DNA pellet was resuspended in 1 ml TE (Tris-EDTA) buffer and transferred to 2 ml eppendorf tubes. The final pellet was dissolved in 0.5 ml TE. The DNA concentration was determined by using “Nanophotometer” (procedure as given by manufacturer) and the
quality verified by electrophoresis on a 0.8% agarose gel.
PCR amplification:
The basic protocol reported by Williams et al., (1990) for PCR was followed with slight modifications. The runner bean or scarlet runner bean (Phaseolus coccineus) is a plant in the Fabaceae family: these species primers were used for the study, because horse gram specific SSR markers are not yet developed. The PCR reactions were carried out in 20 µl reaction mixture containing template DNA (15 ng/µl), reaction buffer (10X) 1µl, dNTPs (2 mM) 1µl, 5 pmol of primer, Taq DNA polymerase (3 U/µl) 0.3 µl
and 2 mM MgCl2. The mixture was overlaid with one drop of mineral oil to prevent evaporation of the reaction mixture. Amplification was performed in a thermal cycler Bio rad for 35 cycles after an initial denaturation temperature 940C for 3 minutes, touch down 10 cycles (-0.5c/ cycle), denaturation 940C for 30 seconds, primer annealing 580C for 30 seconds, primer extension 720C for 1 minute, complete final extension 720C for 10 minute and hold temperature 40C until PCR plate was removed. SSR primers used for the study are listed in Table 2.
Table 2: SSR primers used for the study
Sl. No. Primer Name Forward sequence Reverse sequence
1 CA906441 CTTCCCCACTGATTCATTTCTGTT CACTCCCCTTTGTTCTTGATTATG
2 CA909226 GATCTCTTTCACGCTGGACAT CACATAGCGACATGCTAGAACACT
3 CA910489 AGAAAAAGGAGGGAAATGCTGCTA TTGCCTCCGCTTTCTTTATCTTTC
4 CA910598 CCTCCAATTCGGTTCCAGCACTTC GCCCTTGATCTTCCTCTTTTTACG
5 CA911600 AACTGGTTCATCGCATTACTCTTC TGGCATCACCTTGTTTGGCATTAG
6 CA911990 TTTCATCCCCAGCATCAGCAGTTT TGGGGGTGGGGCAGAATCA
7 CA912170 TGGAGAAAGCATGGCAGGATACT CCCCGGAGGCAAGATTTCAA
8 CA914165 GATAATTTTGACGAGGGAGCAGA GGTGGAGAACAGGAGCAAAGTATT
9 CA912542 TTATTGGAGTTGCCCTGTTCTTCA GCCCCGTCTGCATTCCTTTGT
10 CA906286 CGGGCGGGGGAGATTGT CCCAGCCCACGTAAGGTAAGAAC
11 CA910928 CGGAATCTGGTCGGCCTACATCTA TGATACCCCTCCGGCAACAAG
12 CA907856 ACACTTGAGGGAAAGCCATCA TTCCAAGCCAAAGCAATAAC
13 CA906298 TAGTTGACCGGTTATCTGTTGTTT GCGCCTACGAGCATCACTTA
14 CA912634 GACGGAATGAAGTTGAAGGTGGAT AGATGGGCCAAGATATTTTAGACT
15 CA913150 CGGAGATGGTGGCGTGTTATT CTTGTGCAGCCTTGTTTTCAGC
16 CA911895 CATCTGCTTTTGCCCATTACG CACCAAGCCGCTCTAGCAAGTTAT
17 CA911460 GAGCTGCAACAAGGAATGGATG ATGAGGGCTAACAGGAAAAGAAGG
18 CA902380 GGCCCCCTCAGACAGAT AGATAAATTTGGGCTTGAA
19 CA907467 AGCCTGTCAATTCCAAACTCCACT ATCCAACTTCAGCACCCAGACAAA
20 CA907742 TCGGTTGAAAAAGAAAAGCAGAAG ATAGGCACTCAGGAAGGGAATGTC
21 CA900698 TTGTTCTCAGCGCAATGTGG CTGAGCACCAAAGCCCCTGACA
22 CA900229 TGCCGAGTCATCCCGAACAT CTCCAAAGCTGAAGCGAACCA
23 CA914163 ATGGTGAATGCCTGAAACAAATAC CATGACAAATGCCTGAATAAGACT
DNA electrophoresis:
Amplified DNA fragments were separated out on 2.5% agarose gel in 1X TBE buffer stained with ethidium bromide. Running buffer containing Tris-base, boric acid and EDTA (pH 8.3) was used for electrophoresis. Wells were loaded with 10 µl of reaction volume and 4µl of loading dye (sucrose and bromophenol blue dye) together. Electrophoresis was conducted at 40-75V for 5-8 hr and the gel photographed by using Vilber lourmat– Doc gel documentation unit.
DNA analysis:
The bands generated by SSR primers were scored by binary coding treating 11 for first level of band and 22 for second level of band and 33 for third level of band for a given primer. Analysis of banding pattern was carried on NTSYS ver 2.0. The program used was joining cluster analysis (tree clustering) with raw input data. The main parameters which guided the joining cluster process linkage rule was Unweighed Pair Grouping Average (UPGMA) and the distance was computed from raw data using squared Euclidean distances and Dendrogram was obtained.
Results
The quality of DNA isolated was obtained by electrophoresis and it was also confirmed by Nanophotometer reading. In both the cases quality of DNA observed was 50-500 ng/µl for all the genotypes.
All the twenty two genotypes were tested for DNA profiling to know the extent of genetic relatedness and for fingerprinting using microsatellite (SSR) markers. A set of twenty four SSR markers were used for molecular profiling. The products were run on 2.5 per cent agarose gel. Here only 10 SSR primers showed polymorphic bands out of twenty four primers for horse gram genotypes.
Genetic analysis:
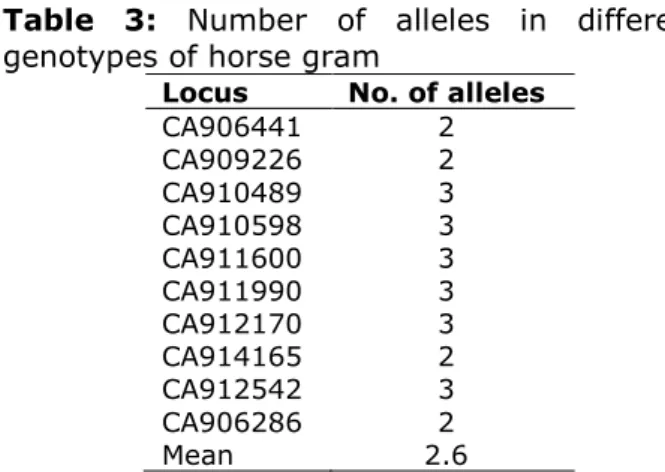
A set of 10 SSR primers amplified 26 alleles from 22 horse gram genotypes. On an average of 2.6 alleles per marker were amplified. All most all the primers amplified minimum of 2 alleles. Some of the primers
viz., CA-910489, CA-911990, CA-911600 and CA-912170 amplified maximum of 3 alleles (Fig. 1 and Table 3).
Table 3: Number of alleles in different genotypes of horse gram
Locus No. of alleles
CA906441 2
CA909226 2
CA910489 3
CA910598 3
CA911600 3
CA911990 3
CA912170 3
CA914165 2
CA912542 3
CA906286 2
Mean 2.6
Cluster analysis was based on similarity matrices obtained with unweighted pair group method analysis (UPGMA). Based on the shared allele’s genetic similarity co-efficient was estimated for each pair of the 22 horse gram genotypes which ranged from 0.1 to 0.9. Except for AK-42, AK-42C, BJPL-2, CRHG-44, CRHG-17, CRHG-18, HG-34 and PGH-9C, the dendrogram clearly discriminated all the remaining horse gram genotypes. Genotypes AK-42, AK-42C, BJPL-2 and CRHG-4, CRHG-17 with CRHG-18 and HG-34 with PHG-9C were remained together with similarity of 90 per cent.
Fig.1: DNA profile of horse gram genotypes amplified by SSR primers
group B included 7 genotypes (Table 4). The major group was again subdivided into sub group I, II and III while 3 subclusters of group B was named as groups IV, V and VI. Genotypes AK-42, AK-42C, BJPL-2 and CRHG-4 showed no difference with each other and were grouped with BGM-1 at a genetic similarity of 88 per cent. The II sub cluster was again sub divided into 3 groups. CRHG-17 and CRHG-18 which are highly similar to each other were grouped with HG-34 and PHG-9C, with a genetic similarity of 88 per cent. Genotype PHG-9 and HG-07 were grouped separately with the above at a genetic similarity of 85 and 83 per cent, respectively.
The III sub cluster was again subdivided into groups with VLG-22 and TCR-81 and TCR-73 and TCR—117 at a genetic similarity of 89 per cent which in turn grouped at a genetic similarity of 85 per cent. The IV sub cluster consisted of VLG-21 and TCR-268 was grouped together at a similarity of 69 per cent. The V sub cluster consisted of TCR-223 and TCR-614, which were grouped at a genetic similarity of 69 per cent while, genotypes AK-38 was grouped separately with TCR-614 and TCR-223. Very low genetic similarity of 50 per cent and inturn was grouped with all the above clusters at genetic similarity of 30 per cent. The last sub cluster consisted of TCR-244 and TCR-74 with a genetic similarity of 69 per cent which inturn was grouped with all the above clusters at a very low genetic similarity of 28 per cent. SSR marker CA-910489 could differentiate maximum three genotypes (117, TCR-614 and PHG-9) followed by CA-910598 and CA-911600 in which three genotypes viz., TCR-244, TCR-74, AK-38 and VLG-244, PHG-9 respectively. Thus, these five primers CA-910489, CA-910598, CA-91600, CA-911990 and CA-912170 could be used for differentiation of horse gram genotypes with the presence of specific bands.
Discussion
Genetic variation could be caused by genetic recombination and mutation. Although, high cleistogamic nature of horse gram can inhibit extensive gene flow between plants and populations, limited gene-flow would be allowed by insect pollination or wind. If any anonymous mutation occurred in plant, this plant spread these mutations by seed dispersal (Richards, 1997).
The polymorphism detected by these primer pairs did not correlate with the number of repeats in the microsatellite. Although the relationship between the degree of polymorphism and the number of repeats has been reported in some species (Saghai Maroof et al., 1994; Fisher et al., 1998), theoretically the number of repeats is correlated with the mutation rate and not with the degree of polymorphism (Brinkmamm et al., 1998., Xu et al., 2000). Polymorphism may correlate with the product of mutation rate and the generation term of the locus. More recently evolved markers would have fewer polymorphisms because of fewer occasions for mutation, even if they have longer repeats. The twenty two genotypes of horse gram used for characterize analysis were grouped into six clusters (Fig. 2). Among the twenty four primer pair tested, ten gave polymorphism in the tested genotypes. All sample analysis was conducted twice to test for reproducibility and only the reproducible and unambiguous bands were used for the analysis.
Fig. 2: Dendrogram based on genetic distance calculated from four SSR loci using UPGMA as the cluster method indifferent horse gram genotypes
no difference with each other and were grouped with BGM-1 at a genetic similarity of 88 per cent. A dendrogram was constructed using the UPGMA method. This approach successfully discriminated most of the horse gram genotypes tested. Cluster analysis with SSR markers resulted in six cluster group. On the basis of polymorphism data, genetic distance values were calculated that ranged from 0.28 to 1.00. TCR-74, AK-42, AK-42C, BJPL-2 and CRHG-4 were found to span the extremes of the dendrogram, with all other germplasm distributed in between at the maximum genetic distance of 0.79.
Table 4: Distribution of horse gram genotypes into different clusters using SSR markers
SI No.
Cluster No.
No. of
sub clusters
Sub clusters
No.of the genotypes
Name of
the genotypes
1 I III I 5 AK-42,
AK-42C, BGM-1, BJPL-2, CRHG-4
II 6
CRHG-17,CRHG-18 07, HG-34, PHG-9 PHG-9C
III 4 TCR-73,
TCR-81, TCR-117, VLG-22
2 II III I 2 TCR-268,
VLG-21
II 3 AK-38,
TCR-223, TCR-614
III 2 TCR-74,
TCR-244
All TCR and VLG series genotypes except AK-38 were grouped at the lower part of the dendrogram which are all morphologically dwarf type with plant height < 50 cm except TCR-268 and few of the genotypes has heavy test weight and seed shape of kidney in this cluster. Rest of the genotypes like AK, CRHG, HG, PHG, BGM and BJPL were grouped at the upper part of the dendrogram which were morphologically tall genotypes with values ranging from 50 to 70 cm and few of the genotypes had spreading growth habit except AK-42 and AK-42C.
Conclusion
Our study confirmed a high potential of specific microsatellite as excellent molecular markers for horse gram genotypes identification, differentiation and evaluation of their genetic variation. Highly distinct genotypes among the selected germplasm were BGM-1 with TCR-74 and AK-38 followed by TCR-74 with TCR-614 and VLG-22 with
TCR-223 which could be successfully utilized in the breeding programme of horse gram crop improvement. The study also shows that there is cross compatibility of markers between horse gram and runner bean.
Acknowledgement
Authors would like to thank National Seed Project, University of Agricultural Science, Bangalore for providing facilities and All India Coordinated Research Project (AICRP) on legumes ZARS, UAS, Bangalore, for providing seed materials. “This research received no specific grant from any funding agency, commercial or not-for-profit sectors”.
References
1. Broun P, and Tanksley SD, Characterization and genetic mapping of simple repeat sequences in the tomato genome. Mol.Gen.
Genet, 1996, 25:39-49.
2. Cao D and Oard JH, Pedigree and RAPD based DNA analysis of commercial U.S rice cultivars,
Crop Sci., 1997, 37: 1630-1635.
3. Cooke RJ, Varietal identification of crop plants.
New diagnostics in crop sciences, 1999, pp: 33-63.
4. Dehemer KJ, and Friedt W, Evaluation of different microsatellite motifs for analyzing genetic relationship in cultivated sunflower
(Helianthus annuus L.). Plant breed. 1998
1:39-42.
5. Diwan N, and Cregan PB, Automated sizing of flurescent-labeled simple sequence repeat (SSR) markers to assay genetic variation in soybean. Theor. Appl. Genet., 1997, 95:723-33.
6. Fisher PJ, Gardner RC, Richardson TE, Single locus microsatellite isolated using 5 anchored PCR. Nucleic Acids. Res., 1996, 24: 4369-4371.
7. Gentzdittel L, Mestries E, Mouzeyarat F, Badaquir S, Vear F, Tourvieille De Labrouhe, D, Anf Nicolas P, A composite map expressed sequences and phenotypic traits of the sunflower (Helianthus annuus L.) genome.
Theor. Appl. Genet., 1999, 99:218-234.
9. Marino MA, Turni LA, Dei Rio SA, Williams PE, and Cregan PB, The analysis of simple sequence repeat DNA in soybean by capillary gel electrophoresis. Appl. Theor. Electrophor,
1995, 5: 1-5.
10.Mccouch SR, Chen X, Panaud O, Temnykh S, Xu Y, Cho YG, Huang N, Ishii T, and Blair M, Microsatellite marker development, mapping and applications in rice genetics and breeding.
Plant. Mol. Biol. 1997, 35:89-99.
11.Richard C and Payne, Some new test and procedures for determining variety (Soybeans)
J. Seed Tech., 1997, 3: 61-77.
12.Roder MS, Korzun V, Wendehake K, Plaschke J, Tixier MH, Leroy P and Ganal MW, A microsatellite map of wheat, Genetics, 1998, 149: 2007-2023.
13.Saghai-Maroof MA, Soliman KM, Jorgensen RA and Allard RW, Ribosomal DNA spacer-length polymorphisms in barley; Mendelian inheritance, chromosomal location and population dynamics. Proc. Natl. Acad. Sci.,
U.S.A., 1984, 81: 8014-8018.
14.Scotti I, Magni F, Fink R, Powell W, Binelli G and Hedley PE, Microsatellite repeats are not randomly distributed within Norway spruce (Picea abies K.) expressed sequences.
Genome, 2000, 43: 41-6.
15.Tautz D, Hypervariability of simple sequences of general source for polymorphic DNA markers. Nucleic Acids Res. 1989, 17; 6463-6471.
16.Weising K, Atkinson RG and Gardner RC, Genmic fingerprinting by microsatellite-primed PCR: a critical evaluation. PCR Methods Appl. 1995, 4: 249-255.
17.Winter P, Pfaff T, Udupa SM, Huttel B, Sharma, PC, Sahi S, Arreguin-Espinoza R, Weigand F, Muehlbauer FJ and Kahl G, Characterization and mapping of sequence-tagged microsatelite sites in the chickpea (Cicer arietinum L.) genome. Mol. Gen. Genet. 1999, 262: 90-101.
18.Williams JG, Kubelik AR, Livak KJ, Rafalsk JA and Tingey SV, DNA polymorphisms amplified by arbitrary primers are useful as genetic markers. Nucleic Acids Research, 1990, 18, 6531-6535.