Enhance the data alignment results using multiple annotators
B.PrasadPG Scholar,CSE,B.V.C Engineering college,Odalarevu,E.G.Dt,AP,India
Abstract-The Internet presents a huge amount of useful information which is usually formatted for its users.The information which is extracted from different databases it is also called as Web database.In online shopping our required information is not present in a single position.we need deep web data collection.In this project, we present an automatic annotation approach that all records align into a table.And similar concepts of information form as a group it is called as aggregation.For each and every group of similar contents we assign the labels from multiple number of structures then we create final annotation.After extract the records directly we align into a annotation.No need to perform first two steps.All the user can easily understand the meaningful results.
Keywords: Data alignment, data annotation, web database, wrapper generation.
Introduction
Web Database contain different number of databases.It is difficult to extract the relevant data from web database.We need deep web data collection. We present automatic annotation approach.Whatever we get the outputs of existing system we take it as a input.In this approach we perform three steps.first align the records into table.And then group the similar contents of information it is also called as aggregation.In online comparision shopping the required information is not present in a single position.For example enter any one of the product name same product name is present in many number of web databases.There is no similar template HTML tags alignment.Price information not presented in a single position.For the information we can search different records.Manual we can findout where its located.One user spend more time to take the decision for purchasing product then less customers are get the services.So business growth is low.
Fig. 1. Illustration of our three-phase annotation solution.
2 Fundamentals
2.1 Data Unit and Text Node
Each SRR extracted by ViNTs has a tag structure that determines how the contents of the SRRs are displayed on a web browser. Each node in such a tag structure is either a tag nodeor atext node. A tag node corresponds to an HTML tagsurrounded by “<” and “>” in HTML source, while a text node is the text outside the “<” and “>.” Text nodes are the visible elements on the webpage and data units are located in the text nodes. However, as we can see from Fig. 1, text nodes are not always identical to data units. Since our annotation is at the data unit level, we need to identify data units from text nodes.
Depending on how many data units a text node may contain, we identify the following four types of relationships between data unit (U) and text node (T):
. One-to-One Relationship(denoted as T¼U). In this type, each text node contains exactly one data unit,i.e., the text of this node contains the value of a single attribute. This is the most frequently seen case. For example, in Fig. 1, each text node surrounded by the pair of tags <A> and </A> is a value of theTitle attribute. We refer to such kind of text nodes as atomic text nodes. An atomic text node is equivalent to a data unit.
One-to-Many Relationship(denoted asTU). In this type, multiple data units are encoded in one text node. For example, in Fig. 1, part of the second line of each SRR (e.g.,
“Springer-erlag/1999/0387984135/0.06667”
in the first record) is a single text node. It consists of four semantic data units: Publisher,Publication Date, ISBN, and Relevance Score. Since the text of such kind of nodes can be considered as a composition of the texts of multiple data units, we call it acomposite text node. An important observation that can be made is: if the data units of attributes A1...Akin one SRR are encoded as a composite text node, it is usually true that the data units of the same attributes in other SRRs returned by the same WDB are also encoded as composite text nodes, and those embedded data units always appear in the same order.
Many-to-One Relationship. In this case, multiple text nodes together form a data unit.Fig. 3 shows an example of this case. The value of the Author attribute is contained in multiple text nodes with each embedded inside a separate pair of (<A>,</A>) HTML tags.
2.2 Data Unit and Text Node Features
We identify and use five common features shared by the data units belonging to the same concept across all SRRs,and all of them can be automatically obtained. It is not difficult to see that all these features are applicable to text nodes, including composite text nodes involving the same set of concepts, and template text nodes.
2.2.1 Data Content (DC)
The data units or text nodes with the same concept often share certain keywords. This is true for two reasons. First, the data units corresponding to the search field where the user enters a search condition usually contain the search keywords. For example, in
Fig. 1, the sample result page is returned for the
search on the title field with keyword “machine.” We
can see that all the titles have this keyword.Second, web designers sometimes put some leading label infront of certain data unit within the same text node to make it easier for users to understand the data. 2.2.2 Presentation Style (PS)
This feature describes how a data unit is displayed on a webpage. It consists of six style features:font face, font size,font color, font weight, text decoration (underline, strike, etc.),and whether it isitalic. Data units of the same concept in different SRRs are usually displayed in the same style. For example, in Fig. 1, all the availability information is displayed in the exactly same presentation style.
2.2.3 Data Type (DT)
Each data unit has its own semantic type although it is just a text string in the HTML code. The following basic data types are currently considered in our approach: Date, Time,Currency, Integer, Decimal, Percentage, Symbol,and String.String type is further defined inAll-Capitalized-String,FirstLetter-Capitalized-String, andOrdinary String. The data type of a composite text node is the concatenation of the data types of all its data units. For example, the data type of the text
node“Premier Press/2002/1931841616/0.06667” in
Fig. 1 is <First-Letter-Capitalized-String> <Symbol> <Integer><Symbol> <Integer> <Symbol> <Decimal>. Consecutive terms with the same data type are treated as a single term and only one of them will be kept. Each type except Ordinary String has certain pattern(s) so that it can be easily identified. 2.2.4 Tag Path (TP)
A tag path of a text node is a sequence of tags traversing from the root of the SRR to the corresponding node in the tag tree.Since we use ViNTs for SRR extraction, we adopt the same tag path expression as in [34]. Each node in the expression contains two parts, one is thetag name, and the other is the direction indicating whether the
next node is the next sibling(denoted as “S”) or the first child (denoted as “C”). Text node is simply represented as <#TEXT>.
2.2.5 Adjacency (AD)
3 DATAALIGNMENT 3.1 Data Unit Similarity
The purpose of data alignment is to put the data units of the same concept into one group so that they can be annotated holistically. Whether two data units belong to the same concept is determined by how similar they are based on the features described in Section 2.2. In this paper, the similarity between two data units (or two text nodes)d1 andd2 is a weighted sum of the similarities of the five features between them, i.e.:
Data content similarity (SimC). It is the Cosine similarity[27] between the term frequency vectors of d1 andd2:
Presentation style similarity (SimP). It is the average of the style feature scores (FS) over all six presentation style features (F) between d1 andd2:
Data type similarity (SimD).It is determined by the common sequence of the component data types between two data units. The longest common sequence (LCS) cannot be longer than the number of component data types in these two data units.Thus, lett1andt2be the sequences of the data types of d1 andd2, respectively, and TLen(t) represent the number of component types of data typet, the data type similarity between data unitsd1andd2 is
Tag path similarity (SimT).This is the edit distance (EDT) between the tag paths of two data units. The edit distance here refers to the number of insertions and deletions of tags needed to transform one tag path into the other. It can be seen that the maximum number of possible operations needed is the total number of tags in the two tag paths. Letp1andp2be the tag paths ofd1 andd2, respectively, and PLen(p) denote the number of tags in tag pathp, the tag path similarity betweend1 andd2 is
Adjacency similarity (SimA). The adjacency similarity between two data unitsd1andd2is the
average of the similarity between dp1 and dp2and the similarity between ds1 and ds2, that is
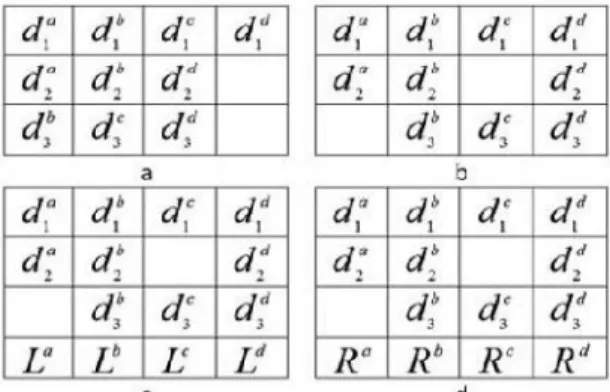
4. Alignment Algorithm
Our data alignment algorithm is based on the assumption that attributes appear in the same order across all SRRs on the same result page, although the SRRs may contain different sets of attributes (due to missing values). This is true in general because the SRRs from the same WDB are normally generated by the same template program. Thus, we can conceptually consider the SRRs on a result page in a table format where each row represents one SRR and each cell holds a data unit (or empty if the data unit is not available).Each table column, in our work, is referred to as analignment group, containing at most one data unit from each SRR. If analignment group contains all the data units of one concept and no data unit from other concepts, we call this group wellaligned. The goal of alignment is to move the data units in the table so that every alignment group is well aligned, while the order of the data units within every SRR is preserved.
Our data alignment method consists of the following four steps. The detail of each step will be provided later.
Step 1: Merge text nodes. This step detects and removes decorative tags from each SRR to allow the text nodes corresponding to the same attribute (separated by decorative tags) to be merged into a single text node.
Step 2: Align text nodes. This step aligns text nodes into groups so that eventually each group contains the text nodes with the same concept (for atomic nodes) or the same set of concepts (for composite nodes). Step 3: Split (composite) text nodes. This step aims to split the “values” in composite text nodes into
individual data units. This step is carried out based on the text nodes in thesame group holistically. A group
whose “values” need to besplit is called acomposite group .
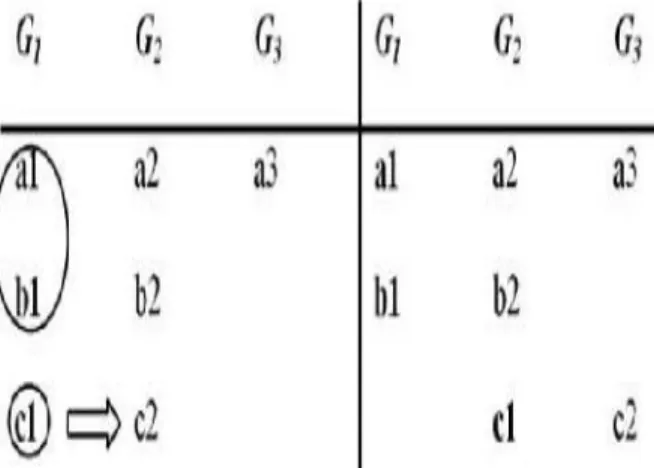
In Step 2, as shown in ALIGN in Fig. 4, text nodes are initially aligned into alignment groups based on their
Fig. 5. An example illustrating Step 2 of the alignment algorithm
5 Assigninglabels
5.1 Local versus Integrated Interface Schemas For a WDB, its search interface often contains some attributes of the underlying data. We denote a LIS asSi ¼fA1;A2;...;Akg, where each Aj is an attribute. When a query is submitted against the search interface, the entities in the returned results also have a certain hidden schema, denoted as Se ¼fa1;a2;...;ang, where each aj (j¼1...n)isan attribute to be discovered. The schema of the retrieved data and the LIS usually share a significant number of attributes[5]. This observation provides the basis for some of our basic annotators (see Section 5.2).
5.2 Basic Annotators
In a returned result page containing multiple SRRs, the data units corresponding to the same concept (attribute) often share special common features. And such common features are usually associated with the data units on the result page in certain patterns. Based on this observation, we define six basic annotators to label data units, with each of them considering a special type of patterns/features. Four of these annotators (i.e., table annotator, query-based annotator, intext prefix/suffix annotator, and common knowledge annotator) are similar to the annotation heuristics used by DeLa [3] but we have different implementations for three of them (i.e., table annotator, query-based annotator, and common knowledge annotator).
Fig. 6. SRRs in table format. 5.2.1 Table Annotator (TA)
Many WDBs use a table to organize the returned SRRs. In the table, each row represents an SRR. The table header, which indicates the meaning of each column, is usually located at the top of the table. Fig. 6 shows an example of SRRspresented in a table format. Usually, the data units of the same concepts are well aligned with its corresponding column header. This special feature of the table layout can be utilized to annotate the SRRs.
5.2.2 Query-Based Annotator (QA)
The basic idea of this annotator is that the returned SRRs from a WDB are always related to the specified query. Specifically,the query terms entered in the search attributes on the local search interface of the WDB will most likely appear in some retrieved SRRs. For example, in Fig. 1, query term
“machine”is submitted through theTitlefield on the search interface of the WDB and all three titles of the returned SRRs contain this query term. Thus, we can use the name of search fieldTitleto annotate the title values of these SRRs. In general, query terms against an attribute may be entered to a textbox or chosen from a selection list on the local search interface. 5.2.3 Schema Value Annotator (SA)
Many attributes on a search interface have predefined values on the interface. For example, the attribute Publishersmay have a set of predefined values (i.e., publishers) in its selection list. More attributes in the IIS tend to have predefined values and these attributes are likely to have more such values than those in LISs, because when attributes from multiple interfaces are integrated, their values are also combined [4]. Our schema value annotator utilizes the combined value set to perform annotation. 6 Annotationwrapper
annotation wrapper is a description of the annotation rules for all the attributes on the result page. After the data unit groups are annotated, they are organized based on the order of its data units in the original SRRs.
7 Experiments
7.1 Data Sets and Performance
Our experiments are based on 112 WDBs
selected from seven
domains:book,movie,music,game,job,electronics, andauto. For each WDB, its LIS is constructed automatically using WISEi Extractor [15]. For each domain, WISE-Integrator [14] isused to build the IIS automatically. These collected WDBs are randomly divided into two disjoint groups. The first group contains 22 WDBs and is used for training, and the second group has 90 WDBs and is used for testing. Data setDS1is formed by obtaining one sample result page from each training site. Two testing data sets DS2and DS3are generated by collecting two sample result pages from each testing site using different queries. For annotation, the precision is the percentage of the correctly annotated units over all the data units annotated by the system and the recall is the percentage of the data units correctly annotated by the system over all the manually annotated units. A data unit is said to be correctly annotated if its system-assigned label has the same meaning as its manually assigned label.
7.2 Experimental Results
The optimal feature weights obtained through our genetic training method (See Section 4) over DS1 are {0.64, 0.81, 1.0,0.48, 0.56}forSimC, SimP, SimD, SimT,andSimA, respectively, and 0.59 for clustering threshold T.The average alignment precision and recall are converged at about 97 percent. The learning result shows that the data type and the presentation
style are the most important features in our alignment method. Then, we apply our annotation method on DS1 to determine the
success rate of each annotator
8 Conclusion
In this project, we studied the inconsistent label problem and data alignment problem.By using annotation technique we can rectify these problems.And also we get best search results from the web data base.Our experimental results show that the precision and recall of this method are both above 98 percent.
Acknowledgments
This work is supported in part by the following US National Science Foundation (NSF) grants: IIS-0414981, IIS-0414939, 0454298, and CNS-0958501. The authors would also like to express their gratitude to the anonymous reviewers for providing very constructive suggestions to improve the manuscript.
References
[1] A. Arasu and H. Garcia-Molina, “Extracting Structured Data from Web Pages,”Proc. SIGMOD Int’l Conf. Management of Data,2003.
[2] L. Arlotta, V. Crescenzi, G. Mecca, and P.
from Large Web Sites,”Proc. Sixth Int’l Workshop
the Web and Databases (WebDB),2003.
[3] P. Chan and S. Stolfo, “Experiments on
Multistrategy Learning by Meta-Learning,”Proc. Second Int’l Conf. Information and Knowledge Management (CIKM),1993.
[4] W. Bruce Croft, “Combining Approaches for
Information Retrieval,”Advances in Information
Retrieval: Recent Research from the Center for Intelligent Information Retrieval,Kluwer Academic, 2000.
[5] V. Crescenzi, G. Mecca, and P. Merialdo,
“RoadRUNNER: Towards Automatic Data Extraction from Large Web Sites,”Proc. Very Large Data Bases (VLDB) Conf.,2001.
[6] S. Dill et al., “SemTag and Seeker: Bootstrapping
the Semantic Web via Automated Semantic Annotation,”Proc. 12th Int’l Conf.World Wide Web (WWW) Conf.,2003.
[7] H. Elmeleegy, J. Madhavan, and A. Halevy,
“Harvesting Relational Tables from Lists on the
Web,” Proc. Very Large Databases (VLDB) Conf.,2009.
[8] D. Embley, D. Campbell, Y. Jiang, S. Liddle, D. Lonsdale, Y. Ng,
and R. Smith, “Conceptual-Model-Based Data Extraction from Multiple-Record Web Pages,”Data
and Knowledge Eng.,vol. 31,no. 3, pp. 227-251, 1999.
[9] D. Freitag, “Multistrategy Learning for
Information Extraction,”Proc. 15th Int’l Conf.
Machine Learning (ICML),1998.
[10] D. Goldberg,Genetic Algorithms in Search, Optimization and Machine
Learning.Addison Wesley, 198.
[11] S. Handschuh, S. Staab, and R. Volz, “On Deep Annotation,”Proc.12th Int’l Conf. World Wide Web
(WWW),2003.
[12] S. Handschuh and S. Staab, “Authoring and Annotation of Web Pages in CREAM,”Proc. 11th
Int’l Conf. World Wide Web (WWW),2003.
[13] B. He and K. Chang, “Statistical Schema
Matching Across Web Query Interfaces,”Proc.
SIGMODInt’l Conf. Management of Data,2003.
[14] H. He, W. Meng, C. Yu, and Z. Wu, “Automatic
Integration of Web Search Interfaces with no. 3, pp. 256-273, Sept. 2004.
[15] H. He, W. Meng, C. Yu, and Z. Wu,
“Constructing Interface Schemas for Search Interfaces of Web Databases,” Proc. Web
Information Systems Eng. (WISE) Conf.,2005.
[16] J. Heflin and J. Hendler, “Searching the Web