DOI:10.1051/0004-6361/201322795
c
ESO 2014
Astrophysics
&
The magnetic field at milliarcsecond resolution
around IRAS 20126+4104
G. Surcis
1, W. H. T. Vlemmings
2, H. J. van Langevelde
1,3, L. Moscadelli
4, and B. Hutawarakorn Kramer
5,61 Joint Institute for VLBI in Europe, Postbus 2, 79990 AA Dwingeloo, The Netherlands 2 Chalmers University of Technology, Onsala Space Observatory, 439 92 Onsala, Sweden 3 Sterrewacht Leiden, Leiden University, Postbus 9513, 2300 RA Leiden, The Netherlands 4 INAF – Osservatorio Astrofisico di Arcetri, Largo E. Fermi 5, 50125 Firenze, Italy 5 Max-Planck Institut für Radioastronomie, Auf dem Hügel 69, 53121 Bonn, Germany
6 National Astronomical Research Institute of Thailand, Ministry of Science and Technology, Rama VI Rd., 10400 Bangkok, Thailand
Received 4 October 2013/Accepted 20 January 2014
ABSTRACT
Context.IRAS 20126+4104 is a well studied B0.5 protostar that is surrounded by a∼1000 au Keplerian disk and is where a large-scale outflow originates. Both 6.7-GHz CH3OH masers and 22-GHz H2O masers have been detected toward this young stellar object.
The CH3OH masers trace the Keplerian disk, while the H2O masers are associated with the surface of the conical jet. Recently,
obser-vations of dust polarized emission (350μm) at an angular resolution of 9 arcsec (∼15 000 au) have revealed anS-shaped morphology of the magnetic field around IRAS 20126+4104.
Aims.The observations of polarized maser emissions at milliarcsecond resolution (∼20 au) can make a crucial contribution to under-standing the orientation of the magnetic field close to IRAS 20126+4104. This will allow us to determine whether the magnetic field morphology changes from arcsecond resolution to milliarcsecond resolution.
Methods. The European VLBI Network was used to measure the linear polarization and the Zeeman splitting of the 6.7-GHz
CH3OH masers toward IRAS 20126+4104. The NRAO Very Long Baseline Array was used to measure the linear polarization and
the Zeeman splitting of the 22-GHz H2O masers toward the same region.
Results.We detected 26 CH3OH masers and 5 H2O masers at high angular resolution. Linear polarization emission was
ob-served toward three CH3OH masers and toward one H2O maser. Significant Zeeman splitting was measured in one CH3OH maser
(ΔVZ = −9.2±1.4 m s−1). No significant (5σ) magnetic field strength was measured using the H2O masers. We found that in
IRAS 20126+4104 the rotational energy is less than the magnetic energy.
Key words.stars: formation – masers – polarization – magnetic fields – ISM: individual objects: IRAS 20126+4104
1. Introduction
In the past years, the formation of high-mass stars has been at the center of numerous studies, both observational and theoretical. The observations reveal that the structure of massive protostars is probably similar to that of their less massive counterpart (e.g., Tang et al.2009; Keto & Zhang2010; Johnston et al.2013), and the theoretical simulations match the observations as long as the magnetic field is taken into consideration (e.g., Peters et al.2011; Seifried et al.2012a; Myers et al.2013).
One of the typical characteristics of low-mass protostars that has also been observed around high-mass protostars (B-type stars) is the presence of circumstellar disks (e.g., Cesaroni et al. 2006, 2007). Seifried et al. (2011) show that Keplerian disks with sizes of a few 100 au are easily formed around massive protostars when a weak magnetic field is considered in the simu-lations. The Keplerian disks are also formed if a strong magnetic field is present but only if a turbulent velocity field is introduced (Seifried et al.2012b).
Determining the morphology of magnetic fields close to cir-cumstellar disks or tori in the early stages of massive star for-mation is very difficult mainly because the massive protostars are distant, rare, and quick to evolve. However, it was possi-ble in some cases, for instance in Cepheus A (Vlemmings et al. 2010) and in NGC 7538 (Surcis et al.2011a), where the 6.7-GHz CH3OH maser emission was used to probe the magnetic field at
milliarcsecond (mas) resolution (i.e.,∼10 au). In both cases, the masers trace the infalling gas but not the disk/torus material di-rectly. A suitable case where the magnetic field can be measured on the surface of a disk may instead be IRAS 20126+4104.
IRAS 20126+4104 is a well studied B0.5 protostar (M = 7M) at a distance of 1.64 ± 0.05 kpc (Moscadelli et al.2011, hereafter MCR11). A disk of∼1000 au (PAdisk = 53◦ ± 7◦, Cesaroni et al.2005), which is undergoing Keplerian rotation, was imaged by Cesaroni et al. (1997, 1999, 2005). In addi-tion, a jet/outflow perpendicular to the disk (PAjet = 115◦, MCR11), which shows a precession motion around the rotation axis of the disk (e.g., Shepherd et al.2000), was also detected from small- (∼102 au) to large-scale (∼104 au) (e.g., Cesaroni et al. 1997,1999, 2013; Hofner et al. 2007; Caratti o Garatti 2008; MCR11). The three maser species 6.7-GHz CH3OH, 1.6-GHz OH, and 22-GHz H2O were detected (Edris et a.2005; Moscadelli et al. 2005; MCR11). The former can be divided into two groups, i.e. Groups 1 and 2. While Group 1 is as-sociated to the Keplerian disk, Group 2 shows relative proper motions, indicating that the masers are moving perpendicularly away from the disk (MCR11). The OH masers have an elon-gated distribution and trace part of the Keplerian disk (Edris et al.2005). Edris et al. (2005) also identified one Zeeman pair of OH masers that indicates a magnetic field strength of∼+11 mG. The H2O masers are instead associated with the surface of the
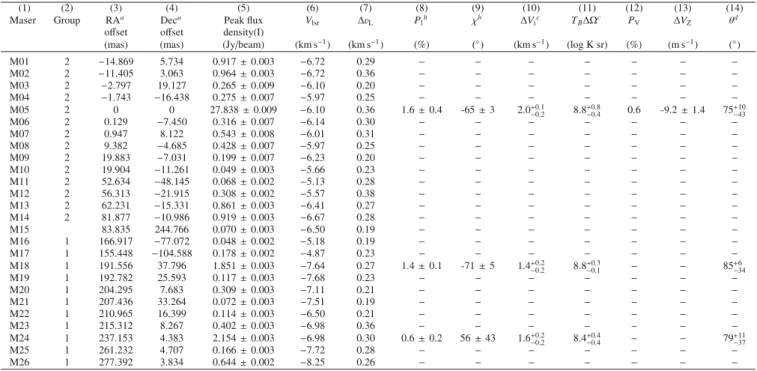
Table 1.Parameters of the 6.7-GHz CH3OH maser features detected in IRAS 20126+4104.
(1) (2) (3) (4) (5) (6) (7) (8) (9) (10) (11) (12) (13) (14)
Maser Group RAa Deca Peak flux V
lsr ΔvL Plb χb ΔVic TBΔΩc PV ΔVZ θd offset offset density(I)
(mas) (mas) (Jy/beam) (km s−1) (km s−1) (%) (◦) (km s−1) (log K sr) (%) (m s−1) (◦)
M01 2 −14.869 5.734 0.917±0.003 −6.72 0.29 − − − − − − −
M02 2 −11.405 3.063 0.964±0.003 −6.72 0.36 − − − − − − −
M03 2 −2.797 19.127 0.265±0.009 −6.10 0.20 − − − − − − −
M04 2 −1.743 −16.438 0.275±0.007 −5.97 0.25 − − − − − − −
M05 2 0 0 27.838±0.009 −6.10 0.36 1.6±0.4 -65±3 2.0+0.1
−0.2 8.8+−00..84 0.6 -9.2±1.4 75+−1043
M06 2 0.129 −7.450 0.316±0.007 −6.14 0.30 − − − − − − −
M07 2 0.947 8.122 0.543±0.008 −6.01 0.31 − − − − − − −
M08 2 9.382 −4.685 0.428±0.007 −5.97 0.25 − − − − − − −
M09 2 19.883 −7.031 0.199±0.007 −6.23 0.20 − − − − − − −
M10 2 19.904 −11.261 0.049±0.003 −5.66 0.23 − − − − − − −
M11 2 52.634 −48.145 0.068±0.002 −5.13 0.28 − − − − − − −
M12 2 56.313 −21.915 0.308±0.002 −5.57 0.38 − − − − − − −
M13 2 62.231 −15.331 0.861±0.003 −6.41 0.27 − − − − − − −
M14 2 81.877 −10.986 0.919±0.003 −6.67 0.28 − − − − − − −
M15 83.835 244.766 0.070±0.003 −6.50 0.19 − − − − − − −
M16 1 166.917 −77.072 0.048±0.002 −5.18 0.19 − − − − − − −
M17 1 155.448 −104.588 0.178±0.002 −4.87 0.23 − − − − − − −
M18 1 191.556 37.796 1.851±0.003 −7.64 0.27 1.4±0.1 -71±5 1.4+0.2
−0.2 8.8−+00..31 − − 85+−634
M19 1 192.782 25.593 0.117±0.003 −7.68 0.23 − − − − − − −
M20 1 204.295 7.683 0.309±0.003 −7.11 0.21 − − − − − − −
M21 1 207.436 33.264 0.072±0.003 −7.51 0.19 − − − − − − −
M22 1 210.965 16.399 0.114±0.003 −6.50 0.21 − − − − − − −
M23 1 215.312 8.267 0.402±0.003 −6.98 0.36 − − − − − − −
M24 1 237.153 4.383 2.154±0.003 −6.98 0.30 0.6±0.2 56±43 1.6+0.2
−0.2 8.4−+00..44 − − 79+−1137
M25 1 261.232 4.707 0.166±0.003 −7.72 0.28 − − − − − − −
M26 1 277.392 3.834 0.644±0.002 −8.25 0.26 − − − − − − −
Notes.(a)The reference position isα
2000=20h14m26s.046±0s.001 andδ2000=41◦1332.690±0.009 (see Sect.4).(b)Plandχare the mean values
of the linear polarization fraction and the linear polarization angle measured across the spectrum, respectively.(c)The best-fitting results obtained
by using a model based on the radiative transfer theory of methanol masers forΓ + Γν=1 s−1(Vlemmings et al.2010; Surcis et al.2011a). The
errors were determined by analyzing the full probability distribution function.(d)The angle between the magnetic field and the maser propagation
direction is determined by using the observedPland the fitted emerging brightness temperature. The errors were determined by analyzing the full
probability distribution function.
conical jet (opening angle=9◦), with speed increasing for in-creasing distance from the protostar (Moscadelli et al. 2005; MCR11).
Shinnaga et al. (2012) measured the polarized dust emis-sion at 350 μm at arcsec resolution (∼104 au) by using the SHARC II Polarimeter (SHARP) with the 10.4 m Leighton tele-scope at the Caltech Submillimeter Observatory (CSO). They determined that the global magnetic field is oriented north-south, but it changes its direction close to the protostar becoming paral-lel to the Keplerian disk; i.e., here the field is nearly perpendic-ular to the rotation axis of the disk. The apparent jet precession could be explained by the misalignment of the magnetic field and the rotation axis (Shinnaga et al.2012).
The observations of polarized emissions of 6.7-GHz CH3OH and 22-GHz H2O masers offer a possibility to bet-ter debet-termine the morphology of the magnetic field close to the circumstellar disk and to the jet. For this reason, here we present both European VLBI Network (EVN) observations of CH3OH masers and Very Long Baseline Array (VLBA) obser-vations of H2O masers that were carried on in full polarization mode.
2. Observations
2.1. 6.7-GHz EVN data
IRAS 20126+4104 was observed at 6.7-GHz in full polariza-tion spectral mode with seven of the EVN1antennas (Effelsberg,
1 The European VLBI Network is a joint facility of European, Chinese,
South African, and other radio astronomy institutes funded by their na-tional research councils.
Jodrell, Onsala, Medicina, Torun, Westerbork, and Yebes-40 m), for a total observation time of 5.5 h, on October 30, 2011 (pro-gram code ES066). The bandwidth was 2 MHz, providing a ve-locity range of∼100 km s−1. The data were correlated with the EVN software correlator (SFXC) at the Joint Institute for VLBI in Europe (JIVE) using 2048 channels and generating all four polarization combinations (RR, LL, RL, LR) with a spectral res-olution of∼1 kHz (∼0.05 km s−1).
The data were edited and calibrated using the Astronomical Image Processing System (AIPS). The bandpass, delay, phase, and polarization calibration were performed on the calibra-tor J2202+4216. Fringe-fitting and self-calibration were per-formed on the brightest maser feature (M05 in Table1). Then the I,Q,U, andVcubes were imaged (rms=2.4 mJy beam−1) using the AIPS task IMAGR. The beam size was 7.47 mas×3.38 mas (PA=76◦). TheQandUcubes were combined to produce cubes of polarized intensity (POLI= Q2+U2) and polarization an-gle (χ = 1/2× atan(U/Q)). We calibrated the linear polariza-tion angles by comparing the linear polarizapolariza-tion angle of the polarization calibrator measured by us with the angle obtained by calibrating the POLCAL observations made by NRAO2.
IRAS 20126+4104 was observed between two POLCAL ob-servations runs during which the linear polarization angle of J2202+4216 was constant, with an average value of−31◦ ± 1◦. We were therefore able to estimate the polarization angle with a systemic error of no more than∼1◦. The formal errors onχare due to thermal noise. This error is given byσχ = 0.5σP/P×
180◦/π(Wardle & Kronberg1974), wherePandσP are the
po-larization intensity and corresponding rms error, respectively. 2
Table 2.Parameters of the 22-GHz H2O maser features detected in IRAS 20126+4104.
(1) (2) (3) (4) (5) (6) (7) (8) (9) (10) (11) (12) (13)
Maser RAa Deca Peak flux V
lsr ΔvL Plb χb ΔVic TBΔΩc PV ΔVZ θd
offset offset density(I)
(mas) (mas) (Jy/beam) (km s−1) (km s−1) (%) (◦) (km s−1) (log K sr) (%) (m/s) (◦)
W01 −0.818 −0.656 0.37±0.05 −2.05 0.74 − − − − − − −
W02 0 0 24.77 ±0.06 −4.61 1.37 1.3±0.2 −37 ±13 <0.5 9.1+0.3
−0.4 − − 90+
9 −9
W03 403.317 −212.020 0.19±0.04 −5.61 0.73 − − − − − − −
W04 403.898 −212.452 0.39±0.05 −6.23 0.55 − − − − − − −
W05 542.648 −201.458 0.23±0.05 −15.51 0.39 − − − − − − −
Notes.(a)The reference position isα
2000 =20h14m25s.966 ±0s.002 andδ2000=41◦1332.738 ±0.014 (see Sect.4).(b)Plandχare the mean
values of the linear polarization fraction and the linear polarization angle measured across the spectrum, respectively.(c)The best-fitting results
obtained by using a model based on the radiative transfer theory of H2O masers forΓ+Γν=1 s−1(Surcis et al.2011b). The errors were determined
by analyzing the full probability distribution function.(d)The angle between the magnetic field and the maser propagation direction is determined
by using the observedPland the fitted emerging brightness temperature. The errors were determined by analyzing the full probability distribution
function.
2.2. 22-GHz VLBA data
The star-forming region was also observed in the 616−523 tran-sition of H2O (rest frequency:22.23508 GHz) with the NRAO3 VLBA on June 24, 2012. The observations were made in full po-larization mode using a bandwidth of 4 MHz to cover a velocity range of∼54 km s−1. The data were correlated with the DiFX correlator using 2000 channels and generating all four polariza-tion combinapolariza-tions (RR, LL, RL, LR) with a spectral resolupolariza-tion of 2 kHz (∼0.03 km s−1). Including the overheads, the total ob-servation time was 8 h.
The data were edited and calibrated using AIPS follow-ing the method of Kemball et al. (1995). The bandpass, the delay, the phase, and the polarization calibration were per-formed on the calibrator J2202+4216. The fringe-fitting and the self-calibration were performed on the brightest maser feature (W02 in Table2). Then we imaged the I,Q,U, and V cubes (rms = 20 mJy beam−1) using the AIPS task IMAGR (beam size 0.75 mas×0.34 mas, PA = −9.4◦). The QandU cubes were combined to produce cubes of POLI and χ. Because IRAS 20126+4104 was observed ten days before a POLCAL observations run, we calibrated the linear polarization angles of the H2O masers by comparing the linear polarization angle of J2202+4216 measured by us with the angles measured during that POLCAL observations run (χJ2202+4216 = −15◦.0 ± 0◦.3). Also in the case of the H2O masers, theσχ is due to thermal noise.
3. Analysis
The CH3OH and H2O maser features were identified by using the process described in Surcis et al. (2011b). We determined the mean linear polarization fraction (Pl) and the mean linear polarization angle (χ) of each CH3OH and H2O maser feature by only considering the consecutive channels (more than two) across the total intensity spectrum for whichPOLI≥5σ.
We fitted the total intensity and the linearly polarized spec-tra of H2O and CH3OH maser features, for which we were able to detect linearly polarized emission, by using the full ra-diative transfer method (FRTM) code for 22-GHz H2O masers 3 The National Radio Astronomy Observatory (NRAO) is a facility of
the National Science Foundation operated under cooperative agreement by Associated Universities, Inc.
(Vlemmings et al.2006; Surcis et al.2011b) and the adapted ver-sion of the code for 6.7-GHz CH3OH masers (Vlemmings et al. 2010; Surcis et al.2011a). The code is based on the models of Nedoluha & Watson (1992), who solved the transfer equations for the polarized radiation of 22-GHz H2O masers in the pres-ence of a magnetic field causing a Zeeman splitting (ΔVZ) that is much smaller than the spectral line breadth.
We modeled the observed spectra by gridding the intrinsic thermal linewidth (ΔVi) in the case of H2O masers from 0.5 to 3.5 km s−1 in steps of 0.025 km s−1, and in the case of the CH3OH masers from 0.5 to 2.4 km s−1in steps of 0.05 km s−1, by using a least-square fitting routine. The output of the codes pro-vides estimates of the emerging brightness temperature (TBΔΩ)
and ofΔVi. From the fit results, we were able to determine the best estimates of the angle between the maser propagation direc-tion and the magnetic field (θ), because both shape and strength of the linear polarization spectrum depend (nonlinearly) on the maser saturation level andθ. Ifθ > θcrit = 55◦, whereθcrit is the Van Vleck angle, the magnetic field appears to be perpen-dicular to the linear polarization vectors; otherwise, it is parallel (Goldreich et al.1973). To better determine the orientation of the magnetic field with respect to the linear polarization vectors, Surcis et al. (2013) introduced a method that takes the errors as-sociated toθinto consideration (i.e.,θεε+− in Tables2and1). We state that if|θ+−55◦| > |θ−−55◦|, where θ± = θ ± ε±, the magnetic field is most likely perpendicular to the linear polar-ization vectors; otherwise, the magnetic field is assumed to be parallel. Of course, ifθ−andθ+are both larger or smaller than 55◦the magnetic field is perpendicular or parallel to the linear polarization vectors, respectively.
Moreover, the best estimates forTBΔΩandΔViare included
in the corresponding code to produce theI andV models that were used for fitting the total intensity and circular polarized spectra of the corresponding maser feature.
4. Results
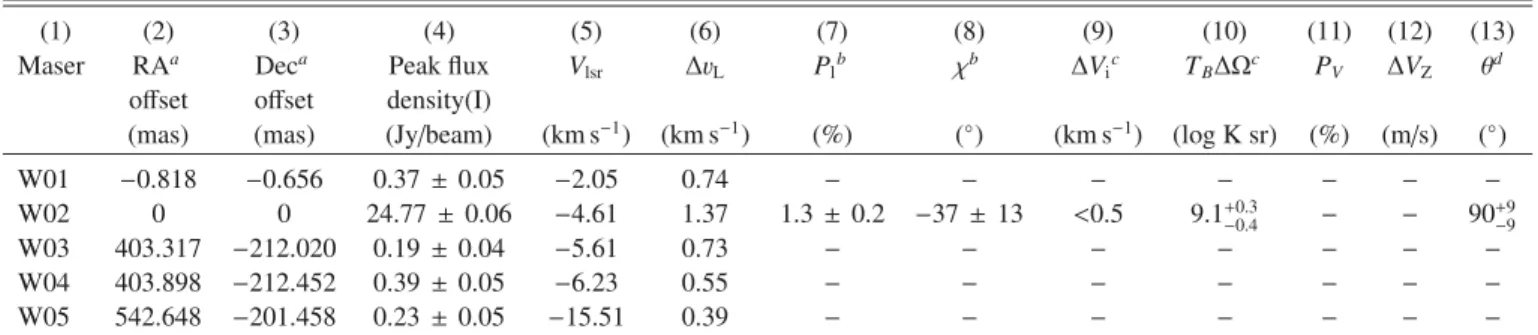
Fig. 1. Left panel: a view of the 6.7-GHz CH3OH maser features detected around IRAS 20126+4104, the reference position is α2000 =
20h14m26s.046 andδ
2000=41◦1332.690 (see Sect.4).Right panel: a view of the 22-GHz H2O maser features detected around IRAS 20126+4104,
the reference position isα2000=20h14m25s.966 andδ2000=41◦1332.738 (see Sect.4). The triangles and the octagonal symbols are the identified
CH3OH and H2O maser features, respectively, scaled logarithmically according to their peak flux density (Tables1and2). The maser LSR radial
velocity is indicated by color. (The systemic velocity of IRAS 20126+4104 isVlsr =−3.5 km s−1, MCR11.) A 3 Jy beam−1 symbol is plotted
for illustration in both panels. The linear polarization vectors, scaled logarithmically according to polarization fractionPl, are overplotted. In
the right bottom corner of both panels, the error-weighted orientation of the magnetic field (ΦB, see Sect.5.3) is also reported, the two dashed
segments indicate the uncertainties. The two arrows indicate the direction but not the absolute position of the red- and blue-shifted lobes of the jet (PAjet=115◦; MCR11). The dotted line is the best linear fit of the H2O maser features (PAH2O=114◦ ±4◦).
we were able to estimate the absolute position of the brightest features of both maser species (M05 and W02) through fringe rate mapping using the AIPS task FRMAP. The absolute po-sition errors areΔαM05 = 6 mas and ΔδM05 = 9 mas for the CH3OH maser feature, and ΔαW02 = 24 mas and ΔδW02 = 14 mas for the H2O maser feature. The position of the bright-est CH3OH maser feature M05, which is Feature 1 in MCR11, agrees within 2σ with the position of Feature 1 after consid-ering the change in position due to the proper motion of the CH3OH masers (−4 mas yr−1both in RA and in Dec, MCR11).
The description of the maser distribution and the polarization results are reported for each maser species separately below.
4.1. CH3OH masers
The CH3OH maser features can be divided into two groups, 1 and 2, following the naming convention of MCR11. An addi-tional maser feature M15, which is undetected by MCR11, is about 200 mas north from the other maser features and cannot be included in any of these two groups. The spatial distribution and the velocity ranges of the two groups are consistent with those of MCR11.
We detected linear polarization in three CH3OH maser fea-tures (Pl =0.6%−1.6%, see Fig.2), and the error-weighted lin-ear polarization angles isχ CH3OH =−70◦±16◦. The adapted version of the FRTM code was able to properly fit all these three CH3OH maser features, and the outputs with their relative er-rors are reported in Cols. 10, 11, and 14 of Table1. Moreover, these maser features appear to be unsaturated, because their TBΔΩare under the saturation threshold (TBΔΩ)CH3OH =2.6× 10⁹K sr of the 6.7-GHz CH
3OH masers (Surcis et al.2011a). Considering the determinedθangles, the magnetic field is per-pendicular to the linear polarization vectors, i.e.,|θ+−55◦| > |θ−−55◦|. Furthermore, we detected circularly polarized emis-sion (PV = 0.6%) toward the brightest CH3OH maser feature
M05, for which we measured quite a large Zeeman splitting ΔVZ =(−9.2±1.4) m s−1.
4.2. H2O masers
The H2O maser features are linearly distributed (PAH2O=114◦± 4◦) from northwest (NW) to southeast (SE), and their veloc-ities increase in magnitude from NW to SE. The velocity of W05, which is the most southeastern and the most blue-shifted H2O maser features, is an order of magnitude faster than the velocities of the other maser features. Although the PAH2O of the maser distribution agrees perfectly with the PA measured re-cently by MCR11, the maser features are not on the outflow as detected by MCR11 and the velocity distribution is reversed with respect to what MCR11 observed (see Fig.4).
We detected linearly polarized emission (Pl = 1.3%, see Fig. 2) only from the brightest H2O maser feature W02 (χ = −37◦ ±13◦). The FRTM code provides an upper limit ofΔVi(Col. 9 of Table2), while the value ofTBΔΩ(Col. 10)
is below the saturation threshold (TBΔΩ)H2O = 6.7×10⁹K sr also for the H2O maser, indicating an unsaturated maser (Surcis et al.2011a). The third output of the FRTM code, i.e.θ(Col. 13), indicates that the magnetic field is on the plane of the sky and perpendicular to the linear polarization vector. No circular po-larization at 5σ was detected toward any H2O maser feature (PW02V <0.4%).
5. Discussion
5.1. Zeeman splitting
The magnetic field strength along the line of sight can be calcu-lated from the Zeeman-splitting measurements by using
B||= ΔVZ
αZ
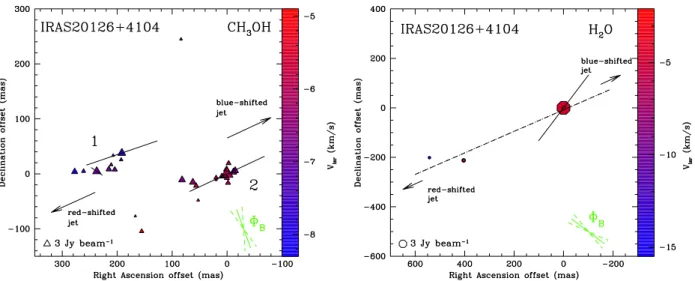
Fig. 2.Total intensity (I, black solid line) and linear polarization intensity (red solid line) spectra of the CH3OH maser features M05,
M18, and M24, and of the H2O maser feature
W02 (upper panel). The linear polarization in-tensity spectra have been multiplied by a fac-tor of five for the M05, M18, and M24, and by a factor of fifteen for W02. The spectra of po-larization fraction (black solid line, left scale) and polarization angle (dashed black line, right scale) are also shown (lower panel).
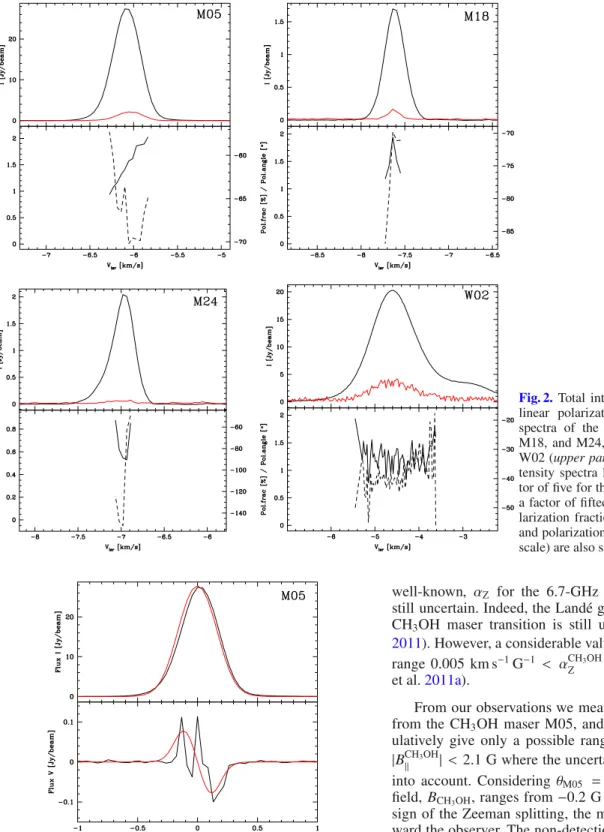
Fig. 3.Total intensity (I,upper panel) and circular polarization intensity (V,lower panel) spectra for the CH3OH maser feature M05. The thick
red line shows the best-fit models ofI andVemission obtained using the adapted FRTM code (see Sect.3). The maser features were centered on zero velocity.
where αZ is the Zeeman-splitting coefficient, which depends on the Landé g-factor of the corresponding maser transition. Moreover, the total magnetic field strength can be determined if the angle between the maser propagation direction and the magnetic field θ is known, i.e., B = B||/cos θ. While the Zeeman-splitting coefficient for the 22-GHz H2O maser is
well-known, αZ for the 6.7-GHz CH3OH maser emission is still uncertain. Indeed, the Landé g-factor corresponding to the CH3OH maser transition is still unknown (Vlemmings et al. 2011). However, a considerable value ofαCH3OHZ could be in the range 0.005 km s−1G−1 < αZCH3OH < 0.05 km s−1G−1 (Surcis et al.2011a).
From our observations we measured Zeeman splitting only from the CH3OH maser M05, and consequently we can spec-ulatively give only a possible range of B||, which is 0.2 G < |BCH3OH|| | <2.1 G where the uncertainty ofΔVZhas been taken into account. ConsideringθM05 = 75◦+10
◦
−43◦, the total magnetic field,BCH3OH, ranges from−0.2 G to −24 G. According to the sign of the Zeeman splitting, the magnetic field is pointing to-ward the observer. The non-detection of significant circular po-larized emission from the 22-GHz H2O maser could be due to a weaker magnetic field along the outflows.
5.2. Faraday rotation
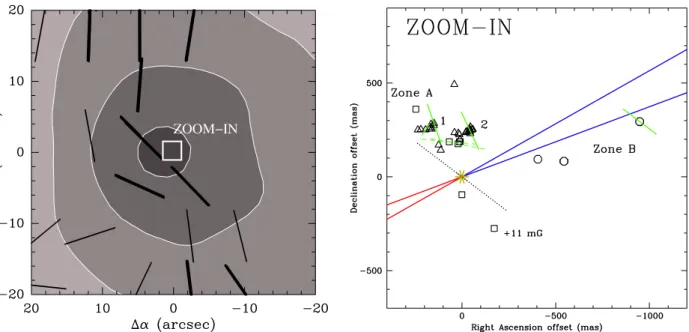
ZOOM−IN
Fig. 4.Left panel: modified version of Fig. 3(b) of Shinnaga et al. (2012). The white box indicates the position of theright panel. The black bars represent the magnetic field direction determined from the polarized dust emission at 350μm, whose continuum emission is in the background.
Right panel: CH3OH (triangles), OH (squares) (Edris et al.2005), and H2O (octagons) masers in IRAS 20126+4104. The gold asterisk represents
the B0.5 protostar (α2000=20h14m26s.0498 andδ2000=41◦1332.443, MCR11), while the dotted line represents the Keplerian disk of∼1000 au
(PAdisk =53◦±7◦, Cesaroni et al.2005). The red and blue lines indicate the red- and blue-shifted lobes of the jet, respectively, with a PAjet =
115◦ and an opening angle of 9◦ (MCR11). The thick green segments represent the magnetic field direction determined from the polarized CH3OH and H2O maser emissions. The green dashed segments represent the magnetic field direction determined from the linearly polarized
emission of OH masers (Edris et al.2005). The foreground Faraday rotation at 1.6-GHz is probably not negligible and needs to be taken into account when interpreting the image (see Sect.5.2).
Faraday rotation is given by
Φf[◦]=4.22 ×10⁶
D [kpc]
ne [cm−3]
B|| [mG]
ν
[GHz]
−2
,
(2) whereDis the length of the path over which the Faraday ro-tation occurs,ne and B|| are the average electron density and the magnetic field along this path, respectively, andνis the fre-quency. By assuming that the interstellar electron density, mag-netic field, and distance arene ≈0.012 cm−3, B|| ≈ 2μG (Sun et al.2008), andD=1.64 kpc, respectively,Φfis estimated to be 4◦.0 at 6.7-GHz and 0◦.3 at 22-GHz, but for 1.6-GHz OH masers Φf≈60◦.
Surcis et al. (2012,2013) found that the linear polarization vectors of 6.7-GHz CH3OH masers are quite accurately aligned in all the young stellar objects (YSOs) that they observed, indi-cating that the internal Faraday rotation (Φi) is negligible. In the case of 22-GHz H2O masers,Φiis found to be negligible only if the H2O masers are pumped by a C-shock (Kaufman & Neufeld 1996).
5.3. Morphology of the magnetic field
The two maser species that are associated with two diff er-ent structures of the YSO (i.e., the disk and the outflows, see Sect. 4) probe the morphology of the magnetic field in two different zones of the protostar. The magnetic field close to the disk (Zone A, at ∼400 au from the protostar), which is probed by the CH3OH masers, has an orientation on the plane of the sky of Φdisk
B = 20◦ ±16◦, while close to the jet
(Zone B, at∼1600 au from the protostar), which is probed by the H2O masers,ΦoutflowB = 53◦±13◦ (see Fig.4). A
compari-son of the morphology of the magnetic field with the structure
of the protostar reveals that the magnetic field is parallel to the disk (PAdisk =53◦±7◦; Cesaroni et al.2006) in Zone B, and it rotates clockwise by 33◦in Zone A, i.e., at∼400 au from the cen-tral protostar. Here the magnetic field is perpendicular to the jet (PAjet =115◦; MCR11). Moreover, the angle between the mag-netic field and the line of sight isθ CH3OH =82◦+8◦
−41◦ in Zone A andθ H2O = 90◦+9◦
−9◦ in Zone B; i.e., the magnetic field is on the plane of the sky. Even if the magnetic field is not parallel to the jet,θ CH3OHis consistent with the inclination of the jet with respect to the line of sight, which isϕ=80◦(MCR11). In ad-dition, becauseΔVZ is negative, the magnetic field in Zone A is pointing towards the observer (e.g., Surcis et al.2011b). We note that Edris et al. (2005) identified one Zeeman pair of OH masers, which indicates a magnetic field strength of about+11 mG in the direction pointing away from the observer at the opposite side of the disk from Zone A (see Fig.4). Therefore, this could be evi-dence for the reversal of the magnetic field from above to below the disk.
vectors of OH masers should be rotated of approximately 60◦to be consistent with those of the CH3OH masers. This rotation is equal to the foreground Faraday rotation estimated in Sect.5.2. Consequently, the magnetic field derived from the OH maser emission would also be consistent with theS-shaped morphol-ogy measured by Shinnaga et al. (2012).
The good agreement of the magnetic field from small to large scale suggests that the CH3OH masers of Group 1 are not on the disk but they are likely to be tracing material that is being ac-creted onto the disk along the magnetic field line as in Cepheus A (Vlemmings et al. 2010). Indeed, if the CH3OH masers of Group 1 were on the disk, we would have expected a resulting magnetic field that is much more random because of turbulent motions in the disk (Seifried et al.2012b). The CH3OH masers of Group 2 are instead interpreted as tracing the material in the disk winds that is flowing out along the twisted magnetic field lines. In this case, the CH3OH masers should have a helical mo-tion, like the SiO masers in Orion (Matthews et al.2010), which is consistent with the proper motion of Group 1 measured by MCR11.
5.4. Role of the magnetic field
To investigate theS-shaped morphology Shinnaga et al. (2012) calculated the evolution of a magnetized cloud that has the same observed parameters of IRAS 20126+4104. They considered a constant magnetic field strength of 1.5×10⁻⁵G parallel to the zaxis and with the rotation axis, which is rotated at an angle of 60◦with respect to thezaxis, on they-zplane. In their simula-tions the initial cloud has the energy ratiosErot/Egrav=0.02 and EB/Egrav =0.55, i.e.Erot < EB. HereErotis the rotational en-ergy,Egravthe gravitational energy, andEBthe magnetic energy
in the cloud. They find that the simulated magnetic field vec-tors agree with the observed morphology of the magnetic field if the cloud is observed from thex-yplane with a viewing angle of 30◦with respect to theyaxis. More recently, Kataoka et al. (2012) have shown that in star-forming cores the polarization distribution projected on the celestial plane strongly depends on the viewing angle of the cloud.
Kataoka et al. (2012) studied four different models in which they adopted a uniform magnetic field that has the same direction but different strengths for each model. In Models 3 and 4, the ro-tation of the cloud is introduced and the roro-tation axis is inclined from the magnetic field lines at an angle of 60◦. Model 4 has the strongest magnetic field among all the models. According to their simulations, the large-scaleS-shaped morphology, i.e. the magnetic field deviating from an hourglass configuration, in IRAS 20126+4104 might be explained by Model 3, and it is caused by (1) the misalignment of the magnetic field with the rotation axis and by (2)Erot > EB. A slight misalignment of
the magnetic field with the rotation axis was observed on a large scale by Shinnaga et al. (2012), who measured that the mean direction of the global magnetic field isΦBglobal = −3◦, and the rotation axis of the cloud is PArot=−40◦±20◦. Condition (2) of Kataoka et al. (2012) instead contradicts the initial conditions of the simulations made by Shinnaga et al. (2012).
So far, no observational determinations of the ratio between ErotandEBhas been possible because no magnetic field strength
has been measured in IRAS 20126+4104. But now we can de-termine ifErot>EB(hereafter case A) or ifErot<EB(hereafter
case B) by using our estimates of the magnetic field strength at CH3OH maser densities.
We assume that the cloud is a homogeneous solid sphere with magnetic flux freezing during its evolution. The rotational
energy for a homogeneous solid sphere with radiusR, massM, and angular velocityΩis
Erot=1 5MR
2Ω2, (3)
while the magnetic energy for the same sphere is
EB=
1 6|B|
2R3, (4)
where|B|is the magnetic field strength into which the sphere is immersed. The critical value of magnetic field at whichErot = EBis
|Bcritical|=
6 5 ·
M1/2Ω
R1/2 · (5)
Considering that the estimates for the cloud properties of IRAS 20126+4104 areR=0.54 pc,M=402M(Hofner et al. 2007), andΩ = 2 km s−1pc−1 (Shinnaga et al.2008), we find that the critical value of the magnetic field of the cloud should be
|Bcritical|=5×10⁻⁵G. (6)
This|Bcritical|value is determined not at the CH3OH maser den-sities, so it cannot be directly compared with the magnetic field strength measured by us. But because we have assumed the presence of magnetic flux freezing in the cloud, the relation |B| ∝nκH2, whereκ=0.47 as empirically determined by Crutcher (1999), can be used to estimate|Bcritical| at the CH3OH maser densities. We assume |B| ∝ n0.47
H2 because it is proven to be valid up to densities of 1011 cm−3 (Vlemmings 2008). Cragg et al. (2005) determine that the number density of 6.7-GHz CH3OH maser (nCH3OHH2 ) varies from 107 cm−3 to 109 cm−3, above which the CH3OH masers are quenched. Therefore, we have to estimate a range of|Bcritical| by considering the whole range of nCH3OHH2 . The critical value of the magnetic field at the densities of the 6.7-GHz CH3OH maser is thus between |B107cm−3
critical | = 0.001 G and |B 109cm−3
critical | = 0.01 G. Consequently, in Case A,|B109cm−3
critical |caseA <0.01 G (κ =0.47), and in Case B, |B107cm−3
critical |caseB>0.001 G (κ=0.47).
It is important to mention that Crutcher et al. (2010) claim a different value of κ, i.e. κ = 0.65. They find that at densi-ties less than 102 cm−3, magnetic fields are density indepen-dent; i.e., they are constant, while for higher densities they vary as|B| ∝ n0.65
H2 . Even though this relation has so far been veri-fied for densities up to 107cm−3, for the sake of completeness we also estimate|Bcritical| at CH3OH maser densities by using |B| ∝ n0.65
H2 . Repeating the calculation forκ = 0.65, we found |B109cm−3
critical |caseA<0.1 G (κ=0.65) and|B 107cm−3
critical |caseB>0.004 G (κ=0.65).
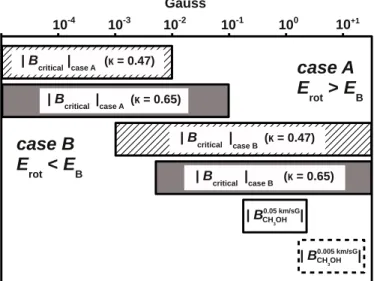
In Fig. 5 we show a simple diagram that can help visu-alize the different |Bcritical| ranges and the measured |BCH3OH|, which are estimated by using bothαZ = 0.05 km s−1G−1 and
αZ = 0.005 km s−1G−1. To determine the ranges of |BCH3OH|, we also considered the errors ofΔVZ andθ. We can see from Fig.5that the magnetic field measured from the Zeeman split-ting of the CH3OH maser M05, independently of the value ofαZ andnCH3OHH2 , indicates thatErot <EB(both forκ=0.47 and for κ=0.65).
Fig. 5.A comparison between the magnetic field strength estimated from the Zeeman splitting of the CH3OH maser feature M05 and the
critical magnetic field strength if Erot > EB and if Erot < EB. The
hatched area and the dark gray area show the critical magnetic field strength in caseκ=0.47 (Crutcher1999) and in caseκ=0.65 (Crutcher et al.2010), respectively. The full box indicates the range of|BCH3OH|
measured by consideringαCH3OH
Z =0.05 km s−
1G−1, while the dashed
box indicates the range of|BCH3OH|ifα CH3OH
Z =0.005 km s−
1G−1. The
ranges are estimated considering both the errors ofΔVZandθ.
that the magnetic field strength measured by Edris et al. (2005), i.e. 11 mG, satisfies Case B, i.e. Erot < EB, only if κ = 0.47
(|B108cm−3
critical |caseB > 10−4 G) and Case A, i.e. Erot > EB, only if
κ=0.65 (|B105cm−3
critical |caseA<0.02 G).
Therefore, in our estimates the magnetic field dominates the rotation of the cloud. Moreover, we can speculatively state that the initial conditions of Shinnaga et al. (2012) are correct and that theS-shaped morphology of the magnetic field cannot be described by Model 3 of Kataoka et al. (2012). However, in Model 4 of Kataoka et al. (2012), the magnetic field is stronger, and we have the initial conditionErot < EB. In this case they
find that the deviation of the magnetic field lines from the hourglass configuration could only be observed very close to the protostar, i.e., where the magnetic field is probed by the 6.7-GHz CH3OH masers. Of course, further observations, for instance of dust tracers in full polarization mode at mas resolu-tion, could in future help clarify the role of the magnetic field in IRAS 20126+4104.
6. Conclusions
The YSO IRAS 20126+4104 has been observed in full polariza-tion spectral mode at 6.7-GHz with the EVN and at 22-GHz with the VLBA to detect linear and circular polarization emission from CH3OH and H2O masers, respectively. We detected 26 CH3OH masers and 5 H2O masers at mas resolution. Linearly polarized emission was detected towards three CH3OH masers and one H2O maser that probed the magnetic field both close
to the Keplerian disk and to the large-scale outflow. The ori-entation of the magnetic field derived from the masers agrees with theS-shaped morphology that was measured by Shinnaga et al. (2012) on a larger scale by using dust-polarized emission at 350μm.
Moreover, we were able to measure a Zeeman splitting of −9.2 m s−1 from the brightest 6.7-GHz CH3OH maser. From this measurement, we determined that the magnetic field energy dominates the rotation energy of the region; i.e.,Erot<EB.
Acknowledgements. We wish to thank an anonymous referee for making
use-ful suggestions that have improved the paper. The EVN is a joint facility of European, Chinese, South African, and other radio astronomy institutes funded by their national research councils.
References
Caratti o Garatti, A., Froebrich, D., Eislöffel, J., et al. 2008, A&A, 485, 137 Cesaroni, R., Felli, M., Testi, L., et al. 1997, A&A, 325, 725
Cesaroni, R., Felli, M., Jenness, T., et al. 1999, A&A, 345, 949 Cesaroni, R., Neri, R., Olmi, L., et al. 2005, A&A, 434, 1039 Cesaroni, R., Galli, D., Lodato, G., et al. 2006, Nature, 444, 703
Cesaroni, R., Galli, D., Lodato, G., et al. 2007, in Protostars and Planets V, eds. B. Reipurth, D. Lewitt, & K. Keil (Tucson: Univ. of Arizona Press), 197 Cesaroni, R., Massi, F., Arcidiacono, C., et al. 2013, A&A, 549, A146 Cragg, D. M., Sobolev, A. M., & Godfrey, P. D. 2005, MNRAS, 360, 533 Crutcher, R. M. 1999, ApJ, 520, 706
Crutcher, R. M. 2012, ARA&A, 50, 29
Crutcher, R. M., Wandelt, B., Heiles, C., et al. 2010, ApJ, 725, 466 Edris, K. A., Fuller, G. A., Cohen, R. J., et al. 2005, A&A, 434, 213 Goldreich, P., Keeley, D. A., & Kwan, J. Y., 1973, ApJ, 179, 111 Hofner, P., Cesaroni, R., Olmi, L., et al. 2007, A&A, 465, 197
Johnston, K. G., Shepherd, D. S., Robitaille, T. P., et al. 2013, A&A, 551, A43 Kataoka, A., Machida, M., & Tomisaka, K. 2012, ApJ, 761, 40
Kaufman, M. J., & Neufeld, D. A., 1996, ApJ, 456, 250
Kemball, A. J., Diamond, P. J., & Cotton, W. D. 1995, A&AS, 110, 383 Keto, E., & Zhang, Q. 2010, MNRAS, 405, 102
Matthews, L. D., Greenhill, L. J., Goddi, C., et al. 2010, ApJ, 708, 80 Moscadelli, L., Cesaroni, R., & Rioja, M. J. 2005, A&A, 438, 889
Moscadelli, L., Cesaroni, R., Riojia, M. J., et al. 2011, A&A, 526, A66 (MCR11) Myers, A. T., McKee, C. F., Cunningham, A. J., et al. 2013, ApJ, 766, 97 Nedoluha, G. E., & Watson, W. D., 1992, ApJ, 384, 185
Peters, T., Banerjee, R., Klessen, R. S., et al. 2011, ApJ, 729, 72 Seifried, D., Banerjee, R., Klessen, R. S., et al. 2011, MNRAS, 417, 1054 Seifried, D., Pudritz, R. E., Banerjee, R., et al. 2012a, MNRAS, 422, 347 Seifried, D., Banerjee, R., Pudritz, R. E., et al. 2012b, MNRAS, 423, L40 Shepherd, D. S., Yu, K. C., Bally, J., et al. 2000, ApJ, 535, 833
Shinnaga, H., Phillips, T. G., Furuya, R. S., et al. 2008, ApJ, 682, 1103 Shinnaga, H., Novak, G., Vaillancourt, J. E., et al. 2012, ApJ, 750, L29 Sun, X. H., Reich, W., Waelkens, A., et al. 2008, A&A, 477, 573
Surcis, G., Vlemmings, W. H. T., Torres, R. M., et al. 2011a, A&A, 533, A47 Surcis, G., Vlemmings, W. H. T., Curiel, S., et al. 2011b, A&A, 527, A48 Surcis, G., Vlemmings, W. H. T., van Langevelde, H. J., et al. 2012, A&A, 541,
A47
Surcis, G., Vlemmings, W. H. T., van Langevelde, H. J., et al. 2013, A&A, 556, A73
Tang, Y.-W., Ho, P. T. P., Koch, P. M., et al. 2009, ApJ, 700, 251 Vlemmings, W. H. T. 2008, A&A, 484, 773
Vlemmings, W. H. T., Diamond, P. J., van Langevelde, H. J., et al. 2006, A&A, 448, 597
Vlemmings, W. H. T., Surcis, G., Torstensson, K. J. E., et al. 2010, MNRAS, 404, 134