Physicochemical code for quinary protein interactions
in
Escherichia coli
Xin Mua, Seongil Choia, Lisa Langa, David Mowrayb, Nikolay V. Dokholyanb, Jens Danielssona,1, and Mikael Oliveberga,1 aDepartment of Biochemistry and Biophysics, Arrhenius Laboratories of Natural Sciences, Stockholm University, S-106 91 Stockholm, Sweden;
andbDepartment of Biochemistry and Biophysics, University of North Carolina School of Medicine, Chapel Hill, NC 27599
Edited by José N. Onuchic, Rice University, Houston, TX, and approved April 10, 2017 (received for review December 27, 2016)
How proteins sense and navigate the cellular interior to find their functional partners remains poorly understood. An intriguing aspect of this search is that it relies on diffusive encounters with the crowded cellular background, made up of protein surfaces that are largely nonconserved. The question is then if/how this protein search is amenable to selection and biological control. To shed light on this issue, we examined the motions of three evolutionary divergent proteins in theEscherichia colicytoplasm by in-cell NMR. The results show that the diffusive in-cell motions, after all, follow simplistic phys-ical−chemical rules: The proteins reveal a common dependence on (i) net charge density, (ii) surface hydrophobicity, and (iii) the electric dipole moment. The bacterial protein is here biased to move relatively freely in the bacterial interior, whereas the human counterparts more easily stick. Even so, the in-cell motions respond predictably to surface mutation, allowing us to tune and intermix the protein’s behavior at will. The findings show how evolution can swiftly optimize the diffuse background of protein encounter complexes by just single-point mu-tations, and provide a rational framework for adjusting the cytoplas-mic motions of individual proteins, e.g., for rescuing poor in-cell NMR signals and for optimizing protein therapeutics.
in-cell NMR
|
protein surface properties|
intracellular diffusionD
espite considerable progress in mapping out how proteins interact functionally through structure and evolved inter-faces (1–3), there is yet little known about how proteins interact nonspecifically upon random diffusive encounters (4–10). Al-though these nonspecific“quinary”(11) interactions are typically weak and short-lived, they are still expected to affect function because of their sheer numbers: Under crowded cellular condi-tions, they compete with specific binding (6–8), control diffusion (12), and skew structural stability (5, 13–19). The question is then to what extent this dynamic background of nonspecific in-teractions is biologically controlled and optimized. Part of the answer is hinted by the tendency of soluble proteins, nucleic acids, and membranes to carry a repulsive net-negative charge (20, 21). Such basal level of repulsion between the cellular components is further indicated by a matching surplus of positive counter ions like K+, Mg2+, Ca2+,and Zn2+, which greatly ex-ceeds the concentration of negative dittos HCO3−, Cl−, SO42−,and PO42−(22). However, proteins expose also positive, polar,
and hydrophobic moieties that operate against the net-negative charge repulsion by engaging in attractive interactions upon diffusive encounters. The strength and duration of these attractive interactions depend on the proteins’detailed surface composition, relative orientations, and ability to adapt complementary shapes. Following Elcock’s estimate for the Escherichia coli cytoplasm, each protein experiences at all times approximately five putative interaction partners in its immediate cellular environment (8). Sometimes, mutual fits enable strong functional binding (1, 2), but, most often, the proteins just separate after a brief tête-à-tête (3), in search of higher-affinity partners. A key detail is that the effect of this quinary interplay on protein stability varies with protein identity and type of host cell (5, 9, 13–19, 23–26). The
“crowding”effect is thus not limited to steric exclusion (27) but has also a decisive dependence on sequence composition and the
details of the quinary interactions. In this study, we examine to what extent these ubiquitous background interactions are bio-logically tunable and can be accounted for (Fig. 1). The results show that the quinary interactions are critically sensitive to surface mutation and that proteins from divergent organisms respond very differently to theE. colicytoplasm: Although the bacterial protein moves relatively freely in the bacterial interior, the human ho-molog tends to stick. Even so, the proteins can readily be tuned to any desired in-cell mobility by just a few structurally benign surface mutations, following a universal dependence on their macroscopic surface properties. As such, our findings present the physical−chemical code for quinary interactions in theE. colicytoplasm with numerous implications for functional protein design and deciphering the functional evolution of proteomes.
Experimental Protocol
Proteins.To assure that the proteins mainly report on the
non-specific in-cell encounters, possible non-specific interactions were mitigated by removal of the active sites and binding sites (SI Ma-terials and Methods). For bacterial TTHA1718 [Protein Data Bank (PDB) 2ROE] (28) and human HAH1 (PDB 1TL4) (29), this process involved mutational substitution of the metal-binding li-gands, and, for SOD1, truncation of the active-site loops that also ruptures the dimer interface (PDB 4BCZ) (30–32). The resulting pseudo-wild-type proteins are denoted TTHAPWT, HAH1PWT, and SOD1barrel, and are listed inTable S1andFig. S1together with 127 analyzed surface mutations.
Experimental Strategy.The proteins (Table S1andFig. S1) were
pro-duced and analyzed in E. coli BL21(DE3)pLysS cells as follows
Significance
This study shows that the diffusive motions of proteins in live cells are by no means without control but follow simplistic physical−chemical rules that can be quantified and optimized through surface composition. Most strikingly, human proteins are observed to stick to the“foreign”environment of bacterial cells, whereas the bacterial analogue moves around freely. Even so, the human proteins can predictably be transformed to bacterial behavior with a few structurally benign surface mutations, and, conversely, the bacterial protein can be made to stick. The findings have not only fundamental implications for how protein function is controlled at the physical−chemical level but can also be used to adjust protein motion inEscherichia coliat will.
Author contributions: X.M., J.D., and M.O. designed research; X.M., S.C., L.L., D.M., N.V.D., J.D., and M.O. performed research; X.M., J.D., and M.O. analyzed data; and X.M., J.D., and M.O. wrote the paper.
The authors declare no conflict of interest.
This article is a PNAS Direct Submission.
Freely available online through the PNAS open access option.
1To whom correspondence may be addressed. Email: [email protected] or jens.danielsson@
dbb.su.se.
This article contains supporting information online atwww.pnas.org/lookup/suppl/doi:10.
(SI Materials and Methods). Overexpression was induced by 1-thio-β -D-galactopyranoside (IPTG) in isotope-enriched medium and sustained for 4 h, yielding intracellular concentrations of 1.6±0.8 mM N15-labeled protein (SI Materials and MethodsandFig. S1). The culture was then nondisruptively centrifuged at 800×gfor 8 min to obtain a pellet of intact, viable cells. One gram of this cell pellet was carefully dissolved in 1 mL of M9 buffer, transferred to an NMR tube, and subjected to in-cell spectral analysis, i.e., samplein cell. For control of protein leakage, the samplein cellwas extracted from the NMR tube and centrifuged at 2,400×gfor 2 min to obtain a cell-free supernatant of the intervening M9 buffer, i.e., samplesupernatant. The pelleted cells were then resuspended to the original sample volume with M9 buffer, lysed to set free the intracellular target protein, and centrifuged at 17,000×gfor 10 min to remove cell debris and larger macromolecular species. This decrowded lysate, which represents a much more dilute background than the cytoplasm (SI Controls,Fig. S1, andTable S2), was finally used as a control for internalized protein, i.e., lysatesupernatant. An advantage of this protocol is that the amount of labeled protein in the NMR detection volume is kept the same in samplein cell and
lysatesupernatant, allowing estimates of dynamic changes upon cell
rup-ture from changes in peak heights alone (ResultsandSI Controls).
Results
Bacterial and Human Homologs Respond Differently to theE. coli
Cytoplasm. For reference, we acquired first the in-cell NMR
spectra of the pseudo-wild-type variants of bacterial TTHA (TTHAPWT), human HAH1 (HAH1PWT), and the human SOD1
barrel (SOD1barrel) (Fig. 1). Analysis shows that E. coli cells
expressing bacterial TTHAPWT (samplein cell) display a highly dispersed Heteronuclear Multiple Quantum Coherence (HMQC) spectrum with well-resolved cross-peaks, characteristic for a rap-idly tumbling and fully folded structure (Fig. 2). Subsequent tests of leakage (samplesupernatant) reveal typically very low amounts of labeled material in the intervening medium (SI Controls,Table S1, andFig. S2), indicating that the signal indeed stems from protein in the cytoplasm (Fig. 2). Finally, the supernatant of the lysed cells (lysatesupernatant) yields a spectrum analogous to that in samplein cell, but with a slight sharpening of the HMQC cross-peaks (Fig. 2).
The lysatesupernatantspectrum is further indistinguishable from that obtained in pure buffer, showing that the low levels of endogenous
E. coliproteins remaining in the lysate supernatant (∼10 mg/mL; SI ControlsandFig. S1) have negligible impact on the analysis: lysatesupernatantmimics a pure-buffer control. Taken together, these results show that the E. coli cytoplasm has limited, but yet mea-surable, impact on the dynamic behavior of bacterial TTHAPWTand
that these restrictions ease upon cell lysis. With the human analog HAH1PWT, however, the situation is distinctly different. The in-cell
spectrum of this protein is broadened out to the extent that it completely disappears, using the same data contour level settings as for TTHAPWT. What remain visible in samplein cellare only the
distinct cross-peaks of the background of labeled metabolites that always accumulate during overexpression in labeled growth medium (Fig. 2). The cause of such global line broadening for a globular protein is normally decreased rotational mobility (33–35). Conspic-uously, the folded HAH1PWTspectrum subsequently restores to high resolution upon cell lysis in lysatesupernatant, indicating that the protein is just reversibly restricted by the cytoplasm and readily sets free upon cell lysis (Fig. 2). We observe the very same behavior for the human SOD1barrel(Fig. 2): Although the protein is previously found to move freely in human cells (5, 31), it seems to stick in theE. colicytoplasm.
In-Cell NMR Spectra Can Be Made to Appear and Vanish by
Single-Point Mutations.The question is then, what allows TTHAPWTto
tumble relatively freely in theE. coliinterior whereas HAH1PWT
and SOD1barrelseem to get stuck? Because the effect unlikely
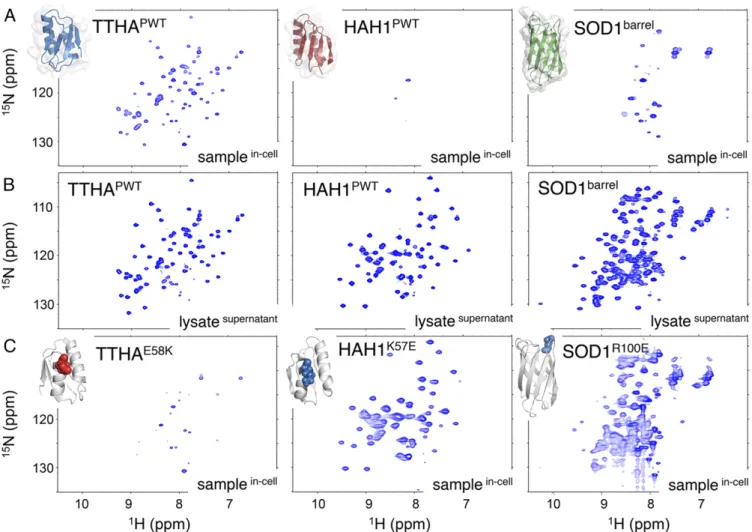
arises from specific binding to biological partners but rather from diffuse quinary interactions with the molecular background (5, 9), we start by investigating the role of protein charge (21). As illustrated in Fig. 3, the electrostatic potentials of the TTHAPWT, HAH1PWT, and SOD1barrelsurfaces are quite different. First out was the mutation HAH1K57E, which replaces the positive surface charge K57 of the human protein with the negative counterpart E57 of the bacterial TTHAPWT. The mutation has negligible impact on protein folding and stability (SI Controls and Fig. S2), but it increases the formal net charge of HAH1 by−2. As a result, the in-cell cross-peaks of HAH1 sharpen up radically and reveal a high-resolution HMQC spectrum of the folded state, analogous to that of TTHAPWT(Fig. 2). Cytoplasmic localization was verified by the samplesupernatant, which revealed no trace of leakage (Table S1). Whatever dynamic restrictions are experienced by the pseudo-wild-type protein in theE. colicytoplasm appear to be largely counter-acted by the point mutation K57E. Similarly, the mutation R100E induces distinct cross-peak sharpening of SOD1barrel, albeit that the spectral restoration is not as prominent as observed for HAH1K57E (Fig. 2). Boosting protein’s net-negative charge seems thus to be an efficient means to increase cytoplasmic mobility and rescue poor in-cell spectra. As proof of principle, we finally designed a protein to stick to theE. coliinterior by decreasing the formal net charge of TTHAPWT with the construct TTHAE58K. The result is a nearly complete loss of the in-cell NMR signal (Table S1and Fig. 2).
Strategy for Quantification of In-Cell Mobility.To establish whether
the ordered response to net charge alterations indeed relates to unspecific electrostatic repulsion, or stems from serendipitous obstruction of functional binding sites, we set out to quantify the effect. Under the present conditions, the NMR line width (Δν1=2) scales with the protein correlation time (τc), which, in turn, is
mainly determined by three components,
τ−1
c =τ−1r +τ−1l +τ−1exch, [1]
whereτris the rotational correlation time,τlis the local dynamics
correlation time, andτexchis the correlation time of any putative
chemical exchange. Because the protein variants in this study are fully folded and maintain, in all cases, fixed 3D structures in the E. colicytoplasm (SI Controls,Table S3, and Fig. S2), the
Fig. 1. Measurements of the cytoplasmic motions of three evolutionary di-vergent proteins by in-cell NMR: bacterial TTHA, human HAH1, and human SOD1barrel. Isotope-labeled proteins were generated directly in theE. coli
cy-toplasm by overexpression. The intact cells were then carefully washed and transferred to NMR tubes for detection of internal protein motions. Our ob-servable is the protein’s rotation correlation time, i.e., how freely it tumbles around, which is a sensitive measure of the interactions experienced in the crowdedE. coliinterior. In essence, NMR spectra with narrow cross-peaks show that the proteins tumble unrestricted, and broadened-out spectra show that the proteins get stuck. By point mutation, we gradually tune the three pro-teins between these extremes to map out the physical−chemical code for the cytoplasmic crosstalk (Table S1andFig. S1).
BIO
PHYSICS
AND
COMPU
TATIONAL
BIOLOGY
PNAS
contribution from local motions (τl) is negligible (36). Likewise,
the uniform distribution of the line-broadening effect seen for all amino acids of the proteins (SI Controlsand Fig. S2) indicates that the change in chemical exchange (τexch) upon transfer into
the cells is small, as this would preferentially affect moieties on the protein surfaces. Hence, the line-broadening effect is global, i.e., the relative change in line width is similar for all cross-peaks. Consequently, the main modulator of NMR line width (Δν1=2) can here be ascribed to the rotation correlation time (τr), in
ac-cordance with previous in-cell NMR studies (37, 38),
τc≈τr= 4πR3
Hη 3kBT =
VHη
kBT
, [2]
whereVHis the hydrodynamic volume andηis the apparent viscosity.
Experimentally, we determined the change inτr(Eqs.1and2) upon transfer into the cytoplasm from the ratio of the cross-peak heights (h) in the lysatesupernatantand the samplein cellspectra according to
mobilityin cell=τlysater τrin cell=hin cellhlysate, [3]
using the property thathin cell/hlysate=Δνlysate1=2 =Δνin cell
1=2 when protein concentration is kept constant. For simplicity, we refer tentatively to
mobilityin cell as change in intracellular‘mobility’ (37). A value of mobilityin cell = 1 means that the in-cell mobility is similar to that in pure water, i.e.,τr=4 ns for TTHA (28) and HAH1 (29) and 7 ns for SOD1barrel(32), whereas mobilityin cell=0 means that the in-cell cross-peaks have broadened beyond detection (i.e.,τr J 60 ns).
Quantification of Protein Net Charge.Because estimates of residue
charge from model compound values fail to account for shifts in protonation state of titratable groups (i.e., shifted pKa values), induced by folding or mutation (39), we opted for analysis by electrophoretic mobility (40). Following standard protocols, each protein constructi(Table S1) was run on a native gel along with the TTHAPWTreference (SI Materials and MethodsandFig. S4). The measured mobility ratio (R i
f=Rreff ) relates here to the protein net charge ratio (Zi=Zref) according to (40)
R i
f
Rref
f =
ZiEfiZrefEfref=Ziri
H
Zrefrref
H
, [4]
whereZis the protein net charge,Eis the applied electrical field,
fis the friction coefficient, andrHis the hydrodynamic radius=
f=6πη, whereηis the gel density. To obtain proportionality with in-cell interaction,rHwas converted to solvent-accessible surface
Fig. 2. In-cell HMQC spectra showing that the bacterial TTHA moves relatively unrestricted in theE. colicytoplasm, whereas the human HAH1 and SOD1 get restricted by intracellular interactions, i.e., the protein motions become significantly retarded. The behavior, however, is readily reversed by point mutation of surface charges. (A) The well-resolved in-cell spectrum of TTHAPWTindicates rapid motion in the cytoplasm, whereas the broadened-out spectra of HAH1PWTand
SOD1barrelshow that the in-cell motions are restricted (samplein cell, intact cells). The cross-peaks of the latter spectra are largely from the background of small
metabolites. (B) Corresponding spectra after cell lysis, showing that all three proteins move freely upon removal of the cytoplasmic restrictions (lysatesupernatant,
area (SASA=4πrH2), yielding a dimensionless measure of the surface charge density ratio (chargedensity) between construct i
and the TTHAPWTreference,
chargedensity=Zi=SASAi=Zref=SASA ref=
R fi=R fref
rrefH=rHi
,
[5]
where R i
f=Rreff is the observed gel mobility ratio (Eq. 5) and
rref
H=riH is the radius-to-area conversion factor. The latter was determined by diffusion NMR, yieldingrref
H=riH = 1, 0.98, and 0.79 for TTHAPWT, HAH1PWT, and SOD1barrel, respectively (Fig. S4andTable S4). Because some proteins inTable S1tend to lose net negative charge at pH values below 7, thus halting or reversing their electrophoretic mobility, the native gels had to be run according to standard protocols at pH 8.3 (SI Materials and Methods), where all constructs remain net negative. As a control, the eletrophoretically determined values of Zi/Zref agree well with those calculated from model compound pKA values (Fig.
S4). Finally, to account also for the partial histidine protonation observed under intracellular conditions at pH 6.5 to 6.7 (SI Con-trols), we added the chargedensityoffsets 0.13, 0.25, and 0.32 for TTHA, HAH1, and SOD1barrel, respectively (SI Materials and Methods). Although this minor correction falls largely within the data scatter, it is added for completeness of analysis.
In-Cell Mobility Shows Common Dependence on Net Charge Density.
Analysis of a comprehensive set of mutations, including alter-ations of both surface charge and hydrophobicity (Table S1), shows that the bacterial protein TTHA undergoes a progressive increase of in-cell mobility upon increasing the net-negative charge (Fig. 4). Despite considerable scatter in the mobilityin cellvs. chargedensityplot (Eqs.3and5), the result is statistically significant withR=0.73. A similarly scattered dependence on chargedensityis found for the surface mutations of the human homolog HAH1 (R=0.84), but, in this case, the plot is overall offset to lower mobilityin cellvalues (Table S1and Fig. 4). The trend is completed by the surface mutations of SOD1barrel, adding a third—again seemingly parallel—data set below that of HAH1 (R=0.61) (Table S1and Fig. 4). On the whole, the results are consistent with net-negative re-pulsion being a fundamental factor in modulating in-cell solubility and protein−protein interactions (20–22). However, the discrete offsets in the mobilityin cellvs. chargedensityplots in Fig. 4 indicate that there are more factors than surface net charge at play in controlling the in-cell mobility. Contributions from such additional factors are also emphasized by the conspicuous data scatter, which is clearly
outside the errors of the individual measurements (Fig. 4). The data spread for the whole data set as measured by linear-fit deviation per point, i.e., the residual sum squared (RSS), is RSS = 0.015 (SI Controls,Fig. S3, andTable S5).
Notes on Variability, Protein Leakage, and Self-Interaction. As a
measure of experimental variability, the data set in Fig. 4 con-tains—without any exclusions—all measurements performed, including the subset where the supernatant controls revealed some extent of leakage. The latter constitute 38 of a total of 203 experiments, and, on average, the indicated leakage was 16% (Table S1). To single out these experiments, the statistics of the analysis are given both for the total data set (RSSall) and for the data set where the leakage set is excluded (RSSsub), where the unit is in“per point,”i.e., RSS total/number of data points. As seen below, however, the difference between RSSall and RSSsubis very small (Table S5). The explanation seems to be that the detected leakage is generally not present during the de-termination of mobilityin cellin samplein cell, but occurs during the
handling of fatigued cells in the supernatant preparation. In support of this possibility, (i) the supernatant sample in some cases show distinct narrow cross-peaks that are missing in samplein cell, (ii) repeated measurements with varying degrees of leakage yield still small variations in mobilityin cell, and (iii) the samplein cellsignal is, in all cases, stable over the acquisition time and not gradually increasing as would be expected from on-going leakage (Fig. S1). Second, to examine whether the results show any dependence on expression level, we plotted mobilityin celland deviation from fit vs. intracellular concentration of overexpressed protein (Fig. S1). The controls reveal no self-interaction between the overexpressed proteins, i.e., the mobilityin cellappears to stem from interaction with endogenous cellular components.
Surface Hydrophobicity: A Matter of Depth.As second modulator of
in-cell mobility, we examined hydrophobicity. The trend is evi-dent already at the level of the TTHAPWT, HAH1PWT, and SOD1barrel structures, where the hydrophobic surface area as
measured simply by exposure of V, L, and I methyl groups sums up to 8%, 12%, and 17%, respectively (Fig. 4). Moreover, the plot of mobilityin cellvs. this fractional exposure seems to account for the protein-specific offsets in the mobilityin cellvs. chargedensity data (Fig. 4). To quantify the effect more strictly, we estimated, for each mutant, the change in hydrophobic exposure from energy minimizations of the TTHAPWT, HAH1PWT, and SOD1barrel struc-tures (SI Materials and Methods) according to
hydrophobicitySASA=SASAlocalhp =SASA global
, [6]
where SASAlocalhp is the hydrophobic SASA and SASAglobalis the total SASA (SI Materials and Methods). The resulting plot of mobilityin cellvs. [chargedensity; hydrophobicitySASA] reveals a plane that captures the in-cell motion for all three proteins (Fig. 4). In essence, the offsets in the mobilityin cellvs. chargedensityplots (Fig. 4) are orderly displaced in the added hydrophobicitySASAdimension, with an accompanying reduction of the scalar-fit deviations from RSSall=0.015 and RSSsub=0.014 to RSSall=0.012 and RSSsub= 0.011 (Table S5). When it comes to the detailed effects of point mutations, however, the hydrophobicitySASA measure
ap-pears relatively insensitive. Although we at mutant level gener-ally discern decreased in-cell mobility upon increasing side-chain hydrophobicity, the resulting change in hydrophobicitySASAcan
go either way because of local repacking (Table S1). Analogous surface adjustment is often seen upon binding of designed li-gands (41, 42) and is here illustrated computationally by docking isobutane (valine mimic) to the SOD1barrel: The ligand becomes almost entirely engrossed in the surface, driven by contacts that are buried in the crystal structure (Fig. S4). In an attempt to
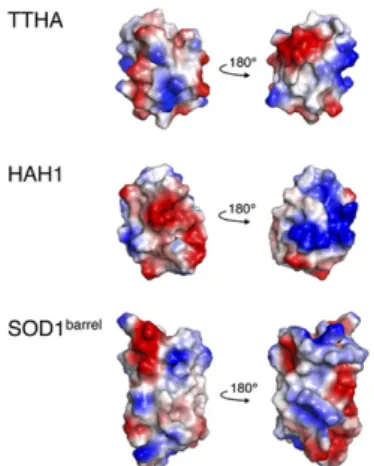
Fig. 3. The electrostatic potentials of the TTHA, HAH1, and SOD1barrel
sur-faces as calculated by the software PyMol. Despite the bacterial TTHA and human HAH1 being homologous, their electrostatic surface patterns are very different. The projections of the structures to the left follow those in Fig. 1.
BIO
PHYSICS
AND
COMPU
TATIONAL
BIOLOGY
PNAS
quantify this dynamically accessible surface area (DASA), we assumed crudely that all residues that are not buried in the pro-tein’s hydrophobic core are free to interact with the cellular environment upon dynamic rearrangement (Fig. 5). Second, we assigned a hydrophilicity to each of the residues in the DASA layer according to their Guy solvation energies (43),ΔF′i(Table S1). In essence, ΔFi′ is a statistical term describing the depth distribution of the different residues in protein crystal structures, which also correlates with the residue water-to-octanol partition free energies (43). Normalization to surface area was finally obtained by dividing the sum of the Guy solvation energies with the number of residues in the DASA layer (nDASA) construct
according to
hydrophilicityGuy= 1
nDASA
X
nDASA
ΔFi′. [7]
Interestingly, the plot mobilityin cellvs. [chargedensity; hydro-philicityGuy] yields an alternative plane with RSSall= 0.011 and
RSSsub=0.009 (Fig. 6 andTable S5), even though the values of hydrophilicityGuy and hydrophobicitySASAare themselves poorly correlated (R= −0.32;Table S1). Consistently, the RSS devia-tions decrease yet another step to RSSall=RSSsub=0.009 upon including both parameters in the fit. Although hydrophobicitySASA and hydrophilicityGuyhave similar weight in improving the over-all correlation, the latter captures better the effects of point mutation. In the hydrophilicityGuyplot, the individual mutants of TTHA and HAH1 spread out and mix across the plane (Fig. 6 andMovie S1). Whether this indicates that the protein surfaces are indeed plastic by exposing buried material upon in-cell en-counters, or simply reflects that the Guy potential—by including also the solvation energies of polar and charged residues— captures properties complementary to hydrophobicitySASA
re-mains to be found out. Even so, the very convergence of experi-mental data from three unrelated proteins into a single plane shows that the quinary in-cell interactions—despite their detailed complexity—follow common and simplistic rules, governed by the proteins’macroscopic surface properties (Fig. 6). Moreover, the
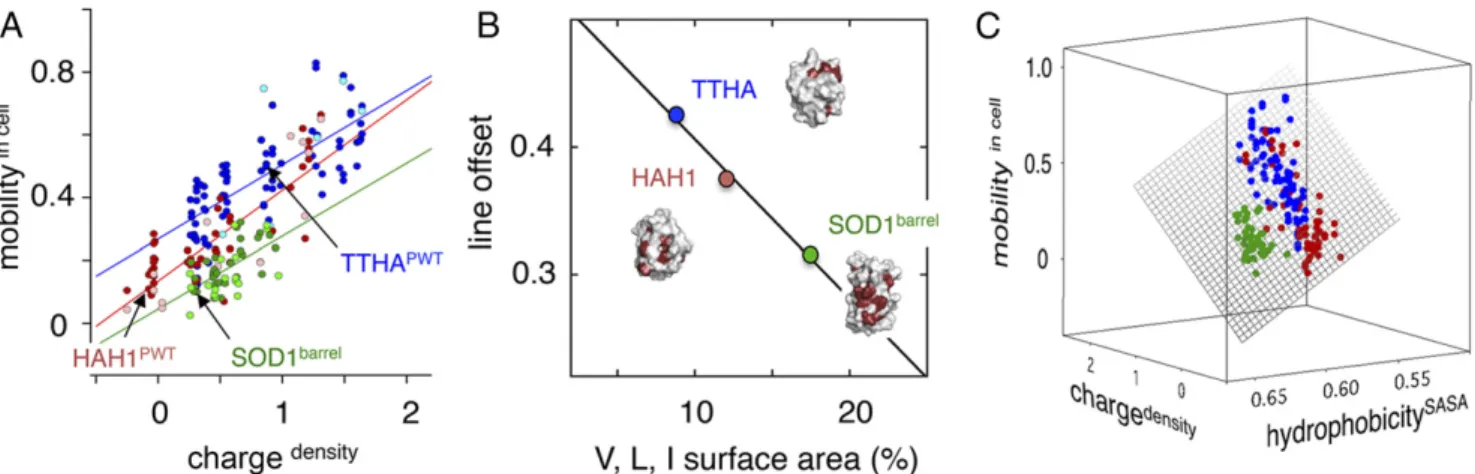
Fig. 4. First step toward quantification of mutational effects on in-cell motion. (A) The observed in-cell motions (mobility ; Eq.3) display an overall scattered increase upon mutational increase of the negative charge density (chargedensity; Eq.5). Even so, the three proteins show differences by being offset in the plot. Given the relatively small measurement errors, this finding indicates that other factors than surface charge density are at play in controlling the in-cell motion. Notably, the experiments with indicated leakage (lightly colored markers) do not stand out in the correlations, suggesting that this leakage occurs during cell handling after in-cell detection (SI Controls). (B) Plot of in-cell motion vs. exposure of the hydrophobic side chains V, L, and I. The simplistic estimate of surface hydrophobicity accounts for the fitted line offsets inAat chargedensity=1. (C) Plot with refined estimate of hydrophobic surface area-based energy minimization of the mutant structures (hydrophobicitySASA; Eq.6). The plot includes the entire data set inTable S1and is extended to three dimensions, i.e., mobilityin cellvs. [chargedensity; hydrophobicitySASA]. Upon accounting for the surface hydrophobicity variation, the data inAconvert to a
well-defined plane. Although the fit is overall improved, the parameter hydrophobicitySASAcaptures poorly the details of individual point mutations because of
considerable local surface rearrangements in the energy minimizations.
Fig. 5. Alternative method for determining the exposure of hydrophobic surface area. To account for the notion that protein surfaces are not perfectly “fixed”but, to some extent, adjust upon contact with external ligands (41, 42), we assumed that all residues outside the hydrophobic cores (transparent structural regions) are free to interact with the environment via dynamic rearrangement. The atoms in this dynamic layer define the DASA, which is con-siderably more extensive than the crystallographic SASA. For quantification and comparison with in-cell mobility data, we finally derived the Guy solvation energies (43) of each residue in the DASA layers to obtain the macroscopic parameter hydrophilicityGuy(Eq.7). The final relation between in-cell motion and
data in Fig. 6 indicate that the cellular components responsible for the in-cell retardation carry repulsive negative charge and attrac-tive surface hydrophobicity. Species matching these characteristics are, e.g., other proteins, membranes, and nucleic acid material.
Enhancing the Precision One Step Further: The Protein Dipole
Moment. In some analogy with frustrated spin-glass systems
(44), charged proteins possess electric dipole moments that are expected to influence their motions under crowded in-cell con-ditions. Upon mutation of surface charges, these dipole moments undergo distinct changes with possible impact on mobilityin cell(Eq.
3). The magnitude of the dipole moment (jjpjj) for each protein construct inTable S1was calculated from the charge positions in
the PDB structures of TTHAPWT, HAH1PWT, and SOD1barrel according to (45)
kpk=XNi=1qiðri−rÞ, [8]
whereqiis the elemental charge at positionri, andris the
pro-tein center of mass, treating the R/K and E/D side chains as positive and negative point charges, respectively. The histidines were omitted from the calculation because their pKAvalues are
not yet known. Conveniently, becausejjpjjis a general vector in space, it does not need normalization to protein surface area to scale with in-cell interaction, as required for the protein net
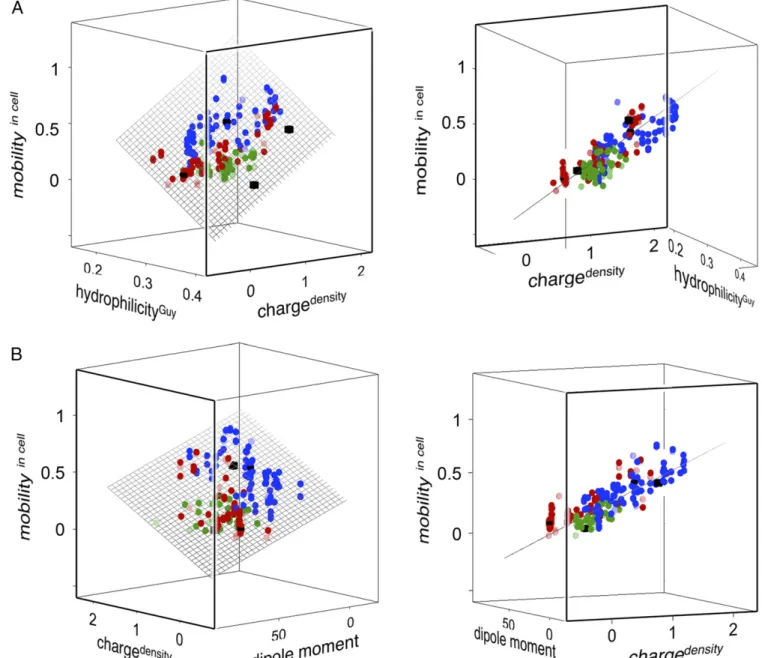
Fig. 6. The high-dimensional relation betweenin-cellmotion and the proteins’macroscopic surface properties. Wild-type proteins are denoted by ■(black solid squares), pseudo-wild-type variants are denoted by
•
(black solid circles), and mutants are denoted by❍(colored solid circles), color-coded as in previous figures. TTHA variants are in blue, HAH1 variants are in red, and SOD1barrelvariants are in green. Data are fromTable S1. Rotations of plots are showninMovies S1andS2. (A) A 3D plot of the experimentally measured mobilityin cell(Eq.3) vs. the surface net charge density (chargedensity; Eq.5) and the surface hydrophilicity (hydrophilicityGuy; Eq.7). (B) Corresponding plot of mobilityin cell
(Eq.3) vs. the surface net charge density (chargedensity; Eq.5) and the electric dipole moment (jjpjj; Eq.8). The correlations inAandBcall attention to the strikingly systematic response of the quinary in-cell interactions to point mutation. Also, the correlations appear generic because they capture all protein constructs, including those of different evolutionary origin.
BIO
PHYSICS
AND
COMPU
TATIONAL
BIOLOGY
PNAS
charge Z (Eq.5) and the Guy solvation energiesΔF′i(Eq.7). The impact ofjjpjjon in-cell motions emerges clearly in a plot of mobilityin cell vs. [chargedensity; jjpjj], which defines a plane (RSSall = 0.010 and RSSsub = 0.009) similar to that of
mobilityin cell vs. [chargedensity; hydrophilicityGuy] (Fig. 6 and
Movie S2). In other words, the dipolar interactions that influ-ence in-cell protein motion are on par with hydrophilicityGuy.
Upon final extension of the correlation to four dimensions, i.e., mobilityin cellvs. [chargedensity; hydrophilicityGuy;jjpjj], the scalar fit deviations decrease just slightly to RSSall=0.009 and RSSsub = 0.008, indicating that we have reached the limit of the data scatter (Fig. S3andTable S5).
Discussion
The Nature of In-Cell Encounters.Although the question of how a
given protein senses and moves in the intracellular compartment ofE. colimay at first seem intricate, our results indicate that this process conforms to simplistic physical−chemical rules. Mea-sured by the rotational freedom (Eq.3), the intracellular motions (mobilityin cell) of 127 mutant constructs fall coarsely on a com-mon plane in the protein property space (Fig. 6). The parameters of this property space are, moreover, easy to deduce for any protein with known structure, i.e., the surface net charge density (chargedensity; Eq.5), the surface hydrophilicity (hydrophilicityGuy; Eq. 7), and the charge dipole moment (jjpjj; Eq. 8). Out of these properties, the net charge density is the most decisive (SI Controls), consistent with findings in earlier in-cell NMR studies (38, 46) and the notion that net charge repulsion generically as-sures dispersion of the cellular components (21, 47, 48). The lack of correlation between the intracellular concentration of overex-pressed protein (1.6 ± 0.8 mM; SI Materials and Methods) and mobilityin cell(Fig. S1) indicates further that the dynamic changes are not from self-interactions but stem from quinary interactions with other cytoplasmic components. Because the in-cell mea-surements only report on the specific isotope-labeled construct being overexpressed, however, it is not yet possible to determine which components of the E. colicytoplasm cause the in-cell re-tardation; it could be neighboring soluble proteins, cytoskeleton structures, proteomembrane surfaces, nucleotide material (49), or any species presenting repulsive negative charge and at-tractive surface hydrophobicity. In any case, the overall mor-phology of the bacteria is similar when overexpressing the different proteins (SI ControlsandFig. S3), suggesting that the intracellular environment remains unperturbed. However, it is apparent, from the NMR spectral features, that the underlying quinary encounters are short-lived and diffusive, in agreement with previous observations (5, 37, 38, 50). As the correlations in Fig. 6 concur with the average properties of the mutated proteins, we further conclude that the motions are mainly controlled nonspecifically by diffusive encounters with the
“bulk”cellular background, i.e., the quinary crosstalk (15). By no means does this exclude that the data in Fig. 6 also involve in-cell interactions that rely on the site-specific details of the protein surfaces, but, as yet, these seem to be within the data scatter.
Implications for Functional Optimization and Protein Design.In view
of the rapid divergence of surface composition in protein evo-lution (51), it is interesting that the human HAH1PWT and
SOD1barrel, which are seen to tumble freely in mammalian cells
(31, 52), tend to get stuck in theE. colicytoplasm (Fig. 2). The bacterial protein TTHAPWT, on the other hand, yields high-resolution HMQC spectra in E. coli from the very start (Fig. 2). Whether these differences in cytoplasmic mobility indeed stem from evolutionary divergence, i.e., mammalian proteins are not fit for E. coli, or simply reflect the natural span of in-tracellular mobilities is not yet clear. Even so, it is evident from the ease with which our model proteins can be moved across the
mobility span (Fig. 6) that the quinary crosstalk is readily open to optimization. One conceivable gain of such optimization is in molecular search (12). At one extreme, very long-lived encounter complexes will increase the chance of two functional partners finding their right orientations by Brownian surface diffusion (3), but also slow down the shift to alternative partners when the match is wrong. Encounter complexes that are very swift will conversely allow probing of more putative partners, but with the risk that correct fits are missed by premature dissociation. Re-gardless of what the answer may be, the quinary interactions stand out as a significant part of the intracellular crosstalk and provide also the ever-present background for in vivo function (10). It is further evident from the results in Figs. 2–5 and pre-vious studies (9, 46) that the quinary interactions, despite their complexity, at some level follow simplistic macroscopic rules. As such, the correlations in Fig. 6 not only add physical−chemical detail to the effects of intracellular crowding (4, 12, 27, 53) but also provide a tool for rational protein surface design. Applica-tions can include optimization of target proteins for in-cell NMR detection (54), surface optimization of protein therapeutics (55), and mutational examination of the yet poorly understood re-lation between protein motion, spatial localization, and function (7, 56, 57). The message stands clear and simple to test: Can any protein be tuned to desired rotational motion in E. coli. by mutational tweaking of surface net charge density (Eq.5), sur-face hydrophilicity (Eqs. 6and7), and the electric dipole mo-ment (Eq.8)?
Materials and Methods
Protein Engineering. Mutagenesis, expression, and purification of HAH1, TTHA, SOD1barrel, and their variants were as in refs. 5 and 32, where the
encoding genes were subcloned into the vector pET3a (GenScript) (SI Ma-terials and Methods).
Overexpression and In-Cell NMR Sample Preparation.The proteins (Table S1
andFig. S1) were produced and measured inE. colicells. Before induction,
BL21(DE3)pLysS cells (Thermo Fisher Scientific) were grown overnight at 37 °C in 200 mL of LB. The cells were then harvested and resuspended in M9 medium with labeled 15NH
4Cl as sole nitrogen source, and
over-expression was induced for 4 h (SI Materials and MethodsandFig. S1). The culture was then nondisruptively centrifuged at 800×gfor 8 min to obtain a pellet of intact, viable cells. One gram of this cell pellet was dissolved in 1 mL of M9 buffer, transferred to an NMR tube, and sub-jected to in-cell spectral analysis (SI Materials and Methods). All experi-ments were performed at 37 °C unless otherwise stated.
NMR Spectroscopy.NMR experiments were performed on a Bruker Avance 500- or 700-MHz spectrometer equipped with a triple-resonance cryogeni-cally cooled probe head. In-cell and in vitro spectra were obtained by 1D and 2D 1H-[15N]-band-selective optimized flip-angle short-transient hetero-nuclear multiple quantum coherence (1H-[15N]-SOFAST HMQC) pulse schemes
(58, 59) with 32 scans, 64 increments for the 2D experiment and 1,024 scans for 1D experiment. The relaxation delay was set to 0.2 s, and the acquisition time was to 40 ms. Hydrodynamic radii were determined by pulsed field gradient (PFG) NMR diffusion experiments, where thez-gradient strength was calibrated by the known diffusion coefficient ofα-cyclodextrin and HDO in 99.6% D2O
(60) (SI Materials and Methods).
Mobility Determination on Native Gel.To quantify net charge density, 2μL to 5μL of lysate samples of the various protein variants (Table S1) were loaded on precasted gels (Bio-Rad), with TTHAPWTas references (Rref
f ) and HAH1
PWT
as reference control. For the SOD1barrel variants, we used, additionally,
SOD1barrelfor benchmarking/verification ofRref
f normalization. Running time was 90 min to 210 min, at 125 V and 4 °C, and the running buffer was 25 mM Tris plus 192 mM Glycine at pH 8.3 (SI Materials and Methods).
1. Moreira IS, Fernandes PA, Ramos MJ (2007) Hot spots—A review of the
protein-protein interface determinant amino-acid residues.Proteins68:803–812.
2. Schreiber G, Keating AE (2011) Protein binding specificity versus promiscuity.Curr
Opin Struct Biol21:50–61.
3. Schreiber G, Fersht AR (1996) Rapid, electrostatically assisted association of proteins. Nat Struct Biol3:427–431.
4. Ross JL (2016) The dark matter of biology.Biophys J111:909–916.
5. Danielsson J, et al. (2015) Thermodynamics of protein destabilization in live cells.Proc
Natl Acad Sci USA112:12402–12407.
6. Zarrinpar A, Park SH, Lim WA (2003) Optimization of specificity in a cellular protein
interaction network by negative selection.Nature426:676–680.
7. French JB, et al. (2016) Spatial colocalization and functional link of purinosomes with
mitochondria.Science351:733–737.
8. McGuffee SR, Elcock AH (2010) Diffusion, crowding & protein stability in a dynamic
molecular model of the bacterial cytoplasm.PLOS Comput Biol6:e1000694.
9. Smith AE, Zhou LZ, Gorensek AH, Senske M, Pielak GJ (2016) In-cell thermodynamics
and a new role for protein surfaces.Proc Natl Acad Sci USA113:1725–1730.
10. Bhattacharyya S, et al. (2016) Transient protein-protein interactions perturb E. coli
metabolome and cause gene dosage toxicity.eLife5:e20309.
11. McConkey EH (1982) Molecular evolution, intracellular organization, and the quinary
structure of proteins.Proc Natl Acad Sci USA79:3236–3240.
12. Mika JT, Poolman B (2011) Macromolecule diffusion and confinement in prokaryotic
cells.Curr Opin Biotechnol22:117–126.
13. Dhar A, et al. (2011) Protein stability and folding kinetics in the nucleus and
endo-plasmic reticulum of eucaryotic cells.Biophys J101:421–430.
14. Guo M, Xu Y, Gruebele M (2012) Temperature dependence of protein folding kinetics
in living cells.Proc Natl Acad Sci USA109:17863–17867.
15. Monteith WB, Cohen RD, Smith AE, Guzman-Cisneros E, Pielak GJ (2015) Quinary
structure modulates protein stability in cells. Proc Natl Acad Sci USA 112:
1739–1742.
16. Ignatova Z, et al. (2007) From the test tube to the cell: Exploring the folding and
aggregation of a beta-clam protein.Biopolymers88:157–163.
17. Inomata K, et al. (2009) High-resolution multi-dimensional NMR spectroscopy of
proteins in human cells.Nature458:106–109.
18. Sarkar M, Smith AE, Pielak GJ (2013) Impact of reconstituted cytosol on protein
sta-bility.Proc Natl Acad Sci USA110:19342–19347.
19. Guzman I, Gelman H, Tai J, Gruebele M (2014) The extracellular protein VlsE is
de-stabilized inside cells.J Mol Biol426:11–20.
20. Gitlin I, Carbeck JD, Whitesides GM (2006) Why are proteins charged? Networks of charge-charge interactions in proteins measured by charge ladders and capillary
electrophoresis.Angew Chem Int Ed Engl45:3022–3060.
21. Kurnik M, Hedberg L, Danielsson J, Oliveberg M (2012) Folding without charges.Proc
Natl Acad Sci USA109:5705–5710.
22. Andersson O (2013) Cellular electrolyte metabolism.Encyclopedia of Metalloproteins
(Springer, New York), pp 580–587.
23. Ghaemmaghami S, Oas TG (2001) Quantitative protein stability measurement in vivo. Nat Struct Biol8:879–882.
24. Monteith WB, Pielak GJ (2014) Residue level quantification of protein stability in
living cells.Proc Natl Acad Sci USA111:11335–11340.
25. Dhar A, Ebbinghaus S, Shen Z, Mishra T, Gruebele M (2010) The diffusion coefficient
for PGK folding in eukaryotic cells.Biophys J99:L69–L71.
26. Smith AE, Zhang Z, Pielak GJ, Li C (2015) NMR studies of protein folding and binding
in cells and cell-like environments.Curr Opin Struct Biol30:7–16.
27. Rivas G, Minton AP (2016) Macromolecular crowding in vitro, in vivo, and in between. Trends Biochem Sci41:970–981.
28. Sakakibara D, et al. (2009) Protein structure determination in living cells by in-cell
NMR spectroscopy.Nature458:102–105.
29. Anastassopoulou I, et al. (2004) Solution structure of the apo and copper(I)-loaded
human metallochaperone HAH1.Biochemistry43:13046–13053.
30. Danielsson J, et al. (2013) Global structural motions from the strain of a single
hy-drogen bond.Proc Natl Acad Sci USA110:3829–3834.
31. Danielsson J, et al. (2013) Pruning the ALS-associated protein SOD1 for in-cell NMR. J Am Chem Soc135:10266–10269.
32. Danielsson J, Kurnik M, Lang L, Oliveberg M (2011) Cutting off functional loops from
homodimeric enzyme superoxide dismutase 1 (SOD1) leaves monomericβ-barrels.
J Biol Chem286:33070–33083.
33. Halle B, Wennerström H (1981) Interpretation of magnetic resonance data from
water nuclei in heterogeneous systems.J Chem Phys75:1928–1943.
34. Lipari G, Szabo A (1982) Model-free approach to the interpretation of nuclear magnetic-resonance relaxation in macromolecules. 2. Analysis of experimental
re-sults.J Am Chem Soc104:4559–4570.
35. Lipari G, Szabo A (1982) Model-free approach to the interpretation of nuclear magnetic-resonance relaxation in macromolecules. 1. Theory and range of validity. J Am Chem Soc104:4546–4559.
36. Lee AL, Wand AJ (1999) Assessing potential bias in the determination of rotational
correlation times of proteins by NMR relaxation.J Biomol NMR13:101–112.
37. Wang Q, Zhuravleva A, Gierasch LM (2011) Exploring weak, transient protein−protein
interactions in crowded in vivo environments by in-cell nuclear magnetic resonance
spectroscopy.Biochemistry50:9225–9236.
38. Barbieri L, Luchinat E, Banci L (2015) Protein interaction patterns in different cellular
environments are revealed by in-cell NMR.Sci Rep5:14456.
39. Oliveberg M, Arcus VL, Fersht AR (1995) pKA values of carboxyl groups in the native and denatured states of barnase: The pKA values of the denatured state are on
av-erage 0.4 units lower than those of model compounds.Biochemistry34:9424–9433.
40. Cantor CR, Schimmel PR (1980)Biophysical Chemistry, Part 2: Techniques for the Study
of Biological Structure and Function(W. H. Freeman, New York).
41. Teague SJ (2003) Implications of protein flexibility for drug discovery.Nat Rev Drug
Discov2:527–541.
42. Tsao D, Diatchenko L, Dokholyan NV (2011) Structural mechanism of S-adenosyl
methionine binding to catechol O-methyltransferase.PLoS One6:e24287.
43. Guy HR (1985) Amino acid side-chain partition energies and distribution of residues in
soluble proteins.Biophys J47:61–70.
44. Ferreiro DU, Komives EA, Wolynes PG (2014) Frustration in biomolecules.Q Rev
Biophys47:285–363.
45. Antosiewicz J (1995) Computation of the dipole moments of proteins.Biophys J69:
1344–1354.
46. Cohen RD, Pielak GJ (2016) Electrostatic contributions to protein quinary structure. J Am Chem Soc138:13139–13142.
47. Lang L, Kurnik M, Danielsson J, Oliveberg M (2012) Fibrillation precursor of
super-oxide dismutase 1 revealed by gradual tuning of the protein-folding equilibrium.Proc
Natl Acad Sci USA109:17868–17873.
48. Vendruscolo M, Dobson CM (2007) Chemical biology: More charges against
aggre-gation.Nature449:555.
49. Frembgen-Kesner T, Elcock AH (2013) Computer simulations of the bacterial
cyto-plasm.Biophys Rev5:109–119.
50. Luh LM, et al. (2013) Molecular crowding drives active Pin1 into nonspecific
com-plexes with endogenous proteins prior to substrate recognition.J Am Chem Soc135:
13796–13803.
51. Sasidharan R, Chothia C (2007) The selection of acceptable protein mutations.Proc
Natl Acad Sci USA104:10080–10085.
52. Banci L, et al. (2013) Atomic-resolution monitoring of protein maturation in live
human cells by NMR.Nat Chem Biol9:297–299.
53. Gnutt D, Ebbinghaus S (2016) The macromolecular crowding effect−From in vitro into
the cell.Biol Chem397:37–44.
54. Freedberg DI, Selenko P (2014) Live cell NMR.Annu Rev Biophys43:171–192.
55. Leader B, Baca QJ, Golan DE (2008) Protein therapeutics: A summary and
pharma-cological classification.Nat Rev Drug Discov7:21–39.
56. Wirth AJ, Gruebele M (2013) Quinary protein structure and the consequences of
crowding in living cells: Leaving the test-tube behind.BioEssays35:984–993.
57. Srere PA (2000) Macromolecular interactions: Tracing the roots.Trends Biochem Sci
25:150–153.
58. Schanda P, Brutscher B (2005) Very fast two-dimensional NMR spectroscopy for
real-time investigation of dynamic events in proteins on the real-time scale of seconds.J Am
Chem Soc127:8014–8015.
59. Schanda P, Kupce E, Brutscher B (2005) SOFAST-HMQC experiments for recording two-dimensional heteronuclear correlation spectra of proteins within a few seconds. J Biomol NMR33:199–211.
60. Danielsson J, Jarvet J, Damberg P, Gräslund A (2004) Two-site binding of beta-cyclodextrin to the Alzheimer Abeta(1-40) peptide measured with combined
PFG-NMR diffusion and induced chemical shifts.Biochemistry43:6261–6269.
61. Sezonov G, Joseleau-Petit D, D’Ari R (2007)Escherichia coliphysiology in Luria-Bertani
broth.J Bacteriol189:8746–8749.
62. Kubitschek HE, Friske JA (1986) Determination of bacterial cell volume with the
Coulter Counter.J Bacteriol168:1466–1467.
63. Lindberg MJ, Normark J, Holmgren A, Oliveberg M (2004) Folding of human super-oxide dismutase: Disulfide reduction prevents dimerization and produces marginally
stable monomers.Proc Natl Acad Sci USA101:15893–15898.
64. Nordlund A, Oliveberg M (2006) Folding of Cu/Zn superoxide dismutase suggests structural hotspots for gain of neurotoxic function in ALS: Parallels to precursors in
amyloid disease.Proc Natl Acad Sci USA103:10218–10223.
65. Fersht AR (1995) Optimization of rates of protein folding: The nucleation−condensation
mechanism and its implications.Proc Natl Acad Sci USA92:10869–10873.
66. Damberg P, Jarvet J, Gräslund A (2001) Accurate measurement of translational
dif-fusion coefficients: A practical method to account for nonlinear gradients.J Magn
Reson148:343–348.
67. Cavallo L, Kleinjung J, Fraternali F (2003) POPS: A fast algorithm for solvent
ac-cessible surface areas at atomic and residue level. Nucleic Acids Res 31:
3364–3366.
68. Yin S, Ding F, Dokholyan NV (2007) Eris: An automated estimator of protein stability. Nat Methods4:466–467.
69. Yin S, Ding F, Dokholyan NV (2007) Modeling backbone flexibility improves protein
stability estimation.Structure15:1567–1576.
70. Ding F, Dokholyan NV (2006) Emergence of protein fold families through rational
design.PLOS Comput Biol2:e85.
71. Ding F, Yin S, Dokholyan NV (2010) Rapid flexible docking using a stochastic rotamer
library of ligands.J Chem Inf Model50:1623–1632.
72. Abolliel AA, Zedan H (2015) Synthesis, cloning and expression of a novel
pre-miniproinsulin analogue gene inEscherichia coli.J Adv Res6:663–671.
73. Tai J, Dave K, Hahn V, Guzman I, Gruebele M (2016) Subcellular modulation of
pro-tein VlsE stability and folding kinetics.FEBS Lett590:1409–1416.
74. Matsuo H, et al. (1999) Identification by NMR spectroscopy of residues at contact surfaces
in large, slowly exchanging macromolecular complexes.J Am Chem Soc121:9903–9904.
75. Cornett JB, Shockman GD (1978) Cellular lysis ofStreptococcus faecalisinduced with
triton X-100.J Bacteriol135:153–160.
76. Smith PK, et al. (1985) Measurement of protein using bicinchoninic acid. Anal
Biochem150:76–85.
77. Zimmerman SB, Trach SO (1991) Estimation of macromolecule concentrations and
ex-cluded volume effects for the cytoplasm ofEscherichia coli.J Mol Biol222:599–620.
78. Bring J (1994) How to standardize regression-coefficients.Am Stat48:209–213.