SPATIOTEMPORAL RESPONSE DYNAMICS OF CORTICAL NEURON POPULATIONS IN RAT SOMATOSENSORY CORTEX
Andrew P. Brna
A dissertation submitted to the faculty at the University of North Carolina at Chapel Hill in partial fulfillment of the requirements for the degree of Doctor of Philosophy in the
Department of Biomedical Engineering (Neuroscience).
Chapel Hill 2017
iii
ABSTRACT
Andrew P. Brna: Spatiotemporal Response Dynamics of Cortical Neuron Populations in Rat Somatosensory Cortex
(Under the direction of Oleg Favorov)
Sensory testing offers sensitive means of assessing brain health. In particular,
spatiotemporal patterns of vibrotactile stimulation of fingertips have been shown in to be highly effective in probing cerebral cortical machinery involved in perception and detecting its
abnormalities in a variety of neurological disorders.
In this study, extracellular spike discharge activity was recorded in microelectrode
iv
through adaptation, decreasing the relative difference between the adjacent macrocolumns despite contrast-enhancing inhibition. Meanwhile, application of a low-amplitude conditioning stimulus to both digits prior to two-digit test stimulation increases the relative difference in the responses of the two macrocolumns. Finally, a slowly ramping stimulus from subthreshold to suprathreshold amplitudes evokes slow feed-forward inhibition and decreases the overall activity of the responding macrocolumn. All these cortical behaviors well parallel perceptual effects of the same stimulus permutations reported by human subjects.
v
TABLE OF CONTENTS
LIST OF FIGURES ... vii
LIST OF ABBREVIATIONS ... ix
INTRODUCTION ... 1
CHAPTER 1: EXPERIMENTAL DESIGN AND METHODS ... 6
Section 1.1 - Cortical Responses and Dynamics Under Study ... 7
Section 1.2 - The Rat Model and the Forepaw Barrel Subfield ... 10
Section 1.3 - Subject Preparation ... 11
Section 1.4 - Extracellular Recordings and Stimulus Protocols ... 13
CHAPTER 2: CORTICAL REPRESENTATION OF STIMULUS AMPLITUDE ... 20
Section 2.1 - Response to Stimulation ... 21
Section 2.2 - Representation of Amplitude ... 24
Section 2.3 - Response in Adjacent Cortical Region ... 26
Section 2.4 - Implications for Perception of Amplitude ... 29
CHAPTER 3: RESPONSES TO SIMULTANEOUS TWO-DIGIT STIMULATION ... 38
Section 3.1 - Single vs. Two-Digit Stimulation ... 39
Section 3.2 - Effects of Single-Site Conditioning ... 45
Section 3.3 - Effects of Dual-Site Conditioning ... 47
Section 3.4 - Impact of Conditioning on Amplitude Discrimination ... 51
CHAPTER 4: REDUCTION OF CORTICAL ACTIVITY THROUGH DYNAMIC STIMULATION ... 59
vi
Section 4.2 - Cortical Response to Ramping Stimulation ... 61
Section 4.3 - Impact of Feed-Forward Inhibition on Perception ... 65
CONCLUSIONS ... 69
vii
LIST OF FIGURES
Figure 1.1: Examined Response Dynamics ... 7
Figure 1.2: Digit Platform and Stimulus Probe Setup ... 14
Figure 1.3: Stimulus Protocols ... 16
Figure 2.1: Average Neuron Response to Stimulation of Different Amplitudes ... 22
Figure 2.2: Average Neuron Response per Stimulus Cycle ... 23
Figure 2.3: Average Neuron Response to Stimulation at Adjacent Digit ... 27
Figure 2.4: Distribution of Responses with Low-Amplitude Stimulation ... 31
Figure 2.5: Combined Macrocolumn Responses at Suprathreshold Amplitudes ... 34
Figure 2.6: Representation of Stimulus Amplitude at Cortical Level... 36
Figure 3.1: Macrocolumn Responses to Stimulation at 1 or 2 Digits ... 40
Figure 3.2: Marginal Macrocolumn Response to Principal Digit and Two-Digit Stimulation ... 42
Figure 3.3: Digit Macrocolumn Responses to Two-Digit Stimulation ... 43
Figure 3.4: Principal Macrocolumn Response Following Single-Site Conditioning ... 45
Figure 3.5: Principal Macrocolumn Response Following Dual-Site Conditioning... 47
Figure 3.6: Digit Macrocolumn Responses Following Dual-Site Adaptation ... 50
Figure 3.7: Time Courses as Source of Amplitude Discrimination Performance ... 51
Figure 3.8: Macrocolumn Comparisons for Amplitude Discrimination ... 53
Figure 4.1: Average Neuron Response with Ramping Stimulation ... 62
viii
ix
LIST OF ABBREVIATIONS
AD amplitude discrimination DSc dual-site conditioning FBS forepaw barrel subfield FFI feed-forward inhibition KS Kolmogorov–Smirnov MFR mean firing rate NGF neurogliaform OIS optical intrinsic signal OMFR overall mean firing rate QST quantitative sensory testing RF receptive field
1
INTRODUCTION
Early analyses of patient pain were qualitative in nature, commonly involving patient self-reporting of symptoms. Such tests were poorly defined, not directly comparable among patients, and arguably unreliable; this made them difficult to use in medicine and unhelpful in research. The need to create standards for comparison and to improve repeatability in the field of pain lead to the development of quantitative sensory testing (QST) for better diagnosis and monitoring (for review, see Roldan and Abdi, 2015). QST is a research technique involving the application of known stimuli at the periphery and the recording of one or more resulting metrics. The metrics produced by QST have measured numerical values, rather than self-reported descriptions, and they are reflective of aspects of nervous system function and health.
Through QST, pain became quantifiable, and diagnosis and monitoring could be done by comparing recorded metrics to known, standard values. However, the types of stimuli utilized in early QST tests could only probe the peripheral nervous system and spinal cord, and QST metrics were limited to quantifying pain. In recent years the use of QST has spread beyond pain and into touch, and new testing protocols have allowed for the quantification of cortical function as well (Tommerdahl et al., 2010; Verberne et al., 2013).
2
metric under observation (e.g. Tannan et al., 2007; Zhang et al., 2011b; Puts et al., 2013; Nguyen et al., 2013a).
Different metrics can be recorded using QST testing by varying the testing pattern or adding a confounding element to the stimuli. Three metrics commonly collected are reaction time,
amplitude discrimination, and dynamic threshold; each is captured using a different testing paradigm. Reaction time is the simplest of these, measuring the amount of time between the application of a stimulus to one fingertip, or digit, and the subject's perception thereof as indicated by a voluntary action, such as clicking a button (Zhang et al., 2011b). Amplitude discrimination uses a more complex protocol, applying two stimuli of different amplitudes to two different digits and asking the subject to choose which stimulus felt stronger (Tannan et al., 2007). The metric recorded is the minimal amplitude difference between the stimuli at which the subject can accurately
complete the test. Altering the duration of one or both stimuli will change the metric's value in a healthy subject. Lastly, dynamic threshold is itself is a variant of static threshold (Zhang et al., 2011b). The static threshold metric is the weakest stimulus a subject can reliably detect as determined over the course of multiple tests, each using a unique stimulus of unchanging amplitude. In comparison, dynamic threshold instead slowly ramps up a single stimulus, and the amplitude at which the subject detects the stimulus is recorded as the metric.
3
al., 2013), type 2 diabetes (Favorov et al., 2017), and mild traumatic brain injury (mTBI)/concussion (Tommerdahl et al., 2016) are just a few of the cortical developments, injuries, and disorders that have been studied using QST techniques, and the list is ever-expanding. QST metrics of certain populations have even been shown to change over the course of treatment; in mTBI studies, the return of affected QST metrics to baseline correlated well with patient recovery (Ketcham et al., 2014). These results support the use of QST metrics as both diagnostic and monitoring tools for cortical dysfunction.
QST metrics are able to identify and monitor cortical dysfunction because they are reflective of the operation and dynamics of the cortex's underlying machinery (Tommerdahl et al., 2010). The function of the cortex is reliant on numerous mechanisms that operate within local neuronal populations, and those mechanisms are shared across the cerebral neocortex. If the base mechanism of a cortical dynamic effect is changed, the effect would be compounded through repetition, resulting in a system-level disorder. Therefore, QST metrics are able to identify atypical developments, injuries, and disorders because those conditions disrupt the mechanisms of local neuron populations that QST metrics are specifically designed to examine (Tommerdahl et al., 2010). By examining QST results, it is possible to non-invasively probe the nervous system and discern which cortical mechanisms are affected and to what degree.
4
In comparison, amplitude discrimination examines adaptation, lateral inhibition, and the funneling phenomenon among cortical neurons (Simons et al., 2007). Funneling is a spatiotemporal phenomenon wherein the initial, broad response seen in a population of neurons narrows with extended stimulation, likely due to the effects of activity-driven lateral inhibition on the edges of the response (Tommerdahl et al., 2010). When a vibrotactile stimulus is first applied, the majority of neurons within linked to the stimulated region become activated, but as time passes, only those neurons most strongly activated by the stimulus continue firing, though through adaptation their activity progressively falls (Whitsel et al., 2003). Meanwhile, the activity of surrounding neurons drops even further due to lateral connections among them, increasing spatial contrast (Simons et al., 2007). Increasing the duration of the stimuli allows more inhibition to occur, which functionally isolates the two applied stimuli and improves discriminative ability (Tannan et al., 2007). If lateral inhibition or adaptation do not function as expected, the QST metric will deviate from expected values (e.g. Tannan et al., 2008; Tommerdahl et al., 2016).
Dynamic threshold tests examine the feed-forward inhibition (FFI) mechanism, which affects a subject's ability to perceive a given stimulus (Zhang et al., 2011b). FFI is a temporal phenomenon wherein the same drive from the periphery that causes excitation in cortical neurons will also promote their suppression through more sensitive inhibitory neurons (Miller et al., 2001). Compared to a static threshold test where a supra-threshold stimulus causes immediate firing of neurons in somatosensory regions at levels promoting perception, the slow ramping stimulus in a dynamic threshold test likely diminishes initial neuron firing (Zhang et al., 2011b). With the ramping stimulus, a higher amplitude of stimulation is required to produce the same firing rate. The dynamic threshold metric is able to recognize changes in this effect (e.g. Favorov et al., 2017).
5
the effects of amplitude discrimination and dynamic threshold stimuli on local neuron populations will be characterized in healthy rat populations. This work will better define the basis for QST metrics and provide valuable insights into the cortical mechanisms that drive them.
Sprague Dawley rats were used as the primary animal model for these studies. The primary somatosensory cortex (SI) in rats is organized as a set of well-defined units referred to as barrels. As described above, the testing protocols to be used here involve the stimulation of one or more digits, and in rats there exists a single barrel, or macrocolumn, that processes afferent inputs from a given digit tip (Waters et al., 1995). Having one region of cortex that services a single digit, as opposed to multiple regions, allowed for easier interpretation of the effects of digit stimulation and aided in region identification during testing. This allowed for simpler data collection, more meaningful processing, and improved reproduction of results across multiple subjects.
The research detailed in this work examines the spatiotemporal response dynamics of cortical neurons with the intent of understanding the operation of the mechanics that drive them. These mechanics ultimately power our ability to perceive our environment, and by quantifying their typical effects on cortical activity, we can better identify and characterize atypical operations. The results and analyses presented here will lead to more informative diagnoses and better
6
CHAPTER 1: EXPERIMENTAL DESIGN AND METHODS
Numerous human perceptual studies have shown that the perceptions of certain stimuli can have different properties from those actually applied (e.g., Tannan et al., 2007; Zhang et al., 2011b), suggesting that the cortex transforms the raw information from skin mechanoreceptors before conscious perception actually occurs. Extracellular recordings and optical intrinsic imaging studies using simple, single-digit stimulus patterns confirmed that activity in SI does not perfectly reflect applied stimuli, and it instead generates dynamics with spatial and temporal components that alter stimulus cortical representations (Whitsel et al., 2003; Simons et al., 2007; for review, see
Tommerdahl et al., 2010).
Interestingly, applied stimuli with characteristics specifically designed to exploit such dynamics have been shown to produce altered percepts in populations with underlying cortical dysfunction, including but not limited to those with neurodevelopmental disorders (Tannan et al., 2008, Tavassoli et al., 2016), hypersensitivity and chronic pain (Zhang et al., 2011a; Nguyen et al., 2013c), pharmacological manipulation (Folger et al., 2008; Nguyen et al., 2013b), and cortical injury (Tommerdahl et al., 2016). However, while earlier studies did confirm the existence of certain cortical dynamics, the stimuli used were simple; to date, no research has directly examined the cortical effects of such stimulus patterns sensitive to changes in the cortical mechanisms that result in atypical function.
7
digits, this study quantified changes in cortical activity evoked by standardized vibrotactile stimulation in a healthy population. The information collected and analyzed in this study forms baseline dataset against which similar data collected in disordered populations can be compared, thus guiding the study into the cortical mechanisms disrupted within such populations.
This first chapter discusses the specific spatiotemporal dynamics examined in subsequent chapters. Additionally, the steps followed to collect the data analyzed are explained to allow for subsequent repetition, and systematic alteration, of the testing procedure in future studies such as those previously suggested.
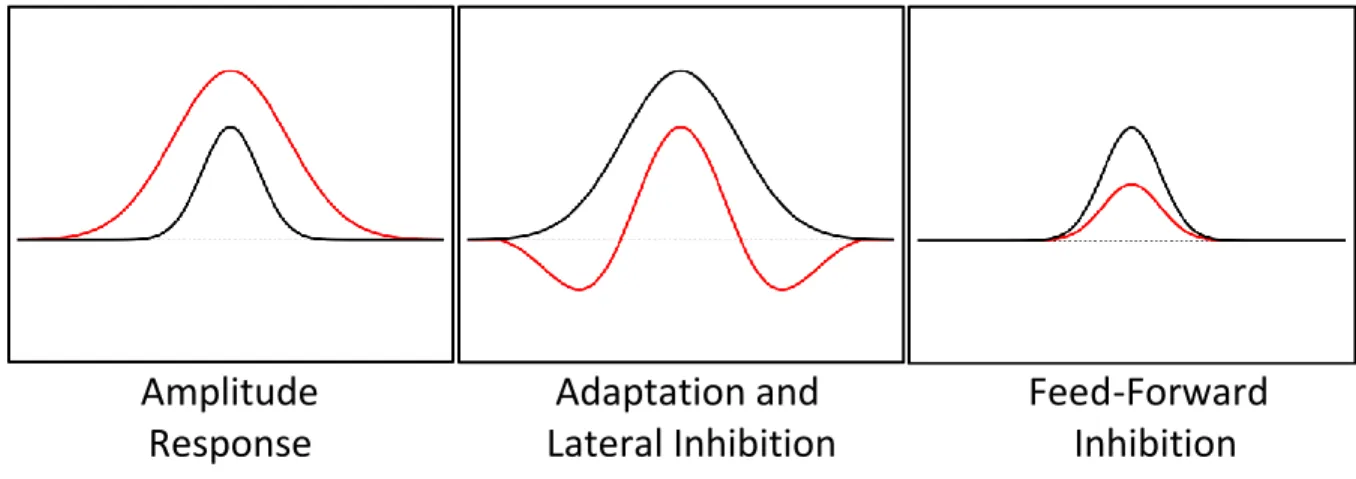
Section 1.1 - Cortical Responses and Dynamics Under Study
Amplitude Adaptation and Feed-Forward
Response
Lateral Inhibition Inhibition
Figure 1.1: Examined Response Dynamics
8
represents the relative zero point, or background activity. Each region of the skin projects to one or more characteristic cortical modules or functional units in SI in accordance with somatotopy
(Favorov and Diamond, 1990), and indirect optical intrinsic signal imaging studies have suggested that stimuli of increasing amplitudes will activate those only modules, with the overall levels of activity in those modules increasing accordingly (Simons et al., 2005). However, optical studies examining the time courses of cortical stimulus-evoked activity suggested that during early times of stimulation, a larger portion of the cortex than that representing the stimulated region becomes active, and with increased stimulus duration the activated region condenses, or "funnels" down to the final, originally-predicted region (Simons et al., 2007). Chapter 2 examines the effects of stimulus amplitude on the cortical response in adjacent cortical regions, including both the region corresponding directly with a single stimulated digit as well as that of an adjacent, non-stimulated digit, and the results therein support the existence of the initial spread of a funneling response.
functionally-9
adjacent regions with extended stimulation. Lateral inhibition is believed to be a
contrast-enhancing mechanism, increasing the difference in cortical representation to stimuli applied at more than one location. Chapter 3 examines the effects of simultaneous stimulation at two functionally-related skin sites, and it compares the results of such tests to those with different types of
conditioning stimuli. The stimulation of two skin sites simultaneously probes the lateral inhibition or funneling dynamics, while the conditioning stimuli apply adaptation on top of additional funneling. The results of that chapter support the theory that different conditioning stimuli can alter the contrast between different cortical regions, thus likely changing the relative perceptions of subsequent, simultaneously-applied stimuli.
10
Section 1.2 - The Rat Model and the Forepaw Barrel Subfield
The rat somatosensory cortex is uniquely suited for the systematic study of spatiotemporal response dynamics by virtue of its organization. It is generally believed that the somatosensory cortex is arranged as a mosaic of repeating units (Favorov and Whitsel, 1988; Favorov and Diamond, 1990). These units, referred to as macrocolumns or segregates, comprise 300-400 μm-diameter clusters of vertically-oriented strands of cells with similar receptive field (RF) and sensory modality properties (Favorov and Diamond, 1990). It has been theorized that macrocolumns form the basic processing unit of the cortex (Mountcastle, 1978); as macrocolumns have been shown in modeling studies to be capable of complicated, non-linear transformations and learning (Favorov and Kursun, 2011), it is likely that macrocolumns in the somatosensory cortex perform first-stage processing of afferent information.
In larger animals such as monkeys (Powel and Mountcastle, 1959; Favorov and Whitsel, 1988) and cats (Mountcastle, 1957; Favorov and Diamond, 1990), the cortical representation of a single digit of the forelimb is known to be spread over multiple macrocolumns. All the cells within a macrocolumn share a common RF location on the skin, called the minimal RF, and the minimal RFs of adjacent macrocolumns have been shown to be non-overlapping and non-contiguous. Different parts of a single digit are primarily serviced by different macrocolumns. Such an arrangement of macrocolumns is not conducive to extracellular recordings to standardized stimuli. Stimulation of a single digit would likely activate cells in different macrocolumns in a way not immediately
reproducible between subjects, and the levels of activation would be unpredictable based on the exact location of the stimulus on the skin relative to any given recording site's minimal RF.
11
clusters, or barrels (Waters et al., 1995). Within this region, called the forepaw barrel subfield, each barrel has a minimal RF corresponding to a single glabrous pad upon the contralateral forepaw; in turn each glabrous pad is largely represented by only a single barrel. Additionally, the barrels corresponding to the digit tips are physically adjacent to one another in a line. Descriptions of the properties of rat cortical barrels match those of macrocolumns in other species, so it is highly likely that they are the same cortical structure.
This study aimed to examine the spatiotemporal response dynamics of one or more adjacent macrocolumns, and for that purpose the rat model is ideal. In comparison to other mammalian studies, using a rat model would improve reproducibility, allowing the same two macrocolumns to be studied across subjects using minimal RFs as guides. Also, stimulation at a single digit would likely produce a reliable, comparatively uniform response in the innervated macrocolumn, since each macrocolumn represents an entire glabrous pad, rather than just a component. In this study, stimulation was applied to the glabrous pads of digits 2 and 3, as both digits would have macrocolumns corresponding to adjacent digits nearby (as opposed to other, less functionally comparable regions).
Section 1.3 - Subject Preparation
All animal handling and surgical and experimental procedures performed here were reviewed and approved by an institutional committee prior to initiation of the research study.
12
in 50/50 nitrous oxide and oxygen for the duration of surgery, and the animal was allowed to breathe naturally. Heart rate, breathing rate, and body temperature were monitored and recorded (Kent Scientific PhysioSuite®). After intubation, surgical access points were coated with local anesthetic and sutured shut.
Next, the right side of the skull was exposed, and a rectangular window was sketched onto the surface of the bone. The window was marked 2mm anterior and posterior to the coronal suture and from 1mm lateral to the sagittal suture to the edge of the skull. The majority of material in the top, left, and bottom edges of the window was triturated using a rotary tool (diamond tip, 1mm diameter); an additional edge was made by triturating a line approximately 1mm down off the right side of the skull in a shelf-like fashion. This window was not removed at this stage of the surgery.
During the electrophysiological phase of the experiment, the subject was held in place using a unique recording chamber attached to the skull. The recording chamber was designed with a circular lip at the top that could be locked into the recording setup, and the inside of the chamber tapered from 20 mm at the top to 12.5 mm at the bottom where it made contact with the skull. The chamber was bonded to the skull using dental acrylic, but as the bottom diameter of the chamber was wider than the side of the skull exposed, additional semi-rigid dental acrylic was applied to the side of the skull below the right edge of the window and allowed to dry to form an additional anchor point. When fully applied, the recording chamber was centered on the (unopened) window and was watertight at the bottom.
13
platform where the recording chamber was locked into the recording setup and aligned appropriately along an anterior-posterior axis.
Finally, the remainder of the window was removed, and in some experiments the dura was resected. Artificial cerebrospinal fluid was added to the recording chamber to keep the cortex moist, and images of the cortex were taken for anatomical reference. After this,
electrophysiological data were collected as described below utilizing vibrotactile stimulation of the contralateral forepaw. Upon commencement of data collection, isoflurane levels were adjusted to minimal levels that would sustain general anesthesia (usually 0.3-0.6%). Following data collection, the subject was euthanized with 5% isoflurane and opening of the chest cavity.
Section 1.4 - Extracellular Recordings and Stimulus Protocols
Extracellular recordings were made in the forepaw barrel subfield of the right somatosensory cortex in response to stimulation of the contralateral forepaw. A tungsten microelectrode (FHC, Inc.) was inserted into the cortex at a near-radial orientation using an electrode driver, and extracellular cortical action potentials ("spikes") were monitored using external speakers connected to recording equipment and graphic display. Extracellular spikes were conditioned and amplified through first-stage multi-channel recording equipment (Alpha Omega MCP-Plus 8), and resulting analog signals were viewed and saved for post-processing through second-stage recording equipment (Alpha Omega AlphaLab Pro). The recording setup was controlled through a dedicated lab computer, and the data were sampled and saved at 25 kHz.
14
test subjects. On average, 4-5 neurons could be discerned at each recording site, for an estimated total of 176 observed neurons.
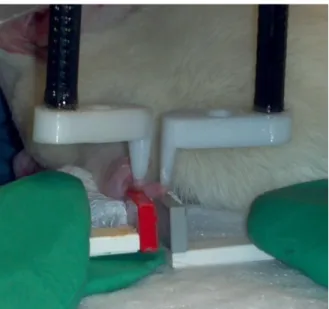
Figure 1.2: Digit Platform and Stimulus Probe Setup
At each potential recording site, the minimal receptive field of the neurons within that site was determined through the use of punctuate stimuli delivered using von Frey filaments of
progressively decreasing forces, according to procedures described in earlier work (Favorov et al., 1987; Favorov and Diamond, 1990). When a recording site was found whose minimal RFs
15
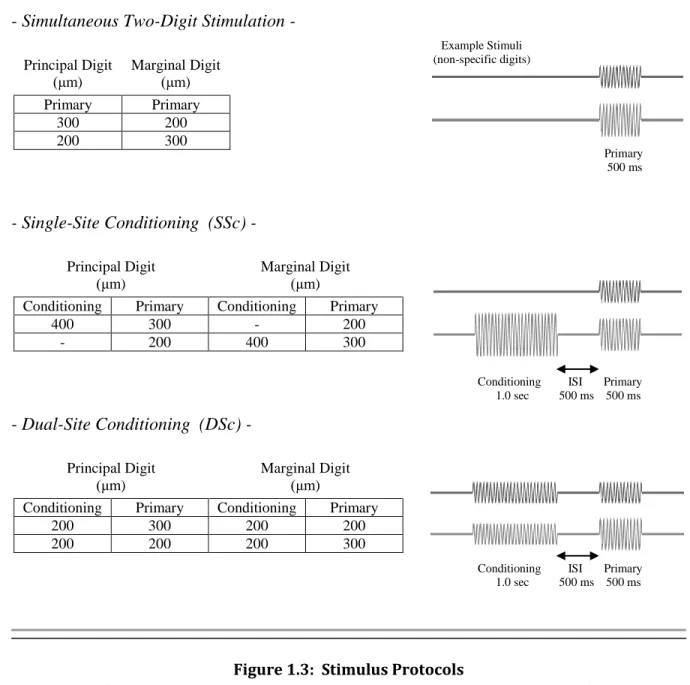
The glabrous pads at the tips of digits 2 and 3 were exposed to a total of 15 sinusoidal skin vibration patterns shown in Fig. 1.3 using separate, custom, computer-controlled vibrotactile mechanical stimulators (Cortical Metrics CM-4), and the coincident cortical activity was recorded. The frequency of all applied stimuli was 25 Hz, within the flutter range of perception (<50Hz). The stimulators were controlled using custom MATLAB (Mathworks) scripts and monitored and recorded post-experiment trial identification using additional channels of the microelectrode recording equipment. Similarly to the digit platforms, the stimulator probes were mounted on separate boom arms and were not allowed into contact during recording to prevent mechanical signal
transmittance between the digits, as shown in Fig. 1.2. Probe tips were 2 mm in diameter, covering stimulated digit pads almost completely, and prior to application of stimulus patterns they were indented 500 μm into the skin to ensure good contact.
The 15 stimulus patterns applied to the digit tips, shown in Fig. 1.3 in sequence, were modeled after stimuli used in human perceptual studies as described in earlier parts of this chapter. Any given stimulus pattern included vibrotactile stimulation of one or two digits with the potential for a conditioning or 2-stage stimuli separated by a short period. As a general rule, the primary stimulus was the portion recorded, with other stimulus instances not being processed but instead being necessary to evoke the desired spatiotemporal dynamics. Stimuli applied included
simultaneous two-digit stimulation, two-digit stimulation with single and dual-site conditioning (SSc and DSc, respectively), 1-and-2-stage single-digit stimulation, and ramping stimulation. The
16
- Simultaneous Two-Digit Stimulation -
Principal Digit (μm)
Marginal Digit (μm) Primary Primary
300 200
200 300
- Single-Site Conditioning (SSc) -
Principal Digit (μm)
Marginal Digit (μm)
Conditioning Primary Conditioning Primary
400 300 - 200
- 200 400 300
- Dual-Site Conditioning (DSc) -
Principal Digit (μm)
Marginal Digit (μm)
Conditioning Primary Conditioning Primary
200 300 200 200
200 200 200 300
Figure 1.3: Stimulus Protocols
(All amplitudes in μm, peak-to-peak. All stimuli were applied at 25 Hz.)
(cont.->) Example Stimuli (non-specific digits) Primary 500 ms ISI
Conditioning ISI Primary 1.0 sec 500 ms 500 ms ISI
17
- 2-Stage Single-Digit Stimulation -
Principal Digit (μm)
Marginal Digit (μm)
Primary Secondary Primary Secondary
300 - - 200
200 - - 300
- 300 200 -
- 200 300 -
- 1-Stage Single-Digit Stimulation -
Principal Digit (μm) Primary 12.5 25 50 75
- Ramping Stimulation -
Principal Digit (μm)
Primary 0 -> 80
Figure 1.3 (cont)
(All amplitudes in μm, peak-to-peak. All stimuli were applied at 25 Hz.)
Primary ISI Secondary 500 ms 500 ms 500 ms ISI
Primary 200 ms ISI
Primary 2 μm / sec ramp
18
Note that 2-stage single-digit stimulation applied stimuli to digit 2 and digit 3 in sequence, but as this study did not utilize information from during the Secondary period, the Primary stage of 2-stage single-digit stimulation should be considered equivalent to 1-stage (henceforth, both will be referred to as digit stimulation). Information from the secondary period of 2-stage single-digit stimulation will be used in subsequent studies regarding sequential amplitude discrimination. Additionally, the conditioning period in SSc was utilized as another example of single-digit
stimulation, as the conditions of stimulation were comparable.
For a single recording site, the 15 trial patterns were applied to the digit tips 15 times, for a total of 225 trials per recording site, 15 trials per stimulus pattern. The entire battery took
approximately 45 minutes, at which point a new recording site would be sought out. The data recorded during the trials were processed off-line using custom MATLAB scripts, wherein spikes were detected for 3 seconds before and after each trial. The spike detection algorithm used a slope-filter to isolate action potentials, and the timings of peaks/valleys in the recorded data with a magnitudes greater than a threshold value were recorded as spike events. To prevent the recognition of a single neuron firing twice, the larger of two spikes observed within a set period (0.57 ms) was recorded and the other discarded. Within a single recording site, the spike events were grouped in bins of varying lengths and averaged by the number of trials captured for a given stimulus pattern. These site results were then averaged with other recording sites, smoothed, and scaled by the average number of neurons per recording site. For the purposes of data analysis, recordings made in digit 2 and digit 3 recording sites were considered equivalent. Only recording sites in which a full 15 trials were obtained for a given stimulus pattern were used in data analysis.
Due to limitations in the setup used, the activity of multiple macrocolumns could not be recorded simultaneously. Instead, to reconstruct the simultaneous responses of adjacent
19
20
CHAPTER 2: CORTICAL REPRESENTATION OF STIMULUS AMPLITUDE
Neurons in the primary somatosensory cortex (SI), the lowest level of the cortex dedicated to processing tactile sensation, receive input from the periphery through primary afferent fibers. Displaying a firing pattern that is largely independent of stimulus amplitude, these primary afferent neurons, connected directly to mechanoreceptors in the skin, are not capable of conveying the amplitude of an applied stimulus individually (Talbot et al., 1968), though they do so through an aggregate response (Johnson, 1974; LaMotte and Mountcastle, 1975). As the amplitude of a vibrotactile stimulus can be readily perceived and determined in a continuous manner (Stevens, 1959; Talbot et al., 1968), it stands to reason that neurons at the cortical level must be able to coalesce such individual signals into a singular response from which amplitude can be discerned.21
Section 2.1 - Response to Stimulation
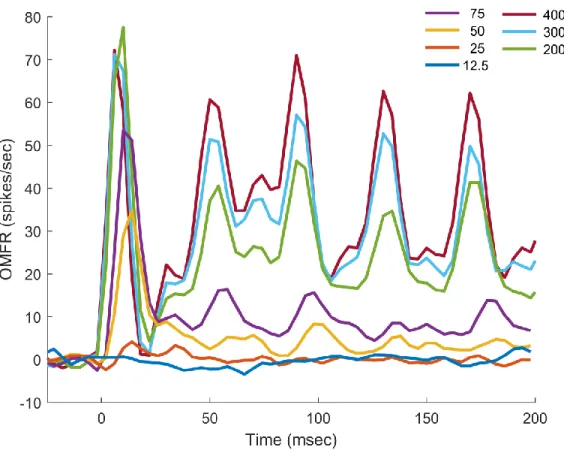
To test the effects of stimulus amplitude on SI cortical activity, a series of vibrotactile stimuli ranging from 12.5μm to 400μm were delivered to a single digit ("single-digit stimulation"). The duration of the stimuli varied from 200ms to 1000ms, but for comparison's sake only the first 200ms of stimulation will be examined here. Extracellular recordings were made at the macrocolumns whose minimal receptive fields (RFs) corresponded to either digit 2 or digit 3, with the digit where the minimal RF was located being termed the principal digit, and the other termed the marginal digit. For the purposes of this study, the macrocolumns of both digit 2 and digit 3 are considered equivalent, and the designations of principal and marginal digits are relative to a recording site's minimal RF. In later portions of the study, single-digit stimulation was applied at the marginal digit of recording sites, rather than the principal digit; in such an arrangement, recordings made would be representative of activity at the macrocolumn corresponding to that of an adjacent digit relative to stimulation.
22
Figure 2.1: Average Neuron Response to Stimulation of Different Amplitudes
(All amplitudes in μm, peak-to-peak)
23
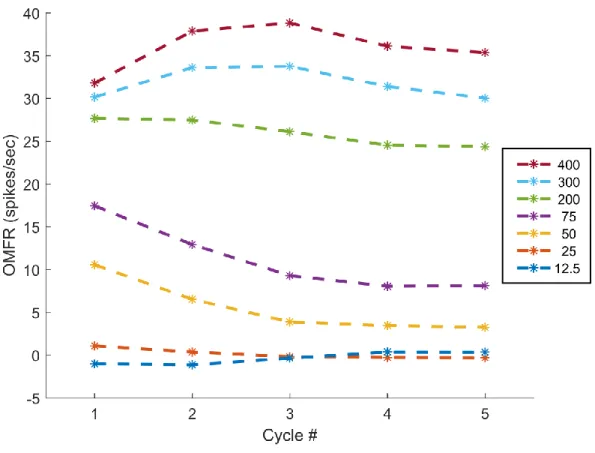
Figure 2.2: Average Neuron Response per Stimulus Cycle
(Stimulus cycle 40ms, all amplitudes in μm, peak-to-peak)
24
during the stimulus cycle will shift (Whitsel et al., 2003). The second of the common components, best referred to as adaptation, is another temporal dynamic feature previously observed in SI cortical neurons; over the course of several seconds, adaptation can greatly reduce the response of the cortex to higher amplitude stimuli, with reductions as high as 50% having been reported. The mechanism which drives adaptation is poorly understood, but the consensus is that it is related to sustained neural activity (Tommerdahl et al., 2010). The third common component of the observed time-courses is the initial, sharp spike in activity during the first cycle. This activity spike has
previously been reported in the literature (Whitsel et al., 2003, see Figs. 1-2), but its potential importance not been directly identified nor discussed to my knowledge.
Section 2.2 - Representation of Amplitude
Despite the commonplace appearance of the high-magnitude spike early in stimulation, the relationship of that spike's value to the amplitude of the applied stimuli suggests it carries useful information. Firstly, the waveforms displayed in Fig. 2.1 show that the value of the early spike is greater than that of the rest of the waveform for all examined stimulus amplitudes. This effect is most likely related to adaptation, with the activity of cortical neurons within the macrocolumn being gradually reduced following activity-driven adjustment. However, by extension it can be inferred that the initial spike, hereafter termed the startle response, likely represents the mean activity of the macrocolumn before the any temporal dynamics have significantly taken effect. In this fashion, it can be thought of as the most basic response of the macrocolumn to stimulation at the periphery.
The magnitude of the startle response increases with stimulus amplitude at lower
25
cortical level is unclear (Mountcastle et al., 1969). At stimulus amplitudes of 200μm or above, the magnitude of the startle response remains at a fairly constant level. If the magnitude of the startle response does correlate with neuron recruitment, then this would suggest that maximal recruitment is achieved between 75 and 200μm. Early primate studies suggested that maximal recruitment of primary afferents occurs at approximately 100μm (Mountcastle et al., 1969), so there is some evidence in the literature to support this theory.
Although it appears related to stimulus amplitude, the plateau in the magnitude of the startle response with higher-intensity stimuli makes it insufficient to express the full range of behaviorally-relevant stimuli possible on its own. Based on the results of previous studies using long-duration, low-amplitude stimuli (Mountcastle et al., 1969) or using indirect means of observing cortical activity (Simons et al., 2005), the magnitude of the sustained response may be related to the cortical representation of amplitude. The waveforms shown in both Fig. 2.1 and 2.2 support this theory; in both representations, the OMFR of the observed macrocolumn increases with stimulus amplitude. This relationship is maintained for the duration of stimulation for all amplitudes above 25μm, including larger amplitudes wherein the startle response was equivalent. As the magnitude of the startle response is more prominent for low-amplitude stimuli, but the sustained response is more useful for high-amplitude stimuli, it is most likely that the amplitude of a stimulus is coded through the overall mean firing rate of neurons within the macrocolumn over a period of time beginning with the start of stimulation.
26
greatly reduced, and they are comparatively difficult to locate. At stimulus amplitudes above approximately 100μm, afferent fibers are known to fire twice within a single stimulus cycle, but as they reportedly occur in a "disorganized" manner (Talbot et al., 1968), and the activity of afferent fibers is not known to significantly change with time, they are unlikely result in such a differential effect. Instead, as it has been shown that neuron entrainment improves over the first few hundred milliseconds of stimulation at this frequency (Whitsel et al., 2003), the spike is likely indicative of a period before which the mechanisms that power cortical entrainment have taken significant effect. As with the startle response, this pre-entrainment peak suggests that the activity of cortical neurons is modulated through mechanisms that require some period of time or previous level of activity to take effect.
Section 2.3 - Response in Adjacent Cortical Region
27
Towards that end, here the early response of a macrocolumn adjacent to that of the digit exposed to single-digit stimulation is examined directly through extracellular recordings. OIS imaging indicated that in the early stimulus response, multiple adjacent macrocolumns displayed activity; since the macrocolumns of adjacent digits in the rat cortex are themselves adjacent (see Chapter 1), it would be expected that the macrocolumn observed here would display activity during early stimulation of the adjacent digit, even in the absence of stimulation at the digit corresponding to its own RF center.
Figure 2.3: Average Neuron Response to Stimulation at Adjacent Digit
(All amplitudes in μm, peak-to-peak)
28
2.1, show the average activity when stimulated at the principal digit. For all amplitudes tested, the activity of the macrocolumn when corresponding to the marginal digit was greater than background values for the duration of the observed testing period. This clearly illustrates that during early periods of stimulation, a greater extent of the cortex than that of the maximally stimulated region is activated. The overall magnitude of the response increased with stimulus amplitude, indicating that intense stimuli will activate adjacent areas of the cortex more strongly.
Additionally, the startle response and adaptation can be seen for each amplitude tested. This implies that as with the macrocolumn at the principal digit, the macrocolumn at the marginal digit has an initial response that is then altered through delayed temporal dynamics. The difference in magnitude of the startle response may represent a lower recruitment level in the macrocolumn of the marginal digit, which would be expected if the activity seen is caused through less direct,
secondary means, such as through macrocolumn-macrocolumn connections rather than direct afferents.
29
That said, due to limitations in the original experimental design, it must be noted that conclusions regarding precise differences in magnitude or phase between representations at the principal and marginal macrocolumns during single-digit stimulation cannot be drawn at this time. During stimulation of one digit, the stimulus probe for the adjacent digit was left in contact with the skin. Though efforts were made to isolate the stimulation of a single digit (see Chapter 1), it is possible that the propagation of the stimulus wave on the skin may have caused the adjacent digit to press into the static, isolated probe in a way related to stimulus frequency and amplitude. This potential issue is unique to the rat model due to the close proximity of the digits relative to those in a primate model. However, data monitoring the movement of the stimulus probes indicate that if this effect did occur [data not shown], the amplitude of such stimulation would be well below any amplitudes that would promote cortical activity (<<12.5μm, see Fig. 2.1). The activity shown here is unlikely to have arisen from such weak stimulation. Therefore, despite this unintended limitation the conclusions drawn here regarding the funneling response remain valid.
Section 2.4 - Implications for Perception of Amplitude
The amplitude of a flutter vibrotactile stimuli is perceived in a continuous manner from low to high amplitudes following a power-law relationship (Stevens, 1959). The equation governing this relationship, Steven's Power Law, states that the subjective intensity of a stimulus |S| is given by the difference between the amplitude A of a given stimulus and the detection threshold A0of that
perceptual modality, all raised to an exponent n and scaled by a constant α.
(Steven's Power Law)
30
vibrotactile stimuli in humans found that the relationship was near-linear, with the exponent n having values near 0.95 for frequencies in the flutter range (Stevens, 1959; Talbot et al., 1968). Primates have been confirmed to perceive such stimuli similarly to humans (LaMotte and Mountcastle, 1975), which suggests that this relationship holds for a variety of mammals.
While this law governing perception of stimulus intensity was first proposed over fifty years ago, the means through which such a relationship is reflected at the cortical level has not yet been determined. In this final section of Chapter 2, a model utilizing spatial and temporal dynamics of SI will be proposed utilizing the overall mean firing rates of multiple macrocolumns.
31
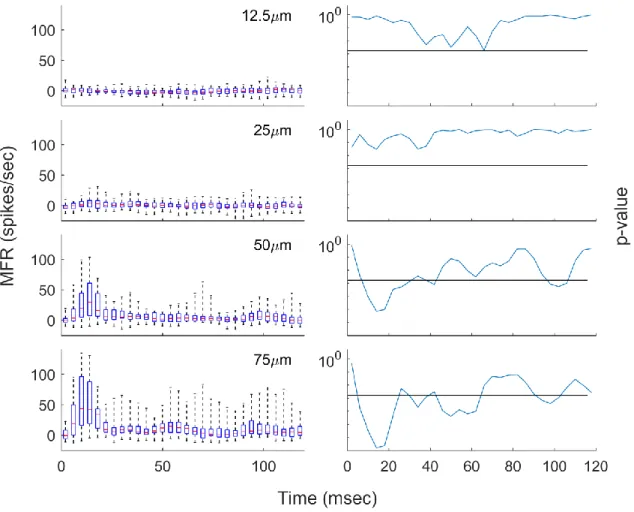
Figure 2.4: Distribution of Responses with Low-Amplitude Stimulation
(All amplitudes peak-to-peak. Black lines represent p-critical [0.05 with a Bonferroni correction].)
32
determining if the mean of the distribution was significantly different from zero. The black line represents p-threshold, where p-threshold is 0.05 with a Bonferroni correction; the distribution is considered significantly different from background if the p-value at that bin is below p-threshold. Prior to each t-test, the distribution at the tested bin was determined to approximate a normal distribution through a Kolmogorov–Smirnov (KS) test (p > p-threshold).
Firstly, the distributions at 50 and 75μm show significant patterns in a manner consistent with 25Hz-stimulation. At approximately 40ms intervals, there is evidence of an increase in group response that displays some level of significance, though the group response becomes less prominent with extended stimulation. Both amplitudes also display a clear, significant increase in the group response during the first 40ms of stimulation, corresponding to the startle response, and the reduction of subsequent peaks is consistent with adaptation. It is clear that both of these amplitudes evoke a response in a significant portion of the neuron population, and they should be considered suprathreshold.
Next, the distributions at 12.5μm show no clear increase in activity at any point during stimulation. There is no apparent positive response to stimulation, and at some points it could be argued that there is a negative response, suggesting a negative response. However the p-values resulting from t-tests of the distribution of values at each point are never low enough to reject the null hypothesis. Therefore, 12.5μm should be considered subthreshold.
33
distribution that is not significantly different from the background, but that would be expected with neuron recruitment: a small stimulus would recruit only the most sensitive of neurons. Therefore, if stimulus detection occurs with any increase in activity at the cortical level (caused by a minute increase in activity at the peripheral level), then the detection threshold under these experimental conditions is likely just below 25μm. For the purposes of calculation, it will be assumed from here that the appropriate detection threshold is approximately 20μm, which would be most consistent with this information. Interestingly, this corresponds with the minimum level of stimulation at which entrainment could be seen in rat RA afferent fibers in previous studies (Leem et al., 1993b), but as the cause in threshold elevation in this case is believed to occur at the cortical level, it is likely a coincidence.
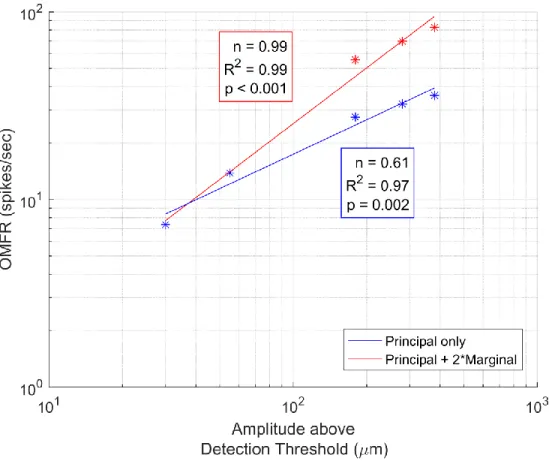
This work posited that stimulus amplitude is conveyed at the cortical level through the OMFR of neurons within a macrocolumn over a certain period of time. If such a representation is the means by which relative amplitude is perceived, then according to Steven's Power Law there should exist a power relationship between stimulus amplitude and OMFR with an exponent value around 0.95. Figs. 2.5 and 2.6 evaluate that hypothesis, showing the average increases in cortical response to single-digit stimulation over 120ms for amplitudes above the detection threshold (20μm). Such a stimulus duration would likely best reflect the response of the cortex to stimulus amplitude, as the above analysis suggests that cortical activity is heavily modified through temporal dynamics beyond that point (see Section 2.2). Despite technically being above the observed
34
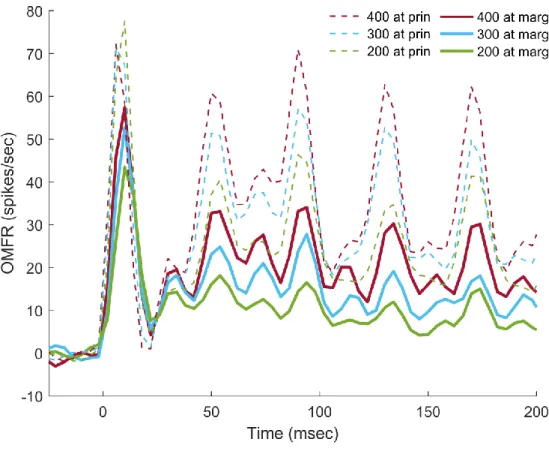
Figure 2.5: Combined Macrocolumn Responses at Suprathreshold Amplitudes
(All amplitudes in μm, peak-to-peak)
35
such an exponential value is grossly different from the 0.95 value reported in perceptual studies (Stevens, 1959; Talbot et al., 1968). Therefore, the OMFR of a single macrocolumn cannot be the means by which relative amplitude is perceived.
Instead, we propose here that the amplitude of an isolated stimulus is conveyed at the cortical level not just by the OMFR of a single macrocolumn, but by the combined OMFR of all macrocolumns activated during stimulation. The results discussed in Section 2.3 illustrate that during the initial period of stimulation, regions of the cortex not corresponding to that directly stimulated are also activated; this level of activation is more pronounced at higher amplitudes. While such regions may become inactive with time in accordance with the funneling response (Simons et al., 2005, 2007; Tommerdahl et al., 2010), this initial lateral spread suggests they could have an impact on the perception of stimulus amplitude, especially for those greater than ~100μm.
Fig. 2.5 includes estimates of the combined OMFRs of the regions likely activated through single-digit stimulation. The estimates were made by combining the activity of observed
macrocolumn when its principal digit was stimulated with twice the activity seen when its marginal digit was stimulated; such an estimate would approximate the activity seen at the directly
stimulated macrocolumn as well as those corresponding to adjacent digits (for example, the combined activity of macrocolumns corresponding to digit 3 as well as digits 2 and 4). This activity pattern would reflect a mirrored pattern in the initial lateral spread. No new estimates were made for low-amplitude stimuli, as their low levels of activation in the principal macrocolumn suggest that they would promote a minimal level of activity in adjacent macrocolumns, if any.
36
would appear that to continue the trends set at low-amplitude stimuli, it is necessary for the cortex to expand the extent of the activated cortical region; as it is believed that each macrocolumn in rat SI is most strongly activated by a single digit, so this expansion is most likely originates at the cortex.
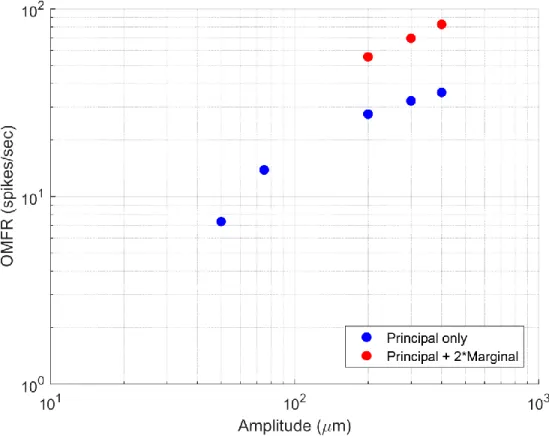
Figure 2.6: Representation of Stimulus Amplitude at Cortical Level
(All amplitudes in μm, peak-to-peak, shifted by detection threshold.)
37
expressed across an increased expanse of cortex, and the size of the expanse is related to the perception of the stimulus.
38
CHAPTER 3: RESPONSES TO SIMULTANEOUS
TWO-DIGIT STIMULATION
Chapter 2 analyzed the effects of single-digit vibrotactile stimulation, and the results supported the hypothesis that the amplitude of a single stimulus applied at the periphery is largely represented in the cortex in the cortical area's overall mean firing rate (OMFR). Given this
information, Chapter 3 will investigate the effects of simultaneous two-digit stimulation on cortical activity. Two-digit stimulation involves the co-processing of multiple, near-adjacent macrocolumns for an extended period, and thus it is subject to additional cortical dynamics to which single-digit stimulation is not. These new dynamics, which will be probed through the use of conditioning stimuli, are anticipated to have differential impacts on the cortical response to stimulation at multiple peripheral sites, and by consequence the perception thereof.
The stimulus pattern for two-digit stimulation consists of applying the test stimulus (300μm) to the one digit and the standard stimulus (200μm) to an adjacent digit. In this study, digits 2 and 3 are used; the digit where the minimal receptive field (RF) of the recording site is located is termed the principal digit, and the adjacent digit is termed marginal digit. As a general rule and unless otherwise specified, the test stimulus is applied to the principal digit of the recording site, and thus macrocolumn, under observation, and the standard stimulus is applied to the marginal digit. Since the setup used did not allow for simultaneous recording of macrocolumns, to examine the effects of stimulation as described above at a recording site in an adjacent macrocolumn, stimulus amplitudes were switched such that the test amplitude was applied at the marginal digit relative to the
39
In this chapter, terminology relating to activity at the principal and marginal digit locations refers to the macrocolumns to which those digits most strongly project, as discussed in Chapters 1 and 2. All data utilized in statistical tests were first confirmed to follow normal distributions using Kolmogorov–Smirnov (KS) tests (p>0.05 or p-threshold), and all t-tests and KS tests involving
multiple time points utilized a value p-threshold for significance testing, where p-threshold was 0.05 with a Bonferroni correction. Unless otherwise noted, all stimulus amplitudes are in μm peak-to-peak.
Section 3.1 - Single vs. Two-Digit Stimulation
In Chapter 2, it was discussed that a single vibrotactile stimulus of sufficient amplitude at the periphery could not only evoke activity in the macrocolumn most closely associated with the stimulus site, but also in those that were physically or perhaps functionally adjacent to it. This increase of activity in an adjacent cortical region was attributed to the initial phase of the funneling response, a response having spatial and temporal components which is theorized to result from secondary horizontal communications between macrocolumns and pericolumnar inhibition (Tommerdahl et al., 2010). However, the responses reported in Chapter 2 at adjacent
macrocolumns occurred in the absence of stimuli at corresponding digits; it is unclear how such secondary intercommunications will impact cortical activity in the presence of primary afferent drive.
40
macrocolumn was made by varying the digit to which the test amplitude was applied during simultaneous two-digit stimulation; the digit to which the test stimulus was applied relative to the recording site's minimal RF determined the macrocolumn's designation for that test. To compare the responses of the principal and marginal macrocolumns to their responses to the same stimulus amplitudes but in isolation, single stimuli with amplitudes matching the test and standard stimuli respectively were applied in a single-digit manner to the principal digit relative to the recording site.
Figure 3.1: Macrocolumn Responses to Stimulation at 1 or 2 Digits
(All amplitudes are μm peak-to-peak)
41
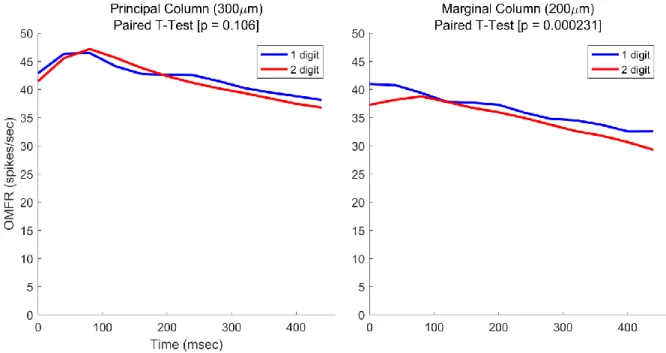
applied in isolation and as part of two-digit stimulus pattern, and it is apparent that the
macrocolumn is less active during two-digit stimulation. The p-value of an accompanying paired t-test is below 0.05, indicating that the difference in activity is significant. This differential effect on one macrocolumn but not the other supports the hypothesis that there are spatial aspects in two-digit stimulation that are not present in single-two-digit stimulation.
The reason for the decrease at the marginal macrocolumn is likely related to the relative amplitude of the stimulus applied at the marginal digit relative to that at the principal digit. A perceptual phenomenon has been previously reported wherein a strong stimulus would reduce sensitivity to other stimuli at adjacent skin regions (von Békésy, 1965). If the OMFR of a cortical region is related to the perception of a stimulus at the same mapped region of the skin, then the results in Fig. 3.1 support the theory that such reduced sensitivity arises at the cortical level, with the region activated by the lesser stimulus being modified by the region activated by the stronger stimulus. This phenomenon is known as lateral inhibition, and it likely results from long-range inhibitory connections between related macrocolumns (Tommerdahl et al., 2010). However, it is unclear if this reduction is directly related to the funneling phenomenon, as the lateral inhibition present occurs during a shorter stimulus, while that explicitly observed in the funneling
phenomenon is expected to develop over an extended duration (Simons et al., 2007).
42
digit. This result matches expectations, as primary afferent drive should logically have a greater excitatory effect on cortical activity than indirect connections between macrocolumns, which are believed to be the cause of the funneling phenomenon's initial spread.
Figure 3.2: Marginal Macrocolumn Response to Principal Digit and Two-Digit Stimulation
43
suggests that the difference is statistical in nature; while individual cells may experience a decrease in activity, in aggregate the marginal macrocolumn will experience an increase.
Figure 3.3: Digit Macrocolumn Responses to Two-Digit Stimulation
(Differences are Principal - Marginal)
44
points during stimulation. This suggests that the relative relationship between the digits is preserved, with the more strongly stimulated digit displaying on average higher levels of activity. The two waveforms are significantly different from one another, as confirmed by a paired samples t-test (p << 0.01).
To examine if the relationship between the two waveforms changed over time, the difference between the response of the principal and marginal macrocolumns scaled against their average response was evaluated for each cycle. For each recording site, the difference between the waveforms from their average was calculated, scaled by the average number of neurons over all recording sites, and smoothed with a moving weighted average. Fig. 3.3d shows the distribution of calculated values, and the averages at each time point are shown in Fig. 3.3b. A series of Student's t-tests shown in Fig. 3.3c confirmed that the distribution of recording site responses was significant for each cycle of stimulation (p<p-threshold)
Fig. 3.3b shows that the average difference from the mean is initially low, but it
progressively rises in subsequent cycles. The initial similarity in values mimics that of the startle response discussed in Chapter 2 wherein the first cycle of stimulation was largely equivalent for all stimulations above approximately 100 μm. Meanwhile, the progressive increase in values is likely related to the differential effects of two-digit stimulation shown in Fig. 3.1, and it suggests that such differential effects develop with extended stimulation. If the OMFR at a macrocolumn
corresponding to a single digit is the indicator used to determine the relative magnitude of stimulation at that digit versus another at a perceptual level, then one's ability to discern the
45
Section 3.2 - Effects of Single-Site Conditioning
To examine the effects of adaptation due to extended neuron firing, a high-amplitude conditioning stimulus (400μm, 1 sec) was applied to the principal digit prior to two-digit stimulation, with a 500ms gap in between. Adaptation is the phenomenon wherein the responsivity of a neuron or cortical area drops with sustained activity (Whitsel et al., 2003), and it would be expected that such a stimulus would dramatically reduce the ability of the principal macrocolumn to respond to stimulation.
Figure 3.4: Principal Macrocolumn Response Following Single-Site Conditioning
(Ratios are No Conditioning/SSc)
46
are shown in Fig. 3.4a as the red line, with the blue line being the activity of the principal
macrocolumn during two-digit stimulation without a conditioning stimulus ("None"). Both OMFRs were calculated according to steps given above, and they were determined to be significantly different from one another using a paired samples t-test (p << 0.01). The reduction in overall activity following SSc suggests the conditioning stimulus caused a change in cortical conditions prior to two-digit stimulation, preventing observed neurons from reacting the same way to the same stimulation. This further indicates that the activity of the cortex is subject to alteration through temporal effects in addition to spatial.
To observe the degree to which cortical activity was altered by SSc, the ratio of cortical activity after SSc and without conditioning was calculated during each cycle of stimulation for each recording site, using similar pretreatment to that previously described. The natural log of these had a broad but normal distribution at each cycle as shown in Fig. 3.4c, but their means, shown in Fig. 3.4b, indicate that on average the activity of the cortex was reduced following SSc.
47
3.4c, indicate that the two waveforms remain different from each other even through the last cycle of stimulation (p < p-threshold). The log-ratio of recording site distributions during the first cycle of stimulation is not significantly different from zero, suggesting that the mechanisms behind the startle response are not affected by this type of conditioning.
Section 3.3 - Effects of Dual-Site Conditioning
Figure 3.5: Principal Macrocolumn Response Following Dual-Site Conditioning
(Ratios are No Conditioning/DSc)
48
corresponds to the conditioned region displays reduced activity through adaptation, while the activity of adjacent, off-center macrocolumns likely display a greater reduction in comparison due to lateral inhibition. However, behaviorally speaking, funneling responses seldom occur in isolation. Rather, activity in the cortex would be expected to be the result of multiple funneling responses of adjacent regions occurring simultaneously. To date, the effects of multiple, separate funneling responses on cortical activity in the somatosensory cortex have not been directly studied.
To evoke such funneling responses and to test the effects of lateral inhibition resulting from two active areas, both digits used in this study were preconditioned with identical, low intensity stimuli (200 μm, 1 sec) prior to two-digit stimulation, with a 500ms gap in between. The effects of such a stimulus pattern, termed dual-site conditioning (DSc), are shown in Fig. 3.5a at the principal macrocolumn. The OMFR following DSc was less than that without conditioning for all time points beyond the first cycle, and this difference was shown to be significant through a paired samples t-test (p << 0.01). This result resembles that seen following SSc, adding further evidence that conditioning of any sort will change the conditions of the cortex prior to two-digit stimulation.
49
The tests performed here with SSc and DSc stimuli highlight the temporal effects of
conditioning on the cortex. These temporal effects, related to the cortex's funneling phenomenon, appear similar when the principal macrocolumn is examined alone. At the principal macrocolumn, responses following SSc and DSc both considerably reduce cortical response to the same
stimulation, and both slowly drift back towards the unconditioned response with time. That said, the primary difference in responses between these conditioning patterns would be more expected to lie in their spatial properties: how the presence or absence of a conditioning stimulus on the marginal digit itself would affect its subsequent response to two-digit stimulation. A single funneling phenomenon should disproportionately affect cortical areas surrounding the receptive field center (Simons et al., 2007), so comparing changes in the marginal digit to those in the principal digit would better highlight differences in cortical response to SSc and DSc.
Fig. 3.6a shows the mean responses to two-digit stimulation following DSc as seen at the principal and marginal macrocolumns. The response at the principal digit is greater than that of the marginal digit for the full duration of stimulation, indicating that on average the difference in
stimulus magnitudes at the two locations still produces a difference in OMFR despite DSc. The mean responses were significantly different according to a paired samples t-test (p << 0.01).
50
perception of relative stimulus magnitude arises, then the application of DSc prior to two-digit stimulation would likely improve one's ability to discern the larger of the two simultaneous stimuli, even if perception of the actual magnitudes of the stimuli are lost in the process.
Figure 3.6: Digit Macrocolumn Responses Following Dual-Site Adaptation
(Differences are Principal - Marginal)
51
marginal digit, rather than the principal. This hypothesis is further supported by the previous observation that while the cortical representation of the principal digit is initially reduced following DSc, it gradually approaches the activity seen at the principal digit without conditioning (see Fig. 3.5a).
Section 3.4 - Impact of Conditioning on Amplitude Discrimination
Here it has been shown that the responses of macrocolumns servicing two digits become more different with time following DSc. In human perceptual studies, DSc has been shown to improve subjects' ability to discern the larger of two stimuli as compared to without conditioning (Tannan et al., 2007). Therefore, it is likely that this ability, termed amplitude discrimination (AD) is likely related to this differential change in activity between digit macrocolumns. If that is the case, then further insight into this hypothesis could be gained through the comparison of metrics similar to those discussed above between digit macrocolumns with and without conditioning.
Figure 3.7: Time Courses as Source of Amplitude Discrimination Performance
52
As expected, the two average waveforms were significantly different from one another (paired t-test, p << 0.01), and their time courses are visibly different from one another.
However, the series of paired t-tests performed at each cycle of stimulation using the values calculated for all penetrations, as shown in Fig. 3.7b, contradict this result. Comparing on a site-by-site basis, there are a number of cycles during which the difference between the responses of the principal and marginal digits relative to their average value for stimulation without conditioning and following DSc was not significant (p > p-threshold). Those are not sequential, and they show no clear trend. The penetration values shown in Fig. 3.7c also do not appear to support the difference with and without conditioning, as at each time point the distributions of values for the two test patterns appear similar to one another. These results suggest that differences in the OMFR of stimulated regions are not the modality through which AD performance arises.
A second modality for AD that can be tested is the ratio of OMFR of the regions stimulated. Amplitude Discriminatory ability follows Weber's law in healthy subjects (Francisco et al., 2008), which makes the ratio of the magnitudes of applied stimuli the determining factor when discerning differences in amplitude at the perceptual level. From this, it stands to reason that such a
phenomenon may be seen in the somatosensory cortex. Despite this, tests comparing the log-ratio of the OMFR of the principal and marginal macrocolumns showed results virtually equivalent to those above; the log-ratio was not significantly different when conditioning was applied. In this regard, neither the difference nor the ratio between cortical regions appears to be a viable
candidate for the source of AD performance, at least not for any given recording site. Therefore, it is likely that only in aggregate can the change in activity at both the principal and marginal
53
As such, the mean cortical responses of the principal and marginal digits for two-digit stimulation following each style of conditioning (None, SSc, and DSc) are presented together in Fig. 3.8a. Viewed in this manner, the responses at the principal and marginal digit locations to multiple stimulus patterns can be more directly compared.
Figure 3.8: Macrocolumn Comparisons for Amplitude Discrimination
54
corresponds to the startle response. The distribution of initial values appears to be bimodal, where the responses seen at the principal digit are distributed around a different, higher mean than those seen at the marginal digit for all conditioning variations. This, and the observation in Chapter 2 showing that single-digit startle responses are largely equivalent above a certain stimulus amplitude, suggests that the startle response is largely unaffected by conditioning but is instead dependent on observed location.
Next, it is evident that following conditioning, the cortical representations of both the principal and marginal digit experience a large drop in overall activity compared to those without conditioning. This effect was partially investigated previously for the principal digit in Sections 3.2 and 3.3, but here it is obvious that the effect occurs at the marginal digit as well. The reason for these drops must be related to the presence of conditioning and its evoking of one or more funneling responses with lateral inhibition, though the effect on a given region will vary. For example, those sites whose corresponding digits were stimulated during conditioning may still be experiencing some reduction in activity resulting from adaptation, while those sites whose corresponding digits received no such stimulation would be more greatly affect by secondary aspects of the funneling response, such as the previously-reported suppression of adjacent cortical regions (Simons et al, 2007).
55
stimulation, it is possible that the recorded neurons became entrained during conditioning and remained so at the time of two-digit stimulation. Observations made using the same data averaged into 4ms bins [data not shown] support this hypothesis, as noteworthy out-of-phase peaks occur early in conditioning but are largely unseen or of reduced magnitude during the two-digit stimulation period. This entrainment effect is another temporal phenomenon through which conditioning affects cortical responses, and it may have other implications to perception that are not directly investigated in this study, such as frequency discrimination (Whitsel et al., 2001; Tommerdahl et al., 2005) or temporal order judgment (Tommerdahl et al., 2007) .
Finally, it is interesting to note that while the responses at the principal digit are visibly different between SSc and DSc, the responses seen at the marginal macrocolumn following conditioning are largely equivalent. This is an unexpected result, given that the marginal digit was only directly manipulated during DSc but not SSc. It raises the possibility that both on and off-center conditioning will both bring about the same response to a lesser stimulus if an adjacent region is stimulated more strongly. However, it is more likely a coincidence, with SSA affecting the region prior to stimulation through added suppression and DSA affecting the region through increased adaptation. The similarity of the effects on cortical activity seen here is likely unique, resulting from the choices in the conditioning stimuli magnitudes utilized in this study.
Fig. 3.8b investigates the hypothesis that the ratio of responses seen at the principal macrocolumn relative to those seen at the marginal macrocolumn are responsible for AD