FORCES IN CYTOSKELETAL SYSTEMS
by
Sreeja B. Asokan
A dissertation submitted to the University of North Carolina at Chapel Hill in partial fulfillment of the requirements for the degree of Doctor of Philosophy in the Department of Physics and Astronomy.
Chapel Hill 2006
Approved by
Advisor: R. Superfine, Ph.D. Reader: S. Washburn, Ph.D.
ABSTRACT
Sreeja B. Asokan: Forces in Cytoskeletal Systems (Under the direction of R. Superfine, Ph.D.)
To my parents,
Dr. and Mrs. Padmanabhan
and my husband, Aravind Asokan
ACKNOWLEDGEMENTS
The successful completion of this thesis required the support and encouragement of many. First, I would like to express my deep and sincere gratitude to my advisor, Dr. Richard Superfine for his support and advice. His rigor and passion for science will have a permanent influence on my approach to life. I am also indebted to my committee members, Drs. Washburn, Salmon, Cheney, and Tiesinga for their guidance and encouragement. It is an honor to have worked under the combined mentorship of experts in different aspects of science. I also wish to thank the faculty and staff of the department of Physics and Astronomy, especially, Ms. Maggie Hudson for their support.
I wish to extend my sincere thanks to the network of support I relied on throughout grad school – the members of the Nano Science Research group. In particular, I want to thank Jeremy Cribb, Adam Hall, Lloyd Carroll, Lolo Jawerth, Atsuko Negishi, Jay Fisher and Ben Wilde for all the scientific discussions and fun times.
TABLE OF CONTENTS CHAPTER
I INTRODUCTION………..………...…….... 1
1. Introduction....………... 2
2. Actin microfilaments .……….. . 3
3. Myosin: Actin activated ATPase….………... 7
3.1MyosinV….……….. 9
3.2 Motility assay…..……….……… 10
4. Microtubules ……….………... 11
5. Force technologies ………...……….. 13
5.1 Dielectrophoresis……….. .. 14
5.2 Drag forces and torques…...………... 15
5.3 Brownian motion……….. .. 16
II DIELECTROPHORETIC MANIPULATION OF ACTIN-MYOSIN SYSTEM 17
III STEERING MOTILE ACTIN FILAMENTS IN MICROFLUIDIC CHANNELS 40 IV DIFFUSION OF CYLINDRICAL PARTICLES IN VISCOUS AND VISCOELASTIC FLUIDS……… 71
V CONCLUSIONS AND FUTURE DIRECTIONS……….….. 105
1. Introduction
Motility is one of the crowning achievements of evolution. This motion, at all length scales, from a molecule to the organism, is due to forces. Primitive cells probably relied on diffusion to distribute metabolites. But as the cell evolved to perform more elaborate and sophisticated functions, the need for a well developed transportation system to move materials within the cell grew. Molecular forces generated by filaments and motor proteins control biochemical traffic inside the cell and connect the cell with the outside through the membrane. Cells exhibit dramatic changes in their morphology by pushing against their own membranes to form microvilli and filopodia, peeling and pulling against surroundings to search and defend the body against foreign organisms, swimming with engineered actuating structures like cilia. The replication of a cell, involving chromosomes and filaments, arises from the coordinated movement between the restructuring affects of molecular forces and the biochemical force sensors that stop and start different stages of cell division. The concerted and synchronized movement of thousands of molecular motors within the cilia oscillates it to cause the flow of the pulmonary barrier fluid over long distances. Within organisms, cells cause fluids to flow transporting nutrients and flushing barrier layers. The organization and motion of tissue is dictated by the motion of cells, and their ability to generate and respond to forces.
The cytoskeleton is a network of 3 types of fibers: microfilaments, intermediate filaments and microtubules. Actin microfilaments are central to almost every type of motility from cell migration to cytosol transport. Actin filaments serve many cellular functions including transmitting internal stresses, providing mechanical strength to the cell cortex, regulating enzymatic activities, and spatially organizing the cytoplasm and signal transduction pathways (Elson, 1988; Evans, 1993; Janmey, 1998). Actin was first identified as part of the acto-myosin protein complex responsible for producing the contractile force in skeletal muscle (Straub, 1942). One of the earliest recognized functions of actin is to assemble into linear polymers that in muscle form the thin filaments of the sarcomere. In other cell types actin assembles into a variety of structures including isotropic networks of filaments within the cytoskeleton, contractile actin filament bundles often called stress fibers, highly organized parallel arrays of filaments in such structures as microvilli and the thin protrusions of hair cells in the cochlea, as well as small oligomeric or monomeric particles and protein complexes in the cytoplasm.
Actin exists as a globular monomer called G-actin and a filamentous polymer called
Figure 1.1. The structure of the actin monomer obtained from the actin-DNAse-1 crystal is superimposed on the density map of the actin filament derived from X-ray diffraction and EM. Derived from www.mih.unibas.ch/Homepages/stoffler/Slides/Actin/Actin.html.
phosphate to form a mixture of ADP-actin and ADP-Pi actin subunits within the filament. At the end of the filament with lower affinity for polymerization, actin subunits contain primarily ADP, and at steady state, the net rate of disassembly matches the rate of assembly at the barbed end. Observing the growth of actin from the two ends of decorated filaments where the two ends could be discerned showed that the barbed filament end is the preferred end for assembly (Kondo and Ishiwata, 1976) and in the presence of ATP has a 12 fold higher affinity for actin subunits that the pointed end (Wegner and Isenberg, 1983). X-ray diffraction and Electron microscopy of F-actin filaments have revealed that this long flexible filament is of 7-9 nm diameter and is a helix with a repeat length of 36 nm.
F-actin filaments in vivo and in vitro are typically micrometers long, and therefore have a high aspect ratio. A filament can hence have many physical deformations at scales far above the monomeric scale. To model these deformations, one can neglect the helical character of the filament and model it as a semi flexible homogeneous cylinder. Even though the conformation of least elastic energy for the semi flexible filament would be completely straight, at finite temperatures the average conformation of the molecule is curved due to the random thermal forces exerted by the solvent. An important feature of microscopic structures such as actin in aqueous solutions is thermally excited motions. The conventional measure of the degree of thermal flexing of a polymer is the persistence length (Landau et al., 1980). The persistence length lp is defined by the correlation function (Eq. 1.1) as the characteristic distance along the polymer chain over which the directions of unit vectors u (s) drawn tangent to the polymer contour become uncorrelated.
p l
s e ) u(
where <> denotes the time average over thermal fluctuations, and sis the distance along the contour of the chain, measured from some arbitrary point s= 0 (figure 1.2).
Figure 1.2. Unit vectors u (s) drawn tangent to the polymer contour. Persistence length is the characteristic length beyond which the tangent vectors become uncorrelated.
The persistence length is also related to the Young’s modulus of the filament (Eq. 1.2).
T k
EI l
B
p= [1.2]
Here, E is the Young’s modulus of the filament, and I is the moment of inertia, kB the Boltzmann constant and T the temperature. Conversely, the persistence length is roughly the length over which a filament appears straight. Most measures of lp for F-actin are in the range of 3-18 Om (Gittes et al., 1993), and the typical length of an actin filament in vitro is from 1 - 20 Om compared to a diameter of 8 nm.
within the cell by polymerization and depolymerization of actin alone results in several types of cell movements. Actin polymerization at the leading end of migrating cells produces changes in the position of the plasma membrane causing the cell to move. In addition, the actin filaments are rapidly cross-linked into bundles and networks at the leading edge in the filopodia and lamellipodia. These structures prevent the membrane from retracting by forming stable contacts with surfaces.
3. Myosin: Actin activated ATP-ase
Figure 1.3. An unrooted phylogenetic tree of the myosin superfamily. This tree was assembled using myosin head domain protein sequences from all currently known or predicted myosins in humans, Drosophila, C. elegans, Dictyostelium, Arabidopsis, S. cerevisiae, and S. pombe, as well as selected myosins from other organisms. (source: Berg et al., 2001)
force-producing head domains stick out from the side of the thick filament, ready to walk along the adjacent actin-based thin filaments in response to the proper chemical signals. Apart from muscle contraction, myosin II is required for cytokinesis, cell motility, cell polarity/chemotaxis, maintaining cell architecture and development in nonmuscle cells.
3.1 Myosin V
Figure 1.4. Single myosin V HMM “walking” on actin filaments seen by EM (source: Walker et al., 2000).
AFM imaging of myosin V estimates the motor to extend to ~ 120 nm in height (Ando, 2001). Each myosin-V heavy chain is associated with approximately four calmodulin light chains as well as two less abundant proteins of 23 and 17 kDa (Cheney et al., 1993). Mehta et al. in 1999 observed that myosin-V is a processive actin-based motor just like Kinesin (Mehta et al., 1999). Processivity means that the motor undergoes multiple catalytic cycles and coupled mechanical advances for each diffusional encounter with its track. This allows single motors to support movement of an organelle along its track. It can move in large steps approximating the 36 nm pseudo-repeat of the actin filament applying force of 3 pN per motor. This step size is much higher when compared to the 8nm step size for kinesin. Recently Yildiz et al. showed that myosin V moves in a hand-over-handmodel of motility, not an inchworm model (Yildiz et al., 2003).
3.2 Motility assay
Figure1.5. Microtubules can be seen in a bundle in this negatively stained preparation. Then heavy metal stain is deposited around the structures, delineating their structure. This preparation may allow you to see the tubulin molecules in the protofilaments. (Taken from Bloom and Fawcett; Textbook of Histology)
Within each protofilament, U heterodimers are oriented with their -tubulin monomer pointing toward the plus end of the MT. Therefore, -tubulin is exposed at the plus end and
the actin filaments because of their tube like construction. Their persistence length has beenmeasured to be as high as 5 mm (Gittes et al., 1993)
5. Force technologies
For studying biology at the molecular scale, there is a need to develop new force technologies, data analysis and interpretation techniques, and new model building with data comparison. Several techniques have been developed for measuring the forces generated by specific molecular mechanisms, and for measuring the general rheological properties of media that determine their response to these forces. For force measurements involving molecular motors, spindles or flagella, techniques used include laser tweezers and microneedles. Laser tweezers have provided remarkable insight into single molecule force generation, but is limited by the inability to focus the trap tightly in microscale systems, and its application in biological fluids where the trap can be loaded by extraneous proteins and macromolecules. Microneedles can be limited by their invasiveness and the lack of general applicability. High sensitivity is usually limited to single direction. Atomic Force Microscopy has been used to image atoms of hard surfaces, has 1 nm resolution on packed arrays of proteins and long molecules. In addition to imaging, AFM has been applied to measure the force response of single biological molecules, including titin, fibronectin and DNA. Recently, magnetic traps have been used to measure the viscoelastic properties of cells and actin networks with demonstrated forces of over 8 nN.
5.1 Dielectrophoresis
along field lines to higher field regions. If the applied field is AC, the particles show a frequency dependant movement. At low frequencies particles move toward high field regions and at high frequency they move toward the low field regions. This cross over in direction of movement happens at a frequency determined by the dielectric properties of the particles as well as the medium they are in. The advantages of using AC field are reduction in electrokinetics, fluid heating and most importantly, exploitation of the frequency dependent dielectric behavior of particles. Using DEP we were able to probe the dielectric property of actin, pattern actin deposition, and also control the random movement of filaments during motility using moderate force and torque. Not only is DEP a novel technique to probe force in the context of biology, it has many applications in the field of nanotechnology. Advancement in the fields of microelectronics and microfluidics has influenced the development of miniaturized devices, where all necessary parts and methods to perform a chemical analysis are integrated. These micro total analytical systems (µ-TAS) will function as integrated sensing, actuating and synthesizing systems, with various uses. Development of such lab-on-a-chip requires integration of microsensors and microactuators on a single chip. This becomes challenging due to the lack of actuating structures with dimensions less than a micron. Molecular motors, as autonomous transporting and sensing systems, may play an important role in such nanoscale technologies. Integrating biomotors with nanoscale devices enables the use of ATP as an energy source to yield energy efficient systems capable of operating as pumps, valves and vehicles. Dielectrophoresis is a convenient technique to combine molecular motors with silicon electronics including the patterning of their position and the controls of motion for complete integration of molecular motors into µ-TAS.
control electronics, chemical and physical barriers, all typically integrated in microfluidic channels.
5.3 Brownian motion
CHAPTER II
DIELECTROPHORETIC MANIPULATION OF ACTIN-MYOSIN SYSTEM
This chapter includes the original publication:
PREFACE
Molecular motors, as autonomous transporting and sensing systems, may play an
important role in nanoscale technologies such as analytical and electromechanical systems.
For this purpose, it is important to establish control over the patterning of deposition of
filaments and their molecular motor-induced transport. Application of electrical signals to
control motor motility is necessary for their integration with silicon electronics. We have
applied dielectrophoretic (DEP) forces with quadrupole electrodes to pattern actin on a
substrate. In addition, DEP torque(s) directed the motion of actin on myosin substrates along
electric field lines. These are our first steps towards building an on-chip, integrated, biomotor
1. Introduction
Biomolecular systems have been harnessed for many nanotechnology purposes
including kinesin/microtubule system for linear transport (Limberis et al. 2001, Limberis et
al. 2000) and F1-ATPase, which has been used for the construction of rotary
biomotor-powered nanodevices (Montemagno and Bachand 1999; Soong et al. 2000). Mechanicaly
defined grooves on substrates and lithographically defined channels in photoresist have
proven useful in patterning molecular motors (Suzuki et al., 1997). Engineered tracks have
been shown to direct the movement of filaments over motor substrates (Hess et al., 2001).
For the dynamic control of molecular motor motion, light-controlled molecular shuttles
capable of carrying cargo have been built (Hess et al., 2001; Dennis et al. 1999). In this
chapter, we demonstrate the patterning of deposition and the control of motility of the
actin/myosin motor system using dielectrophoresis (DEP). Using DEP we were able to probe
the dielectric properties of actin, pattern actin deposition, and also control the random
movement of filaments during motility using moderate force and torque. The properties of
actin/myosin motor systems as a transportation system parallel those of the
kinesin/microtubule system. However, the actin filament flexibility may allow finer
definition of filament pathways and capability to turn corners in the fluidic channels of a µ
-TAS, while the step size may offer greater ability for motor shuttles to cross from one
filament to another. Laser traps have been used to study the mechano-chemical properties of
single motor proteins (Visscher et al., 1999). However, building optical traps with the
necessary tight focusing of light within a micro-scale system poses many difficulties. Electric
fields at low frequencies have been used to apply weak forces on charged actin to direct the
applied to actin filaments using AC electric fields. Applying high frequency AC fields
reduces electroosmosis and fluid heating in the buffer (Ramos et al., 1999). In addition, the
frequency dependent dielectric behavior of particles may be exploited. In the following we
describe the forces and torques generated by DEP on actin filaments, and their application to
respectively, the deposition of filaments and the control over their motility.
Dielectrophoresis,(Pohl, 1978; Jones, 1995) the force experienced by a polarized
particle in an electric field gradient, has been shown to manipulate and trap sub-micron
particles(Washizu and Kurosawa 1990; Green and Morgan 1999). When particles are
subjected to an electric field, a dipole moment is induced in them. In a non-uniform field a
polarized particle experiences a net force, which can translate the particle to high or low field
regions termed positive and negative DEP respectively. This movement depends on the
polarizability of the particle relative to that of the medium. In an AC field, positive and
negative DEP can be achieved by choosing appropriate frequencies .The frequency at which
there is no force acting on the particle is the crossover frequency. A dipole aligns itself along
the field lines in response to a torque, which is termed electro-orientation (EO). In
structurally asymmetric particles EO can be used to align the particle axis with the electric
field lines (Miller and Jones, 1993). Actin deposition on a substrate can be patterned using
dielectrophoretic forces and orientation torques. Actin collected in the high field regions of
the electrode geometry in response to DEP forces. The polarized filaments aligned their
principal axes along field lines. Further, the torque on actin filaments acted as an aligning
force during motility. The normally random movement of actin on myosin substrate was
regulated to a collimated movement by alignment of the filaments parallel to field lines. This
2. Dielectrophoresis
The dielectrophoretic force on a particle in an electric field is given by,(Pohl 1978;
Jones 1995)
( )
{
}
(
2)
Re CM rms
m
dep G f E
F = [1]
For a sphere
3
2 r
G = [2]
{
}
m p m p CM f ~ 2 ~ ~ ~ ) ( += [3]
For a rod
l r
G 2
6
= [4]
{
}
m m p CM f ~ ~ ~ )( = [5]
Where r is the particle radius, l the length, mis the real permittivity of the suspending
medium, is the gradient operator, Erms is the local RMS electric field, and Re{fCM( )} is the
real part of the Clausius-Mossotti factor at a frequency of applied AC electric field.~p and
m
~ are the complex permittivities of the particle and the medium respectively. The complex
permittivity is given by ~= i( ) where i= 1, is the real permittivity, and is the conductivity of the material. The real permittivity is a material property and can be
written as a product of the relative permittivity of the material and permittivity of free
space 0 (8.85x10⁻¹² C2/N.m2). The direction of the DEP force, positive or negative, depends
on the sign of the Re{fCM( )}. Obtaining both positive and negative DEP allows maximum
actin, we require its dielectric properties, Clausius-Mossotti factor and geometry. In the
following we estimate the range of the complex permittivity of actin. We can further use this
estimation to evaluate the forces and torques applied to actin filaments by AC electric fields.
2.1 Dielectric property of actin
Actin can be modeled as a rod shaped particle of 8 nm diameter, (Lodish et al., 1995)
and it can polymerize into strands a few microns long in vitro. In solutions, they carry high
surface charge (Tang and Janmey, 1996) and consequently are surrounded by a cloud of
counter-ions. Application of an electric field distorts this counter-ion cloud. The presence of
permanent dipoles along with charge-induced polarization should lead to high values of
polarizability similar to that for DNA.(Asbury et al., 1998; Takashima and Fishman, 1977)
Actin therefore, is expected to have higher polarizability than the medium at lower
frequencies and consequently the DEP force is expected to be towards the high field region
(positive DEP). The complex permittivity of actin has not previously been determined. The
value of real permittivity for proteins has been estimated to range from 10 0 to 36 0
(King et al., 1991; Smith et al., 1993). We have assumed for actin to lie in this range. The
imaginary part of the permittivity is the conductivity of actin. In the following we estimate
this from the surface charge of actin. The surface charge density of a particle is known to
affect its dielectrophoretic behavior, best explained in terms of Maxwell-Wagner interfacial
polarization (Pohl 1978; Jones 1995). The total conductivity of a particle is the sum of its
intrinsic conductivity and its surface conductivity (Green and Morgan, 1999).
s
p k k
k = int+ [6]
The surface conductivity of the particle is attributed to the movement of counter ions
to the surface charge of the particle (Miles and Robertson, 1932; Fricke and Curtis, 1937;
the surface conductance is given by = µ. The linear charge density of actin at pH 7.2 is
known to be approximately 6.4x10⁻¹⁹ C/nm (4 e/nm) (Tang and Janmey, 1996). Assuming a
diameter of 8 nm, we expect actin to have a surface charge density of 0.025 C/m2. In a buffer
with predominantly potassium as the counter ion (mobility µK = 7.6x10⁻⁸ m2/Vs) the surface
conductance for actin ( ) can be calculated to be 0.19x10⁻⁸ S. For an ellipsoid with axes
a>>b=c, the surface conductivity is given by (O’Konski, 1960)
b ks = 2 [7]
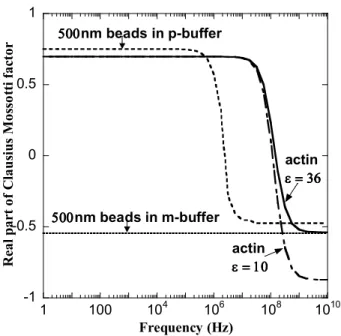
Using the above equation, we can calculate the surface conductivity of actin to equal 0.95 S/m. By assuming a negligible internal conductivity kint for actin, the particle conductivity of actin from (Eq. [6]) is 0.95 S/m. With a conductivity of 0.95 S/m and permittivity ranging from 10 0 to 36 0, we obtain an approximate value of Clausius-Mossotti factor for actin. Figure 2.1 shows a plot of the Clausius-Mossotti factor for actin in M-buffer with m= 78 0,
m= 0.56 S/m, as measured for M-buffer, p= 10 0 and 36 0, p= 0.95 S/m, as calculated for actin. Also superimposed on this graph is the Clausius-Mossotti factor for 500 nm beads in Phosphate buffer (P-buffer) and M-buffer. For the beads the values used were p= 2.55 0,
-1 -0.5 0 0.5 1
1 100 104 106 108 1010
actin
= 36 = 36= 36 = 36
actin
= 10 = 10= 10 = 10 500
500500
500nm beads in p-buffer
500 500 500
500nm beads in m-buffer
Frequency (Hz) R ea lp ar t of C la u si us M os so tt if ac to r
Figure 2.1. Plot of real part of Clausius-Mossotti factor versus frequency for actin in
M-buffer and 500 nm beads in P-M-buffer and M-M-buffer. The values of dielectric constants used in
the graph are, for actin p = 10 0&36 0, p =0.95 S/m, for the beads p = 2.55 0, p =0.01
S/m, for P-buffer m= 78 0, m= 0.001 S/m, for M-buffer m= 78 0, m= 0.56 S/m. 500 nm
beads in P-buffer have a cross over frequency of 1 MHz. Actin is expected to experience
positive DEP at all frequencies < 100 MHz and negative DEP at all frequencies >100 MHz in
M-buffer. 500 nm beads on the other hand experience only negative DEP in M-buffer.
From Figure 2.1, for the buffer used in our experiments, the Re{fCM( )} for actin is
approximately 0.7 for frequencies less than 1 Mhz and reduces to zero at around 100 Mhz.
This range of values will be assumed for all further calculations.
2.2 Dielectrophoretic trapping and electro orientation
The DEP force is proportional to the size of the particle. For small particles the DEP
has to exceed thermal energy. A dipole in a field has an energy given by (Washizu, 1994)
( )
{
}
22 Re
6 m CM rms
dep r l f E
E = [8]
The condition for trapping is given by
( )
{
f}
E kTl
r m CM rms
2 3 Re
6
2
2 [9]
( )
{
CM}
m rms f l r kT E Re 6 2 3 2 [10]A dipole in an electric field orients with its axis parallel to the field lines. The torque that acts on the dipole to align it is given by
E P
Te = ×
[11]
In rectilinear coordinates, the x component of the torque is given by
( )
( )
[
*]
, 0 * , 0 Re 2 1 y z eff z y eff ex P E P E
T = [12]
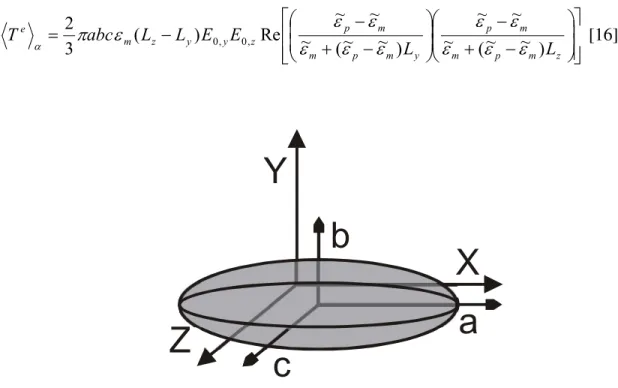
For an isotropic ellipsoid of dimensions a > b > c (Figure 2.2), the axial components of the
effective dipole moment due to the dielectric ellipsoid is (Stratton, 1941; Jones, 1995)
x x p m m m p m x eff
E
)L
2
2
(
2
2
2
2
3
abc
)
(P
!
"
+
=
~
~
~
~
~
3
4
[13]Where Lx is the depolarization factor defined by an elliptical integral
(
) (
(
)(
)(
)
)
#
$ + + + + =0 2 2 2 2
2 s a s a s b s c
ds abc
(
)
(
)
(
)
#
%% & ' ( ( ) * += 0 2
0 2 2 2 ~ ~ ~ ~ ~ Re 4 + + +d Sin E l r W m p m m p
m [15]
The (Peff)y and (Peff)z are of similar form. Combining these equations, the x component of
torque equals ! " % % & ' ( ( ) * + % % & ' ( ( ) * + = z m p m m p y m p m m p z y y z m e L L E E L L abc T ) ~ ~ ( ~ ~ ~ ) ~ ~ ( ~ ~ ~ Re ) ( 3 2 , 0 , 0 [16]
a
b
c
X
Y
Z
Figure 2.2. Elliptical particle with axes a > b > c aligned along the coordinates.
The torque equations reveal that the particle will attain equilibrium if any of its axes is
aligned with the electric field as the torque acting on the particle becomes zero. However,
stable equilibrium is when the energy of the dipole in the field is a minimum. For particles
with no dielectric loss, the stable equilibrium is when the longest axis is aligned parallel to
the electric field. For a homogenous dielectric particle with loss, the axis of stable
equilibrium is dependent on frequency. For a prolate spheroid like actin (a >> b = c; a = half
to the electric field can be calculated to be (Stratton, 1941; Talbott and Stefanakos, 1972;
Jones, 1995)
(
)
[
]
(
~ ~)
2+) ~ ~ ( ~ ~ ~ Re 4 2 || 2
2 E Sin
L l r T rms m p m p m m p m prolate e ! " % % & ' ( ( ) * + +
= [17]
Where ! " % & ' ( ) *
= 42 ln 2 1 2 || r l l r
L [18]
rand lare the radii and the length respectively. For a needle shaped particle like actin where
l >> r, L| | << 1. The expression for torque reduces to
{
( )}
2+Re
4 r2l K E2 Sin
T m rms
prolate e = [19]
(
)
(
)
(
)
%% & ' ( ( ) * + = m p m m pK ~ ~ ~
~ ~ Re )} ( Re{ 2 [20]
For the buffer used in the experiments and the previously calculated values of dielectric
properties of actin, Re{K( )} is a constant till 10 MHz and equal to 0.2. The work done by
the torque in aligning the particle parallel to the field is given by
#
= 0 + + d TW e prolate [21]
Where, + is the angle of inclination of the dipole with the electric field. Integrating and
applying maximum limits of + = /2 to + = 0, we get
(
)
(
)
(
)
22 2 ~ ~ ~ ~ ~ Re 4 rms m p m m p m E l r
W %%
& ' ( ( ) * +
= [22]
To produce a torque capable of aligning the filaments, this work must exceed the thermal
bound to myosin on a surface, the filaments are allowed only one degree of freedom and
hence
(
)
(
)
(
)
E kTl r rms m p m m p m 2 1 ~ ~ ~ ~ ~ Re 4 2 2 2 % % & ' ( ( ) *
+ [23]
(
)
(
)
(
)
%%& ' ( ( ) * + = m p m m p m rms l r kT E ~ ~ ~ ~ ~ Re 4 2 2 2 [24]3. Materials and Methods
3.1 Electrode Fabrication
Quadrupole microelectrodes (Huang and Pethig, 1991) were fabricated on glass slides
using standard photolithography techniques. Clean glass coverslips are rinsed with acetone
and methanol and blow dried with a stream of nitrogen and plasma cleaned for ~15 minutes.
Su-8 photoresist is spin coated onto the glass at 4000 rpm and for 60 seconds, then placed on
a hotplate set at 115 C for 1 min. The samples are then exposed to UV light in the mask
aligner loaded with the chrome mask. A mixture of 2:1 1813 developer to water is prepared
in a beaker and the samples are waved gently in it for 1 min, rinsed with water and gently
dried with nitrogen. A 10 nm chrome seed layer followed by a 100 nm gold layer is
evaporated onto the samples in the thermal evaporator. The samples are then soaked in
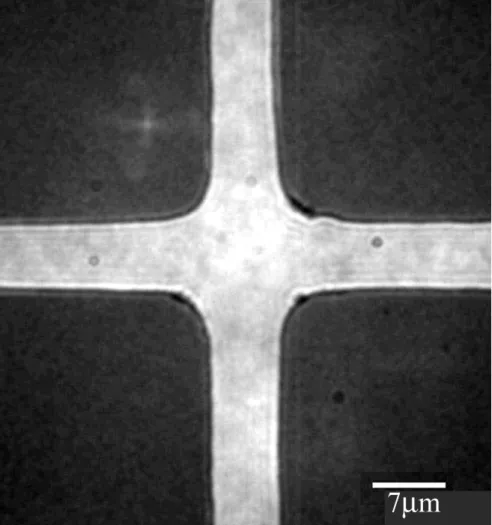
acetone for 15 mins and sonicated until clean. Figure 2.3 shows a transmission optical
Figure 2.3. Bright field transmission micrograph of quadrupole electrodes fabricated on
glass (100x objective). The metal electrodes appear dark. Distances between adjacent
electrodes were 7 µm and the diagonal electrode separation was 12 µm.
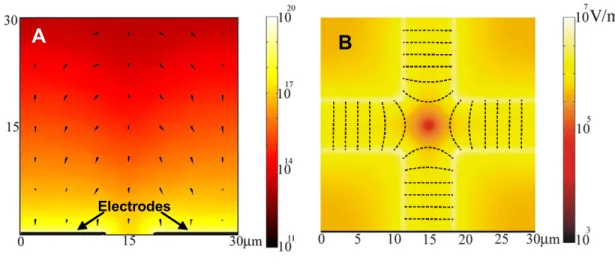
Electric field simulations of the electrode geometry were performed using FEMLAB
(Comsol Group) with MATLAB (Mathworks). Figure 2.4A shows a side view of gradient of
the square of the electric field in a 30micron volume above the electrodes. Figure 2.4B shows
the field distribution just above the electrodes. In both simulations two of the opposing
A
Electrodes
BB
A
Electrodes
A
Electrodes
BB
BB
Figure 2.4. A. The simulated electric field square gradient (, force) in V2/m3 in YZ plane at
the edge of the electrodes. Simulations were performed in a 30 micron volume above the 200
nm thick electrodes. The arrows point in the direction of the DEP force indicating that
particles will be pulled down towards the electrode tips B. The simulated electric field
strength (V/m) in the XY plane just above the electrodes. This simulation shows high field
around the electrode edges and a low field minimum at the center of the geometry. When
particles experience positive DEP they are trapped at the edge of the electrodes. When they
experience negative DEP, they collect at the center of the geometry. The dotted lines indicate
field lines. When actin filaments are trapped, they align parallel to these field lines.
3.2 Preparation of proteins
G-actin and Myosin V(Cheney 1998; Cheney et al., 1993) were stored at –770 C. The
globular monomer (G-actin) was polymerized by mixing G-actin and high salt concentration
M-buffer in a 1:1 ratio by volume. F-actin (filamentous actin) was then labeled with
fluorescently tagged Alexa-phalloidin 488 (Molecular Probes). Myosin V was in
experiments. All proteins were diluted to required concentrations in M-buffer consisting of
10 mM MOPS, 75 mM KCl, 2.5 mM MgCl2, 2 mM DTT, 1 mM EGTA, adjusted to pH of
7.2 with KOH. The conductivity of the buffer was measured using Acumet Basic AB30
conductivity meter, and found to be 0.56 S/m. 500 nm carboxylate modified polystyrene
beads (Molecular Probes) were also diluted to 1 in 40000 by volume in the M-buffer.
3.3 Experimental setup
Flow chambers (22 mm x 22 mm x 60 µm) were constructed on the electrode slides
with PDMS spacers and a cover slip. AC fields were generated by connecting the electrodes
to Tenma 2 MHz sweep function generator for frequencies below 2 MHz and a Fluke 6039A
frequency generator for frequencies in the range 2-30 MHz. The experiments were observed
using a Nikon Diaphot 200 inverted microscope with epi-fluorescence attachment. Images
were collected using a Spot 2 cooled-CCD camera (Diagnostic instruments inc.).
3.4 Motility assay
Globular monomeric actin (G-actin) and myosin V were purified by previously described methods (Cheney, 1998) and were stored at –77C. G-actin was polymerized by mixing G-actin and M-buffer in a 1:1 ratio by volume. F-actin (filamentous actin) was then labeled in a 1:1 ratio with fluorescently tagged Alexa 488-phalloidin (Molecular Probes). Myosin V was stored in concentrations varying from 200-500 µg/ml and was diluted to required concentrations before experiments. All proteins were diluted to required concentrations in M-buffer consisting of 10 mM MOPS, 75 mM KCl, 2.5 mM MgCl2, 2 mM DTT, 1 mM EGTA, adjusted to pH of 7.2 with KOH. Assays are performed in flow chambers made by placing double stick tape as spacers between 2 coverslips. This allows us to flow in the different proteins in the following order. First, low concentrations of BSA (10
concentration of BSA (2 mg/ml) to completely block the surface. Filamentous actin at (10 nM) is flowed in next. Finally, ATP at 2 mM is flowed in to start motility. A free radical scavenging system consisting of dextrose, glucose oxidase and catalase was added to the ATP to reduce photobleaching.
4. Results
4.1Patterning of Actin
40 µl of 10 nM actin was flowed into the chamber and the electrodes were energized.
Two of the opposing electrodes were grounded and the other two connected to a 10 Vpeak-peak
(7Vrms) AC source. DEP of actin was observed from 100 KHz up to 30 MHz. At these
frequencies and voltage, the actin filaments underwent positive DEP and collected in the high
field regions of the quadrupole geometry. The actin filaments were oriented with the long
axis parallel to field lines. No other axial alignment was observed in the frequency range of
these experiments. We also observed actin filaments aggregating end to end. Figure 2.5
shows actin filaments collecting at the electrodes in an aligned manner at 1 MHz and 7 Vrms.
We note that shorter filaments did not collect at the electrodes, although, they could be seen
undergoing Brownian motion in the solution above the electrodes. To compare the dielectric
properties of actin with that of polystyrene beads, DEP of beads and actin were observed
from 100 KHz to 30 MHz and 7 Vrms. In this frequency range, actin filaments underwent
Figure 2.6. Epifluorescence image of actin filaments (green fluorescence) attracted to high field regions (positive DEP) and beads (red fluorescence) attracted to low field region (negative DEP) in M-buffer. The electrodes appear dark. The AC field was at 2 MHz and 7 Vrms. This is consistent with our theoretical prediction plotted in figure 2.1.
4.2 Actin alignment during motility
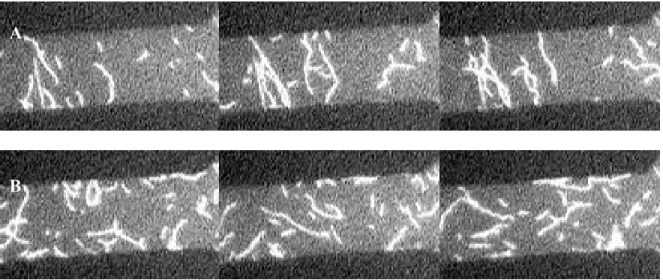
motility. They continued to glide on the myosin in an aligned manner as long as the field was on. The torque on actin maintained the parallel alignment of the filaments. The random movement of actin on the substrate changed to a collimated movement between electrode edges (Figure 2.7A). When the DEP force was turned off the actin filaments continued random motion over the myosin bed (Figure 2.7B).
Figure 2.7. Epi fluorescent images of actin motility between quadrupole electrodes. One of the four sections of adjacent electrodes is shown above. Electrodes appear dark. The figure on top shows actin motility on myosin substrate when the electrodes are energized. Longer filaments are aligned perpendicular to the electrode edges during motility. The figure on the bottom shows actin motility on myosin substrate when the electrodes are turned off. Filaments undergo motility in random directions. Each image in the sequence is 15secs apart. 5. Discussion
Filaments can be trapped only if their potential due to DEP forces exceeds thermal energy. To estimate the electric field required to trap actin filaments of a given length, we compared the electric potential energy for actin to its thermal energy. The Figure 2.8 shows
A
the result of this comparison. With field strengths of approximately 1.5x10⁶V/m as applied in our experiments, it is theoretically possible to trap actin filaments of length greater than 1 µm. This is consistent with what was observed. When AC fields of frequency ranging from
100 KHz to 30 MHz and 7 Vrms was applied to polystyrene beads in M-buffer, they underwent negative DEP where as actin underwent positive DEP (Figure 2.6). This is consistent with our calculation that the dielectric properties of actin are much higher than that of polystyrene beads. The theoretical plot of Clausius-Mossotti factor for actin and beads in Figure 2.1 also supports the experimental results. Actin filaments can be successfully trapped using dielectrophoresis. With field strengths of 1.5x10⁶V/m applied in our experiments, it is possible to trap filaments of length greater than 1 µm (Figure 2.8).
0 1 106
2 106
3 106
4 106
5 106
0 1 2 3 4 5 6 7
Re{Fcm(w)=1.0
Re{Fcm(w)}=0.5
Maximum electric field
E
le
ct
ri
c
fi
e
ld
(V
/m
)
Actin Length (microns)
Figure 2.8. Plot of minimum electric field required to trap actin filaments of different
lengths. At a frequency of 1 Mhz, The real part of Clausius-Mossotti factor ranged from 0.5
1.5x10⁶ V/m indicated by the dotted line. Filaments shorter than a micron require field
strengths greater than 1.5x10⁶ V/m, therefore they cannot be trapped.
We also observed actin filaments aggregating end to end, possibly due to dipole-dipole
interactions. Potentially, this could be used as a method to build very long tracks of actin.
According to our calculations where we presumed a high surface charge (figure 2.1), actin is
a polyelectrolyte with high polarizability, more polarizable than polystyrene beads. This
theoretical prediction is supported by our observation that actin underwent positive DEP in
M-buffer while the beads underwent negative DEP (Figure 2.6). Consequently, negative DEP
of actin was not observed within the frequency range of the experiment. Frequencies higher
than 30 MHz might be necessary and are not within the range of our instruments. Further,
these experiments demonstrate the capability to separate particles of different dielectric
properties by DEP (Morgan et al., 1999).
Even on a random myosin substrate the motility of actin filaments can be patterned
by electro orientation due to the torque acting on the filaments. The shorter filaments
however, did not respond to the field induced torque and continued to move in random
directions (figure 2.7). To estimate the field strength required to align actin filament of a
given length, the energy required to align a filament was compared to the thermal energy of
the filament. Figure 2.9 shows a plot of this calculation. With the field strengths applied in
our experiments, it is possible to align actin filaments longer than 1µm. From Figure 2.4A
the simulated value of the gradient of the electric field at the electrode edges is equal to 1020
V2/m3. At this gradient, the positive DEP forces acting on actin filaments of 1 micron length
known to be 3 pN (Mehta et al., 1999) Therefore, DEP forces are not expected to be capable
of stalling motility. However, DEP torque was observed to align actin during motility.
0 1 106 2 106 3 106 4 106 5 106
0 1 2 3 4 5 6 7
Re{K(w)}=.5
Re{K(w)}=.1
Maximum electric field
E
le
ct
ri
c
fi
el
d
(V
/m
)
Actin Length (microns)
Figure 2.9. The minimum electric field strength required to align actin filaments of different lengths along field lines during motility. The values of torque calculated are for actin filaments initially inclined at a 900angle to field lines. The calculated K( ) value for actin at 1Mhz ranges from 0.1 to 0.5. The maximum electric field strength obtained using the quadrupole geometry equals 1.5x10⁶V/m indicated by the dotted line. Filaments shorter than a micron require field strengths greater than 1.5x10⁶V/m, therefore they cannot be aligned.
The torque acting on the filaments reduced the randomized movement of actin on
myosin substrate to a collimated motion. Actin moves on a myosin substrate with its
structurally negative end as the leading end. During motility, the filament length beyond the
last bound myosin is free to undergo Brownian fluctuations. Hence the next myosin that the
leading edge binds to lies anywhere in the area swept by the free end. Normally this leads to
motility, the torque on the filament suppressed Brownian fluctuations of the free end.
Theoretical calculations show that the work done by the torque to align filaments longer than
1 µm is greater than Brownian motion and the filaments were forced to move on myosins
that lie along the field lines (Figure 2.7).
6. Conclusion
So far, positive DEP and electro-orientation torques were observed to align actin
parallel to field lines. To exert greater control over patterning and motility, negative DEP and
perpendicular alignment of filaments would be required. Kriegmaier et al. (Kriegmaier et al.,
2001) have observed different electro-orientations of fission yeast at varying frequency of
applied fields. Higher frequencies are expected to be necessary for both these experiments.
Not only is DEP a novel way to manipulate actin filaments, it offers many practical utilities.
Substrate patterning of actin by DEP to lay pathways for motor motility can be achieved by
designing electrodes that generate appropriate electric field patterns. Dielectrophoresis as a
technique for patterning and maneuvering filaments is an important step towards
biomolecular integration with NEMS. DEP can be combined with physical and chemical
barriers for actin/myosin movement and to direct their motion in microfluidic channels.
Alternatively, motors can be manipulated in these channels by polarizing the cargo they
carry, as they move over fixed filaments. Beads have been attached to myosin, actin and
other motor proteins successfully. Coating these beads with therapeutic drugs and using
motor proteins to deliver them to cells by using endogenous ATP to fuel the system would be
CHAPTER III
PREFACE
1. Introduction
The effects of viscous drag in biological systems have been measured previously by performing motor motility assay in viscous solutions (Hunt et al., 1994), applying fluid shear stress on lamellipodia (Hu et al., 2002), analyzing flow effects on microtubule rigidity (Venier et al., 1994) and regulating platelet adhesion to fibrinogen (Litjens et al., 2003 ). The latter three have been studied under quantified flow conditions. Additionally, Spudich et al
observed the movement of myosin-coated beads on fixed actin filaments whose orientation was determined by flow during attachment (Spudich et al., 1985). Stracke et al have aligned motile microtubules in a flow cell using fluid flow (Stracke et al., 2000). However, a quantitative analysis of fluid flow and its effects were not performed. To observe and quantify effects of force and torque due to drag on such systems, in vitro motility assays with actin filaments on motor protein myosin V under controlled flow conditions was performed. These experiments showed that drag forces significantly lower than motor forces can generate torques on the filaments and steer them during motility. Flow reduces the extent of thermal fluctuations of actin due to the preferential orientation imposed by the torque acting on them. Combined with motors, flow can thus polarize an initially random distribution of filaments, and in the process may aid in organization of the cytoskeleton.
and Stewart, 2000;Soong et al., 2000). In the “lab-on-a-chip” or micro-total analytical system (µ-TAS) motif, a single device consists of control electronics, chemical and physical barriers, all typically integrated in microfluidic channels. Further integration of biomotor functionality in microfluidics and control electronics may play an important role in using filaments as transport, separation and force sensing systems in µ-TAS.
assumed due to the low torsional stiffness of molecular motors (Hunt and Howard ,1993; Mehta et al., 1999). The path of a filament is thus characterized by periods of linear motion (when bound to multiple motors) and rotational diffusion (when bound to a single motor) and the filament becomes uncorrelated in alignment when bound to a single motor. When external flow is present, a restoring torque acts on the actin filaments and reduces (Kapitein et al., 2005) the amplitude of oscillations due to rotational diffusion. The extent of the flow alignment for a particular assay depends on both the filament properties like average length and rigidity as well as inter-motor spacing.
In the following work, we present a model for the flow alignment of filaments by analyzing the torque due to flow acting on filaments (rods) rotating on motors (pivots). Our experimental results show that drag forces significantly lower than motor forces can generate torques on the filaments and align them during motility and that the filament alignment increases with an increase in flow rate. We reason that filaments are more susceptible to flow alignment when bound to a single motor and our model is based on this assumption.
2. Materials and methods 2.1 Microfluidic flow cell
procedures. Microfluidic channels were produced by curing liquid poly-dimethylsiloxane (PDMS, Dow-Corning Sylgard 184) against the photolithographed master (Figure 3.1).
Figure 3.1. Steps to generate microfluidic channels involved Photolithography, replica molding and sealing. The Photomask was designed using the CorelDraw (Corel) computer drawing package printed on transparency. Standard photolithographic procedures were used to generate a positive relief of a thick photoresist (SU-8 2050) on silicon wafers. Microfluidic channels were produced by curing liquid poly-dimethylsiloxane against the master. The channels were peeled out and fluidic connections were punched out of the PDMS with a sharpened metal tube.
seconds with the channel side facing up. Upon removing them from the plasma, we placed the PDMS and the coverslip immediately into contact to form an irreversible seal. Teflon tubing was inserted into the punched out reservoirs and connected through Teflon 4 port micro valves to a syringe operated by a syringe pump. The fluid circuit was set up as shown in Figure 3.2. When port 1 and 2 are connected, fluid flows into the channel through reservoir 1 (R1), then out to waste through ports 3 and 4. To reverse the direction of flow in the channel the knob of the 4-port valve is rotated 90 degrees. This connects port 1 to port 4, and fluid flows through reservoir 2 (R2) into the other end of the channel, reversing the flow back out through ports 2 and 3.
The Reynolds number (Re), a dimensionless quantity provides information on whether the flow in the channel is laminar or turbulent (Guyon et al., 2001). We calculated Re using the
formula
-.DhUavg
=
Re to be of order unity for density .=1000 kg/m3, viscosity -= 10-3
Ns/m2 for water, the highest average flow velocity Uavg = 9*10-3 m/s and the hydraulic diameter of our rectangular channel Dh=111 µm. This is far less than the critical Reynolds number of 2300 below which laminar flow conditions are maintained in the channel. The
velocity profile for laminar flow in the channel is given by y
(
D y)
DU
U avg
y = 2
6
[1], where
Uy is the velocity at a height yin the channel in terms of the average velocity in the channel (Uavg) and height of the channel (D)(Guyon et al., 2001 ). We observe that upon stopping the flow with our valve system, the fluid velocity becomes zero faster than our data acquisition rate. This fast shutoff ensures that the fluid velocity is zero for the subsequent movie frames and is important for our calculation of persistence time of filament orientation.
2.2 Preparation of surfaces
Table 3.1. The above table shows the drag force on a 1.1 micron long filament aligned parallel and perpendicular to flow at different flow rates. The average velocities are calculated from our measured volumetric flow rate using our channel dimensions (60 µm height, 750 µm wide). The local velocities are calculated assuming laminar flow in the channel, at the indicated height above the surface.
2.3 Estimation of surface motor density
It is important to know the surface density of the myosin motor proteins on the surface to gain insight of the dynamical model of the motility assay. To set a bound on this quantity, we injected pre block BSA and myosin into the channel as explained in the methods section. The channel was then flushed three times with 100 Ols of buffer to remove non- adherent proteins. The proteins bound to the channel surfaces were then eluted with high concentrations of SDS and the outflow was collected. A western blot of 2µl samples of the outflow from concentration ranging from 1:1 to 1:1024, at 1-1/2 serial dilutions were performed against myosin V antibody on a nitrocellulose membrane. A positive control of 2Ol samples of myosin V from 1 µg/ml to 1 ng/ml, at 1-1/2 serial dilutions and a negative control of BSA was blotted on the same membrane. The signal from the outflow, on
Channel Average Velocity(mm/s)
Local velocity at
120nm (Om/s) Local velocity at 20nm (Om/s) Drag force || at 20nm (pN) Drag force /120nm (pN) at
1.85 24.2 4.0 0.012 0.081 3.7 48.4 8.0 0.024 0.16 5.55 72.7 12.1 0.036 0.24
myosin V dimers in the channel which equates to a motor density of 280/µm2. Since some of the motors, upon contact to the surface, lose their enzymatic activity, the over all density of working motors might be significantly lower than our estimate of 280/µm2 through Western blot.
2.4 Data acquisition and analysis
The experiments were observed using a Nikon Diaphot 200 inverted microscope with epi-fluorescence attachments, and images were collected using a Spot 2 cooled-CCD camera. MetaMorph (Universal Imaging Co.) was used to operate the camera, perform image processing and analysis. Frame capture rate of our camera was one frame every 3 seconds. A Matlab code custom written in our lab was used to obtain the angular alignment of filaments. The program allows the user to choose 2 points in the image. An output file is generated with the length and angle subtended by the line joining these 2 points. The angle subtended by the straight line joining the tail end and the leading end was measured as the angular alignment of the filament. Flow direction was taken as the reference for += 0.
3. Theory
3.1 Theoretical analysis of sliding filament assay
perform an analysis on the assay similar to Duke et al’s analysis of the kinesin- MT motility assay. The motors are assumed to be randomly deposited on the surface with a surface concentration of .The motors are assumed to be capable of reach isotropically over a distance w = 60nm (half height of m5) to interact with the actin filaments. The actin filaments are considered to have a persistence length of Lp=17 µm (Gittes et al., 1993), filament length of L=1.1+/-0.2 µm, and an average speed v=276±70 nm/s and diffusion parameter 2=k3/-. Here k is the Boltzmann constant, T, the temperature and -the viscosity of the fluid. Suppose that the length of the leading end of the filament beyond that last bound motor is l, and explores an area A(l) of the surface to bind motors. (i) For short l, there is no appreciable bending and only motors in the path w of the filament bind to it and hence the area A~wl. (ii) For intermediate lthe filament can bend due to thermal agitation given by +eq ~ (l/Lp)1/2 , such that A~l2+eq ~l5/2 Lp-1/2 . (iii) For long lthe end can bind a motor and advance forward before it bends to +eq and thus A ~ l2+ ~ (2/v)1/2l. For the three regimes, the mean distance dis specified by the condition A(l = d ) = 1. The d values for the three regimes are 5 6 5 7 8 >> >> >> >> , * * , ) / ( *, * * , *, , ~ 2 / 1 1 5 / 1 5 / 2 1 1 2 v L w d p
The boundary values for the regimes are *~w-5/3p-1/3 = 86/µm2 and **~(2/v)-5/6p-1/3 =0.04/µm2 for our assay. When a single pivot is positioned anywhere on the filament of
length L with equal probability, the area = 2 :+
3 1
L
A . For a given inter motor spacing d,
between successive rotations (when bound to multiple motors) can be calculated using the
formulas :+ =3 1L2 and
%% & ' (( ) * + + = d L e L d d L d L s d L 1 3 2 2
respectively. The persistence
length Pof path of the filament can be calculated as
1 2 1 % % & ' ( ( ) * : + = s L
P p + . Four time scales
can be defined for the motility of an actin filament, ;linear, ;rot, ;diff and, ;. We can define the path of a motile filament in terms of the time required for each of the individual steps. The time duration of linear motion of a filament (;linear) is the time of linear motion or travel between successive rotations. The filament is bound to multiple motors during this time. The time for rotational motion (;rot) is the time that the actin filament is bound to a single motor and undergoes rotational diffusion before binding more motors. The rotational correlation time (;diff) is the time required for an actin filament bound to a single motor to become uncorrelated via free diffusion in the absence of motors nearby. The persistence time (;) is the time taken by the filaments to become uncorrelated, or lose memory of their previous alignment. These time scales provide useful information about the motors and filaments and the assay in particular.
;linear is the time of travel between successive rotations and equals
v s
=
linear
; [3]. According to
the differential law for Brownian motion, the mean square angular random deviation of the infinitesimal angle :+ by which a vector bound to a particle rotates in a plane during the time interval :t is given by :+2 =2Drot:t, where, the rotational diffusion coefficient is
given by %
& ' ( ) * + = r h Cosh L L kT
Drot 1
3 2 3 1 ) ( 4 3
pivoted at a distance L1from one end.. The mean angle of swivel when fastened to one motor equals :+ =3 1L2. Hence, the time (;rot) that the actin filament is bound to a single motor and undergoes rotational diffusion before binding multiple motors is given by
1 4 2
2 9
= rot
rot L D
; [4]. The anisotropy of an initially oriented population of particles, decays
exponentially with a rotational correlation time ;diff (Carrington and McLachlan, 1967) given
by
rot diff
D
3 1 =
; for one degree of rotational freedom [5].
3.2 Alignment energy of filaments
The energy of alignment of a filament is a sum of the energy of state of motors attached to it, energy of bending of filament and the drag force acting on the filament. Motors can be considered as springs with very low torsional spring constants and hence the energy due to motors can be neglected. The average length of filaments in our assay equaled 1.1Om, well below the persistence length of actin (17Om). Hence thermally induced filament shape fluctuations are minimal. The bending rigidity of the filament is higher than the rotational rigidity of the motor. When a torque is applied to a filament bound to a single motor, it will rotate about the frictionless pivot like a rigid rod. Thus, for the purpose of our model, when a filament is bound to a single motor, we can consider the filaments to be rigid and assume alignment takes place due to motor rotation rather than due to filament bending.
3.2.1 Energy of a filament bound to single motor
#
= 0 ( )+
+ +
; d
W
where, ;is the torque acting on the rod. Assuming the drag force acts at the center of mass of
a uniform rod, the torque about the pivot point is
2 )
(+ = F×L
; , where F is the drag force
and Lis the length of the rotating end of the rod. When a rod pivots about a point such that L1 and L2 are the length of the subunits, the clockwise and counter clockwise torques equal
2 ) ( 1 1 1 L F × = + ; and 2 ) ( 2 2 2 L F × = +
; . The net torque equals ; =;1 ;2. The drag
coefficient of a cylinder at a height h above the surface with its long axis perpendicular to direction of motion
% & ' ( ) * = r h L FD 1 cosh 4
-The velocity perpendicular to filament is v sin+. The torque on a rod about its pivot is then equal to ) ( cosh ) ( sin 2 ) ( 1 2 2 2 1 r h L L v = - + + ;
The work done against flow while rotating to an angle +is given by
#
=+ - + + 0 1 2 2 2 1 ) ( cosh sin ) ( 2 d r h v L L W( )
) ( cosh ) cos 1 ( ) 2 ( 2 1 2 1 r h v L LL EW = f + = - + [6]
3.2.2 Energy of a filament bound to multiple motors
When a filament attaches multiple motors, it is pinned down at motor locations and the leading end of the filament is susceptible to thermal fluctuations (figure 3.3).
Figure 3.3. Schematic of a filament of length L bent an angle . The length of the subunit beyond the last point of motor attachment is L1.
Its energy is the sum of elastic restoring force of bending as well as drag. The elastic energy
of the filament is given by
( )
22 1
ds k
Es = where k is the spring constant of the filament and ds
the deflection. 3 1 3
L KT L
k = p where, L
1 is the length of bending end the filament, Lp is the
persistence length and K is the Boltzmann constant, T the temperature and ds=Lsin<.
ds
L
L1
<
3 1 2 2 2 sin 3 L kTL L
Es = p < [7].
Using eqn. [7] we can calculate that a 1 micron actin filament pinned at the center will bend by a maximum angle of 20. The drag force acting on L1 equals
) ( cosh ) cos 1 ( 2 1 2 1 r h v L
Ed = - +
The total energy equals
( )
) ( cosh ) cos 1 ( 2 2 sin 3 1 2 1 3 1 2 2 r h v L L kTL LEf + = p < + - + [8]
If the filament were flow aligned before bending, then <=+. 4. Results
Actin filaments in the channel adhered to the myosin substrate and were motile in the
presence of ATP. Individual actin filaments (n~15) were tracked with MetaMorph imaging
software. The average filament velocity was found to be 276±70 nm/s, equal to the
processive motor velocity of myosin V as previously observed at this ATP concentration of
2mM (Mehta et al., 1999). When external flow was applied at velocities given in table 3.1,
the filaments continued motility at normal velocities (Figure 3.4). The flow in the channel
did however orient the actin filaments and steer them in the direction of the flow (Figure 3.5).
The filaments that started to move against flow were observed to turn in the direction of the
Figure 3.5. The top left image, colored green, shows the fluorescent actin filaments in one frame (t=0), while the image below, colored red, is the filament image one frame later (t=3s). The composite, color combined image shown at right, is an overlay of these two images. The motile actin filaments are seen as colored green to yellow to red and non-motile filaments are entirely yellow in color. The red end is the leading end and the green end the trailing end of a filament. A large percentage of the filaments have their leading end pointing downstream. This shows that flow aligns motile filaments downstream.
We generated histograms of the distribution of the filament alignment at different flow rates (Figure 3.6).
Figure 3.6. The probability distribution of alignment of filaments measured from
experiments for different flow rates is plotted above (squares). The solid lines are curve fits
of equation 6 to the experimental data. The histograms of filament alignment have a peak at -100-50 0 50 100 150 200 250 300
0.00 0.02 0.04 0.06 0.08 0.10 0.12 P ro b a b ili ty d is tr ib u tio n
Angle in degrees
60µm/sec
-100 -50 0 50 100 150 200 250 300 0.00 0.02 0.04 0.06 0.08 0.10
0.12 48µm/sec
P ro ba bi lit y di st rib u tio n
Angle in degrees
-100-50 0 50 100 150 200 250 300 0.00 0.02 0.04 0.06 0.08 0.10 0.12 P ro b a b ili ty d is tr ib u tio n
Angle in degrees
36µm/sec
-100-50 0 50 100 150 200 250 300 0.00 0.02 0.04 0.06 0.08 0.10 0.12 P ro b a b ili ty d is tr ib u tio n
Angle in degrees
12µm/sec
-100-50 0 50 100 150 200 250 300 0.00 0.02 0.04 0.06 0.08 0.10 0.12
Angle in degrees
24µm/sec
P ro b a bi lit y di st ri b ut io n
-100 -50 0 50 100 150 200 250 300 0.00 0.02 0.04 0.06 0.08 0.10 0.12 P ro b a b ili ty d is tr ib u tio n