The University of Tokyo, Kashiwa, Chiba 277-8583, Japan 3
Graduate School of Science, Osaka University, Toyonaka, Osaka 560-0043, Japan 4
Faculty of Integrated Arts and Science, University of Tokushima, Tokushima, 770-8502, Japan 5
Department of Physics and Astronomy, University of Alabama, Tuscaloosa, Alabama 35487, USA 6
Physics Department, University of California, Berkeley, California 94720, USA 7
Lawrence Berkeley National Laboratory, Berkeley, California 94720, USA 8
Department of Physics and Astronomy, University of Hawaii at Manoa, Honolulu, Hawaii 96822, USA 9Massachusetts Institute of Technology, Cambridge, Massachusetts 02139, USA
10
Department of Physics and Astronomy, University of Tennessee, Knoxville, Tennessee 37996, USA 11
National Research Nuclear University, Moscow, Russia 12
Triangle Universities Nuclear Laboratory, Durham, North Carolina 27708, USA 13
The University of North Carolina at Chapel Hill, Chapel Hill, North Carolina 27599, USA 14
North Carolina Central University, Durham, North Carolina 27701, USA 15
Physics Departments at Duke University, Durham, North Carolina 27705, USA 16
Center for Experimental Nuclear Physics and Astrophysics, University of Washington, Seattle, Washington 98195, USA 17
Nikhef and the University of Amsterdam, Science Park, Amsterdam, The Netherlands Received 2015 June 3; accepted 2015 December 15; published 2016 February 10
ABSTRACT
In the late stages of nuclear burning for massive stars(M>8Me), the production of neutrino–antineutrino pairs through various processes becomes the dominant stellar cooling mechanism. As the star evolves, the energy of these neutrinos increases and in the days preceding the supernova a significant fraction of emitted electron anti-neutrinos exceeds the energy threshold for inverse beta decay on free hydrogen. This is the golden channel for liquid scintillator detectors because the coincidence signature allows for significant reductions in background signals. We find that the kiloton-scale liquid scintillator detector KamLAND can detect these pre-supernova neutrinos from a star with a mass of 25Me at a distance less than 690 pc with 3σ significance before the supernova. This limit is dependent on the neutrino mass ordering and background levels. KamLAND takes data continuously and can provide a supernova alert to the community.
Key words:neutrinos –supernovae: general
1. INTRODUCTION
Thefirst extrasolar neutrinos were detected from SN 1987A by the Kamiokande-II(Hirata et al.1987,1988), IMB(Bionta et al. 1987), and Baksan(Alekseev et al. 1987) experiments. This data set has provided many insights into the properties of neutrinos and the physics of supernovae(Vissani 2015). SN 1987A was located in the Large Magellanic Cloud at a distance of ∼50 kpc. A core-collapse supernova in the Milky Way proper would provide a larger flux of neutrinos. This combined with the large suite of running neutrino experiments makes the next Galactic supernova a greatly anticipated event(Scholberg2012).
In a Type II supernova, a huge burst of neutrinos is released, carrying away∼1053erg of energy in 10 s. Leading up to this cataclysmic event, neutrinos have already been playing an important role in the cooling of the evolving giant star. Starting in the carbon-burning phase, the dominant mechanism for
cooling these massive(M>8 M)stars is the loss of energy
due to n n¯ pairs created by thermal processes. From application of the discussion in Itoh et al.(1996)to Woosley & Heger(2015), the dominant process in mostM>10 Mstars
is the pair process, e e+ -nn¯. For other stars with smaller masses, the plasmon decay becomes more important,gnn¯. Secondary contributions come from the photo process,
e e ¯
g - -nn, and bremsstrahlung,e Ze-( )(Ze e) -nn¯. These thermal processes are often used to set limits on non-standard neutrino interactions since such processes would change the evolution of these objects(Heger et al. 2009). The most stringent limits on the neutrino magnetic moment come from this type of analysis(Arceo-Díaz et al.2015).
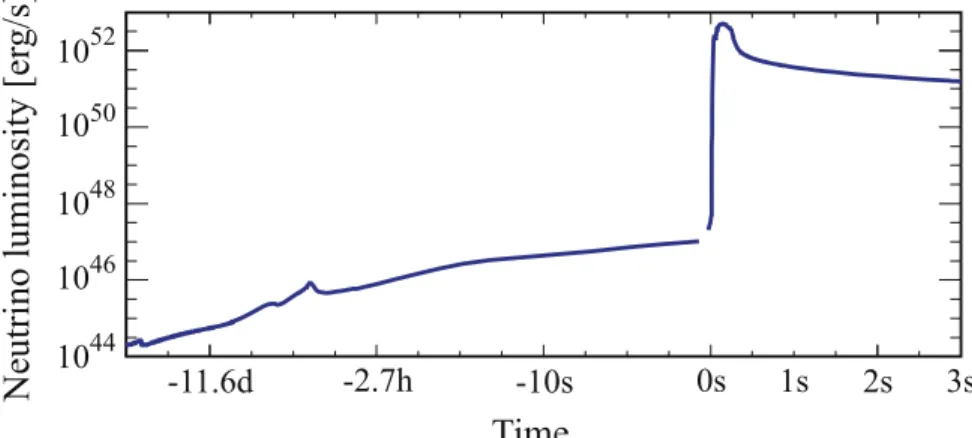
Since these thermal neutrinos precede the supernova, they can also be called pre-supernova neutrinos(pre-SN). Figure 1 shows the overall time evolution of then¯eluminosity before and
after the collapse according to the pre-SN model developed by the Odrzywolek group(Odrzywolek et al. 2004; Odrzywolek & Heger2010). The supernova neutrinos (SN) which follow the collapse based on Nakazato et al.(2013)are also shown for reference. Although the pre-SN luminosity is several orders of
18
magnitude smaller than the SN luminosity, the detection of pre-SN is desired since pre-pre-SN encode information about the late stages of stellar evolution for high mass stars and could act as a supernova alert; a more detailed discussion is found in Section 5.
SN extend to a few tens of MeV. In comparison, the average energy of pre-SN is low, typicallyE<2 MeV. In this energy range, there are three reactions that can be used to detect these neutrinos in real time: coherent neutrino scattering, neutrino-electron scattering, and inverse beta decay(IBD),
p e n
e
¯
n + ++ . IBD has one of the highest cross sections for neutrino detection. It also has relatively low backgrounds due to the easily identifiable delayed coincidence signal created by the prompt positron annihilation followed by the delayed neutron capture. Depending on the detector material, coherent neutrino scattering may have a higher cross section than IBD, but the signal has never been observed due to the very low reconstructed energy of the recoiling nucleus. The detection of pre-SN through neutrino-electron scattering is possible. How-ever, its cross section is lower than IBD, which reduces the total number of detected events, and the background rate is high since there is no coincidence signal. Thus, IBD is the most promising channel for pre-SN detection.
The energy threshold for IBD is 1.8 MeV. A few days before the supernova, a significant fraction of n¯e exceeds the IBD
threshold and it becomes possible to detect the pre-SN with IBD. IBD is the main supernova channel for both liquid scintillator detectors and water-Cherenkov detectors like Super-Kamiokande. Water-Cherenkov detectors have relatively high energy thresholds, such as Ee=4.5 MeV(Renshaw et al. 2014). This limits both the number of IBD prompt events and the efficiency for detecting the delayed neutron capture. In comparison, monolithic liquid scintillator detectors have energy thresholds below 1 MeV and are therefore able to sample a larger fraction of the pre-SN prompt energy spectrum and effectively detect the neutron capture. Thus, liquid scintillator detectors have an advantage in detecting pre-SN, even if they are smaller than typical water-Cherenkov detectors.
There are two operating monolithic liquid scintillator detectors with low-energy thresholds, KamLAND and Borex-ino(Cadonati et al.2002). The SNO+detector(Chen2008)is expected to come online soon and construction has started on the 20 kton JUNO detector(Li 2014). In addition, there are several proposals for multi-kton experiments such as
RENO-50(Kim 2014), HANOHANO(Learned et al. 2008), LENA
(Wurm et al. 2012), and ASDC(Alonso et al. 2014). All of these detectors would be sensitive to this pre-SN IBD signal. A large Gd-doped water-Cherenkov detector such as Gd-doped Super-Kamiokande(Beacom & Vagins 2004) would have increased sensitivity due to the higher neutron capture detection efficiency but the higher energy threshold continues to limit the sensitivity. The Baksan and LVD scintillator detectors are similarly limited in their sensitivity to pre-SN due to their relatively high energy thresholds(Novoseltseva et al. 2011; Agafonova et al.2015).
In previous studies(Odrzywolek et al.2004; Odrzywolek & Heger 2010; Kato et al. 2015), the expected number of IBD events in several detectors was evaluated without a detailed detector response model. We focus on KamLAND since it is currently the largest monolithic liquid scintillator detector. In this article, we quantify KamLANDʼs sensitivity to pre-SN using the actual background rates and a realistic detector response model. We discuss the development of a supernova alert based on pre-SN. Betelgeuse is a well-known possible supernova progenitor(Dolan et al. 2014) and we evaluate the performance of the pre-SN alert based on this astrophysical object.
2. Pre-SN SIGNAL
The first calculation of the number of detected pre-SN is found in Odrzywolek et al.(2004)and updates can be found in Odrzywolek & Heger(2010)and Kato et al.(2015). We use the pre-SN spectrafM(t E, n¯e;d) as a function of time and energy
from Odrzywolekʼs results corrected for the distance d to the pre-supernova star. We use this to calculate KamLANDʼs sensitivity to pre-SN with two example stars of M=15Me
and M=25Me. Figure 2 shows the time evolution of then¯e
luminosity in the top panel and the averagedn¯e energy in the
middle panel during the 48 hr before the collapse. The integratedn¯eluminosity over the last 48 hr preceding collapse
is 1.9×1050erg and 6.1×1050erg, respectively, for the two star masses. They correspond to 1.2×1056n¯eand 3.8×1056n¯e,
respectively. The weighed differential luminosity by energy,
E dL dEn¯e n¯e~dL dlogEn¯e, is also shown in the bottom of
Figure2with the SN for reference. The average energies of the integrated n¯e flux are 1.4 and 1.2 MeV for the 15Me and
25Memodels, respectively.
Figure 1.Time evolution of then¯eluminosity of pre-SN just before collapse(Odrzywolek & Heger2010)and of SN after collapse(Nakazato et al.2013). Note the
timescale of the horizontal axis, which is linear after the collapse but logarithmic before collapse.
In detectors, the reconstructed prompt(positron in IBD) spectrum can be written as,
d N t E d
dtdE E N dE t E d
R E E E
, ; , ; , , 1 M M 2 p rec p
rec live s p
rec T p exp p rec p exp e e ( ) ( ) ( ) ( ) ( ) ( ) ¯ ¯
ò
fs =
´
n
n
where NT is the number of target protons in the analysis
volume, s(En¯e) is the IBD cross section(Strumia & Vissani
2003),liveis the mean livetime-to-runtime ratio, and s Ep rec
( )
is
the total detection efficiency. The details of these parameters are presented in Section 3. Eprec is the reconstructed energy
and Ep E 0.78 MeV
exp
e ¯
= n - is the expected energy of the prompt event for an input n¯e with an energy of En¯e. The
integration in Equation (1)is a convolution of the theoretical spectrumfMwith the detector response. We model the detector response as a Gaussian with R E( prec,Epexp) with energy resolutionsE:
R E E
E
E E
E
, 1
2 exp 2 . 2
p rec p exp E p rec
pexp 2
E 2 ( ) ( ) ( ) ( ) ( ) ⎧ ⎨ ⎩ ⎫ ⎬ ⎭
p s s
= -
-Assuming pre-SN emitted from the 200 pc star and a perfect 1 kt detector with live=1, s(Eprec)=1, and
R Ep ,E E E
rec p exp p rec p exp
( )=d( - ), the event spectrum integrated over the last 48 hr preceding collapse is shown in the left panel of Figure 3. The number of arrival n¯e in the last 48 hr is 1.8´1013 for the 15M
e star and 6.5×10¹³ for the 25Me
star, respectively. The total number of pre-SN events in the detector is 44 and 95, respectively.
The right panel of Figure 3 shows the pre-SN spectrum integrating over the last 48 hr and the SN spectrum integrating over 10 s with the vertical axis of EprecdN dEprec~ dN dlogEprec. Our assumption of supernovae at 200 pc is 50 times closer than the usually assumed 10 kpc. We note that the SN from 200 pc supernovae will create ∼106 events in the detector. The current KamLAND electronics will not be able to record more than the basic hit information for the SN. The information from the pre-SN will not be lost in case of a DAQ crash.
Neutrino oscillation in the pre-SN emission region reduces the n¯e flux. The flux of the observable n¯e can be expressed
following Kneller et al.(2008)as
p 0 1 p 0, 3
e e ( ) x ( )
¯ ¯ ¯
fn = fn + - fn
where 0
e ¯
fn and 0
x ¯
fn are the original spectra ofn¯eandn¯m t, . With the assumption of 0 0.19 0
x e
¯ ¯
fn = fn based on 0 0
x e
¯ ¯
fn µfn and an n¯x ¯e
ratio of 0.19 from Odrzywolek et al. (2004), and an adiabatic approximation for p with sin2 3.08 10
12 1
q = ´
-Figure 2.Details of pre-SN with 15Mand 25Mstar models.(Top)time evolution ofn¯eluminosity,(middle)time evolution of the averagedn¯eenergy, and(bottom)
and sin2 2.34 10
13 2
q = ´ - (2.40´10-2) from Capozzi et al. (2014), we have e a 0
e
¯ ¯
fn = fn, where a =0.74 0.21( )
corresponding to the normal(inverted) neutrino mass order. The corrected spectrum for the neutrino oscillation is then given by multiplying the coefficienta. With the integral over the last 48 hr preceding collapse, the event spectrum is shown with the oscillation effect and the full detector response in the middle and bottom panels of Figure4 with KamLAND using the parameters describe in Section3.
3. KamLAND DETECTOR AND ITS BACKGROUND
KamLAND is located in the Kamioka Mine in Japanʼs Gifu prefecture (36°. 42N, 137°. 31E). Mt.Ikenoyama rises ∼1 km above the detector reducing backgrounds due to cosmic rays by five orders of magnitude. The KamLAND detector consists of approximately 1 kt of liquid scintillator, a mixture of 20% psuedocume and 80% dodecane. It is contained in a 13 m diameter spherical balloon made of a 135μm thick transparent nylon ethylene vinyl alcohol copolymer(EVOH) composite film. An array of photomultiplier tubes(PMTs) is used to detect the scintillation light from events occurring within the balloon. This array consists of 1325 fast PMTs masked to 17 inch diameter to achieve the desired timing performance and 554 older 20 inch diameter PMTs reused from the Kamiokande experiment. The PMTs are mounted on the inner surface of an 18 m diameter stainless steel sphere. Non-scintillating mineral oilfills the space between the balloon and the inner surface of the sphere. Its density is matched to the liquid scintillator to support the balloon and also acts as a passive shielding against external backgrounds from the sphere, PMTs, and surrounding rocks. This inner detector is further shielded by a 3.2 kton water-Cherenkov veto detector. In 2011, a 3.08 m diameters inner balloon containing 13tons of Xe-loaded liquid scintilla-tor(Xe-LS)was installed in the center of the main balloon as a part of the KamLAND Zero-Neutrino Double-Beta Decay
(KamLAND-Zen)experiment(Gando et al.2012).
The position and energy of an event within the balloon can be reconstructed using the timing and charge distribution
obtained from the PMT array. The reconstruction is calibrated by a number of radioactive sources:60Co,68Ge, 203Hg,65Zn,
241Am9Be, 137Cs, and 210Po13C(Berger et al. 2009; Banks
et al. 2015). From these calibrations and naturally occurring radioactive sources, the energy resolution(σE(E))is determined
to be 6.4% E (MeV) and the position reconstruc-tion12 cm E (MeV).
Candidate n¯e events corresponding to the prompt positron
annihilation and delayed neutron capture of the IBD interaction are selected with a series of cuts on the energy, position, time, and space coincidence of the two events. The two events must occur with 0.5<ΔT(μs)<1000 and within ΔR < 2.0 m, where ΔT and ΔR are the time and spatial differences. The reconstructed position of both events must be within a spherical fiducial volume Rp,Rd<6 m, which determines the fiducial number of target protons, NT=5.98×1031. The
recon-structed energy of the prompt event is required to be in the energy range Ep MeV 0.9
rec
( ) . The delayed event has an energy characterized by the energy of the neutron capture gammas. Two energies are used: 1.8 Ed MeV 2.6
rec
( )
< <
corresponding to capture on H and 4.4<Edrec(MeV)<5.6 corresponding to capture on 12C. An energy- and position-dependent likelihood variable is constructed to differentiatene
from backgrounds due to accidental coincidences, which become more likely at lower energies and as events are reconstructed closer to the balloon(Gando et al.2011). Finally, an additional position cut on the delayed event is applied to eliminate backgrounds due to the KamLAND-Zen inner balloon and support structure. The cut eliminates a central sphere and cylinder: Rd <2.5 m and xd2 yd 2.5 m
2
+ < for
zd>0 m, where(xd,y zd, d)is the reconstructed position of the delayed capture event.
This series of cuts matches the standard KamLAND analysis(Gando et al. 2013). The minimum prompt energy is chosen to guarantee 100% detection efficiency for n¯e with an
energy of 1.8 MeV. The total efficiency of these cuts, s Ep rec
( )
,
is energy dependent due to the Likelihood selection as shown in Figure4(top). The efficiency loss is dominated by the inner balloon cut. Without this cut, the efficiency is higher, ∼0.9, Figure 3.Pre-SNn¯eevent spectrum on Earth integrating over the last 48 hr preceding the collapse, assuming a distance of 200 pc and a perfect 1 kt detector. Both
panels are basically the same with the linear-scale horizontal axis(left)and the log-scale horizontal axis(right). The vertical axis in the right panel is weighted byEprec
to be~dN dlogEprec. The total number of pre-SN events in the detector is 44 and 95 for the 15Mestar and the 25Mestar at 200 pc, respectively. In the right panel,
for comparison, the weighted supernovan¯eevent spectrum integrating over 10 s are also shown. The expected number of SN events is about8´105. The effect of
neutrino oscillation is not considered.
depending on the energy of the prompt event. Further cuts are used to remove backgrounds due to high-energy muon events. The effect of these cuts is to reduce the effective livetime to
0.903 live
= even though KamLAND takes data continuously. After these cuts are applied, the measured event spectrum in the pre-SN region (0.9 Ep MeV 3.5
rec
( )
) is mainly from
reactor ne and geological ne produced in the Earthʼs interior.
These are the backgrounds to the pre-SN signal. Since the Great East Japan Earthquake, the reactors in Japan have been off. This is the low-reactor phase, and the reduced backgrounds increase our pre-SN sensitivity. The measured background spectra are shown in the middle and bottom panels in Figure4 for the low-reactor phase and the high-reactor phase. In this figure, the background spectra are normalized to the 48 hr window.
4. SENSITIVITY
The middle and bottom panels in Figure 4 show the measured background and expected pre-SN spectra, integrated over the 48 hr window immediately before the collapse. Different integration lengths were studied and this length was chosen to maximize the signal-to-background ratio. To study
the sensitivity, we use the analysis range of
E
0.9 prec(MeV)3.5 to maximize the pre-SN signal-to-background ratio while retaining>90% of the pre-SN signal. The background rate is Blow=0.071 events/day in the low-reactor phase. If the reactors return to normal operations, the background rate rises toBhigh=0.355events/ day. The average efficiency isá ñ =s 0.64 in this range. For the number of events NMZ( )d =aNM( )d , where Z indicates
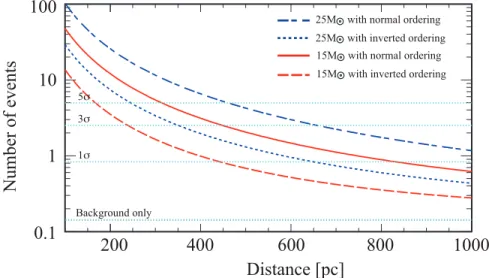
the neutrino mass ordering(Z=N I/ for the normal/ inverted order), we integrate Equation (1) from 0.9 to 3.5 MeV and over the 48 hr before the collapse. They are now N15NM(200 pc)=12.0, N25NM(200 pc)=25.7 and
N15M 200 pc 3.38 I
( )=
,N25M 200 pc 7.28
I
( )=
. The NM d
Z
( )are shown as a function ofd in Figure5.
UsingNMZ( )d with a background of 2days ´Bi(i=low or
high), the corresponding detection significance, expressed in sigma, is estimated. The results for a detection significance of 1s, 3σ, and 5σassumingBloware plotted in Figure 5. If a 3σ
significance is required for pre-SN detection, KamLAND is sensitive to pre-SN from a 25Mestar at 690 pc assumingBlow
and normal neutrino mass ordering. In the worst case, KamLAND is still sensitive to a 15Mestar at 250 pc. In this distance range, there are several red supergiants that could lead Figure 4.(Top)the energy dependent detection efficiencys(Eprec)used in the analysis.(Middle)the integrated pre-SN energy spectrum and measured background in
the last 48 hr before collapse. The backgrounds are dominated by reactor and geologicalne. Background levels for the low-reactor phase(Blow)and high-reactor
to supernovae: Antares(150 pc), Betelgeuse (200 pc), Epsilon Pegasi (210 pc), Pi Puppis (250 pc), Sigma Canis Majoris
(340 pc), NS Puppis (520 pc), CE Tauri (550 pc), and 3 Ceti
(640 pc).
Betelgeuse has been studied extensively as a nearby pre-supernova star (see Townes et al.2009, Haubois et al. 2009, and Ohnaka et al. 2009), therefore we use it to determine KamLANDʼs sensitivity as a function of time before collapse. Betelgeuseʼs measured mass M=17–25 M and distance d=197±45 pc are highly correlated(Harper et al. 2008). We studied the two extreme cases: (M,d)=(15Me, 150 pc) and (25Me, 250 pc). The expected time evolution of significance with the 48 hr integration window is shown in Figure6, assuming the low-reactor background.
If Betelgeuse has(M,d)=(15Me, 150 pc), KamLAND will easily detect its pre-SN. A 3σ detection of pre-SN would be 89.6(7.41)hr before collapse for the normal(inverted) mass ordering. If Betelgeuse has (25Me, 250 pc), the increased distance reduces the pre-SN flux and the number of hours before collapse which KamLAND could detect pre-SN. If the
reactors in Japan are restarted, the number of hours is also reduced because of the larger backgrounds. Table 1 sum-marizes the results and shows for all of these cases that KamLAND can still detect pre-SN and has the ability to send a supernova alarm before collapse.
Figure 5.Expected number of IBD events detected in KamLAND during the 48 hr before collapse, including neutrino oscillation effects as a function of distance. Theflux for a 15Meand 25Mestar is shown assuming the normal and inverted neutrino mass ordering. Horizontal dotted lines are the significance of the detection(see the text).
Figure 6.Time evolution of significance in the low-reactor phase. If Betelgeuse has a mass of 15Meatd=150 pc, the 3σdetection time(shown by a dotted
horizontal line) is 89.6(7.41)hr with normal(inverted) ordering before collapse. KamLAND can detect pre-SN 17.0(4.54)hr before the collapse of Betelgeuse(25Me, 250 pc)at the 3σlevel.
Table 1
Expected Time Before the Betelgeuse Supernova to Reach 3σConfidence Based on Pre-SN Under Various Parameter Assumptions
Mass(Me) Distance(pc)
Mass Ordering
Reactor Status
Time Before Collapse(hr)
15 150 Normal low 8.96
15 150 Inverted low 7.41
25 250 Normal low 17.0
25 250 Inverted low 4.54
15 150 Normal high 46.0
15 150 Inverted high 3.17
25 250 Normal high 11.1
25 250 Inverted high 1.93
This is the motivation for the development of the pre-SN alert system. It provides two levels of alarms. A low-level alarm is produced using the semi-real time pre-SN detection significance. This is calculated using a 48 hr integration window and the background level averaged over the past three months. A new window is opened every 15 minutes and has a latency of 25 minutes due to KamLANDʼs online data processing time. This system requires users to sign up to receive the current significance of detection; see the Kam-LAND web site.19 A high-level alarm will report any 5σ detections to the The Gamma-ray Coordinates Network(GCN) and/or the Astronomerʼs Telegram(ATel). This alarm is only sent after the collaboration rejects other possibilities such as DAQ problems, mine activity, and radon contamination. Unfortunately, the IBD reaction does not provide directional information so a definitive localization requires SNEWS alarms, direction detection in Super-Kamiokande, coherent network analysis of gravitational waves(Hayama et al.2015), and/or electromagnetic observations. However, the limited number of known local progenitors limits the total number of targets that could create a pre-SN signal in KamLAND and therefore some localization is still possible.
In addition to the alarm, pre-SN could teach us about neutrino and supernova properties. The detection of pre-SN from Betelgeuseʼs supernova and an improvement in the measurement of its mass and distance would allow the determination of the normal neutrino mass ordering at 3.6σ
(2.5σ) for the 25Me (15Me) star. The detection of pre-SN could also distinguish between a supernova with an ONe core or an Fe core(Kato et al.2015).
6. SUMMARY
We evaluated KamLANDʼs sensitivity to pre-SN, neutrino– antineutrino pairs from massive stars that have entered the late burning phases. Detection of pre-SN could provide an early warning for the imminent occurrence of a supernova and provide an opportunity to study stellar evolution models in the last stages prior to collapse. This study quantitatively confirms that the 3σ detection of pre-SN is possible for stars with distances up to 690 pc under optimal conditions. The number of pre-supernova stars at this distance is limited but includes several promising candidates such as Betelgeuse. KamLAND currently provides the community with a pre-SN alarm based on the semi-real time significance calculation and will send a report to GCN/ACTel for any 5σ detection that have been verified by the KamLAND collaboration.
ʼ
to both the flux and energy of the pre-SN could be used to extract more information on the late stages of evolution if more detailed predictions become available.
The authors thank A.Odrzywolek for providing his data. KamLAND is supported by MEXT KAKENHI grant numbers 26104002, 26104007; the World Premier International Research Center Initiative (WPI Initiative), MEXT, Japan; and under the U.S. Department of Energy (DOE) grant Nos. FG03-00ER41138, AC02-05CH11231, and DE-FG02-01ER41166, as well as other DOE and NSF grants to individual institutions, and Stichting Fundamenteel Onderzoek der Materie (FOM) in the Netherlands. The Kamioka Mining and Smelting Company has provided service for activities in the mine. We thank the support of NII for SINET4.
REFERENCES
Adams, S. M., Kochanek, C., Beacom, J. F., Vagins, M. R., & Stanek, K. 2013,
ApJ,778, 164
Agafonova, N., Aglietta, M., Antonioli, P., et al. 2015,ApJ,802, 47
Alekseev, E. N., Alekseeva, L. N., Volchenko, V. I., & Krivosheina, I. V. 1987, JETPL,45, 589
Alonso, J. R., Barros, N., Bergevin, M., et al. 2014, arXiv:1409.5864
Antonioli, P., Fienberg, R. T., Fleurot, F., et al. 2004,NJPh,6, 114
Arceo-Díaz, S., Schröder, K.-P., Zuber, K., & Jack, D. 2015,APh,70, 1
Banks, T., Freedman, S., Wallig, J., et al. 2015,NIMPA,769, 88
Beacom, J. F., & Vagins, M. R. 2004,PhRvL,93, 171101
Berger, B. E., Busenitz, J., Classen, T., et al. 2009,JINST,4, P04017
Bionta, R. M., Blewitt, G., Bratton, C. B., et al. 1987,PhRvL,58, 1494
Cadonati, L., Calaprice, F., & Chen, M. 2002,APh,16, 361
Capozzi, F., Fogli, G. L., Lisi, E., et al. 2014,PhRvD,89, 093018
Chen, M. C. 2008, arXiv:0810.3694
Dolan, M. M., Mathews, G. J., Lam, D. D., et al. 2014, arXiv:1406.3143
Dooley, K. L. 2015,JPhCS,610, 012015
Gando, A., Gando, Y., Hanakago, H., et al. 2012,PhRvC,85, 045504
Gando, A., Gando, Y., Hanakago, H., et al. 2013,PhRvD,88, 033001
Gando, A., Gando, Y., Ichimura, K., et al. 2011,PhRvD,83, 052002
Harper, G. M., Brown, A., & Guinan, E. F. 2008,ApJ,135, 1430
Haubois, X., Perrin, G., Lacour, S., et al. 2009,A&A,508, 923
Hayama, K., Kuroda, T., Kotake, K., & Takiwaki, T. 2015, PhRvD, 92, 122001
Heger, A., Friedland, A., Giannotti, M., & Cirigliano, V. 2009,ApJ,696, 608
Hirata, K., Kajita, T., Koshiba, M., et al. 1987,PhRvL,58, 1490
Hirata, K. S., Kajita, T., Koshiba, M., et al. 1988,PhRvD,38, 448
Itoh, N., Hayashi, H., Nishikawa, A., & Kohyama, Y. 1996,ApJS,1024, 411
Kato, C., Azari, M. D., Yamada, S., et al. 2015,ApJ,808, 168
Kim, S.-B. 2014, arXiv:1412.2199
Kneller, J. P., McLaughlin, G. C., & Brockman, J. 2008,PhRvD,77, 045023
Learned, J. G., Dye, S. T., & Pakvasa, S. 2008, arXiv:0810.4975
Li, Y.-F. 2014, arXiv:1402.6143
Nakazato, K., Sumiyoshi, K., Suzuki, H., et al. 2013,ApJS,205, 2
Novoseltseva, R., Boliev, M., Vereshkov, G., et al. 2011,BRASP,75, 419
Odrzywolek, A., & Heger, A. 2010, AcPP, 41, 1611 19
Odrzywolek, A., Misiaszek, M., & Kutschera, M. 2004,APh,21, 303
Ohnaka, K., Hofmann, K.-H., Benisty, M., et al. 2009,A&A,503, 183
Renshaw, A., Abe, K., Hayato, Y., et al. 2014,PhRvL,112, 091805
Scholberg, K. 2012,ARNPS,62, 81
Strumia, A., & Vissani, F. 2003,PhLB,564, 42
Townes, C. H., Wishnow, E. H., Hale, D. D. S., & Walp, B. 2009,ApJL,
697, L127
Vissani, F. 2015,JPhG,42, 013001
Woosley, S. E., & Heger, A. 2015, arXiv:1505.06712
Wurm, M., Beacom, J. F., Bezrukov, L. B., et al. 2012,APh,35, 685