Hybrid Nanoparticles for Anticancer Drug Delivery
Joseph Della Rocca
A dissertation submitted to the faculty of The University of North Carolina at
Chapel Hill in partial fulfillment of the requirements for the degree of Doctor of
Philosophy in the Department of Chemistry
Chapel Hill
2012
ii © 2012
Joseph Della Rocca
iii
Abstract:
Joseph Della Rocca: Hybrid Nanoparticles for Anticancer Drug Delivery
(Under the Direction of Wenbin Lin)
Nanoparticle-based anticancer has the potential to improve cancer therapy as they
generally show greater efficacy with less toxicity than their small molecules counterparts. In
this work, the synthesis, characterization, in vitro,and in vivo evaluationof nanoparticle
platforms to deliver platinum anticancer drugs are discussed.
First, cisplatin-containing co-condensed silica nanoparticles were developed. These
nanoparticles could deliver up to 30 wt% cisplatin and could be targeted to cancer cells by
the surface attachment of appropriate ligands. The targeted nanoparticles had comparable
efficacy to cisplatin in vitro. A new nanoparticle platform, known as polysilsesquioxanes
(PSQ) was developed to deliver the platinum anticancer drugs cisplatin and oxaliplatin.
These nanoparticles have remarkably high drug loading, up to 47 wt% oxaliplatin and 42
wt% cisplatin, respectively, and can selectively release their cargos in the tumor
environment. Both PSQ nanoparticles were functionalized with a polyethylene glycol (PEG)
shell. In vivo evaluations against multiple xenograft models of pancreatic or lung cancers
demonstrated that PSQ nanoparticles had comparable or better efficacy than oxaliplatin or
cisplatin. Further development of all three nanoparticle platforms is ongoing to fully realize
iv
Acknowledgements
This dissertation would not have been possible without the support of many people. I
would first like to thank my advisor, Dr. Wenbin Lin, for the opportunity to work in his lab
on new and exciting projects and all of the invaluable discussions that we have had about my
research over the last five years. Without his direction and constant support, I would have
never completed all of the work that I did. I would also like to thank the other members of
my committee, Dr. Cynthia Schauer, Dr. Michel Gagné, Dr. Leaf Huang, and Dr. Andrew Z.
Wang for the consideration of this dissertation.
I’d also like to thank the present and former members of the Lin group for their help
with these projects. I would like to especially thank Rachel Huxford-Phillips, Erica
Comstock-Duggan, and Stephanie Kramer for carrying out the majority of the in vitro
experiments conducted and for supporting the other aspects of my research. The UNC
Animal Studies Core performed the majority of the in vivo experiments. I would also like to
thank Liqing (Sam) Ma, B.J. Rieter, and Kathryn Taylor-Pashow for mentoring me at the
onset of my career. Additionally, I would like to thank the undergraduate students that
worked under me, Katie Weng, Asif Khan, and Honorio Lara, for their help. Finally I would
like to thank the National Science Foundation, National Cancer Institute and the Carolina
Center for Nanotechnology Excellence for funding.
Finally, I would not have made it to this point my life without the support of my
v
the foundation that has shaped me into the person I am today and have supported me in all
vi
Table of Contents
Page
LIST OF TABLES .………...…...xi
LIST OF FIGURES………....xiii
LIST OF SYMBOLS AND ABBREVIATIONS………xxvii
1 HYBRID NANOPARTICLES FOR ANTICANCER DRUG DELIVERY……….1
1.1Introduction………..1
1.2Synthesis and Functionalization of Hybrid Nanomaterials ……..………..5
1.2.1 Silica Nanomaterials ………...5
1.2.2 Mesoporous Silica Nanoparticles ……….8
1.2.3 Nanoscale Metal Organic Frameworks ………...10
1.3Therapeutic Applications of Hybrid Materials ……….13
1.3.1 Silica Based Materials ……….13
1.3.2 Mesoporous Silica Nanoparticles ………...17
1.3.3 Nanoscale Metal-Organic Frameworks ………..22
1.4Theranostic Applications of Hybrid Nanomaterials ……….26
1.4.1 Silica Based Materials ………26
vii
1.4.3 Nanoscale Metal Organic Frameworks ………...30
1.5Conclusions ………...31
1.6References ……….32
2 POLYSILSESQUIOXANE NANOPARTICLES FOR TARGETED OXALIPLATIN-BASED CHEMOTHERAPY BY TRIGGERED RELEASE ………...43
2.1Introduction ………...43
2.2Results and Discussion ……….45
2.2.1 Synthesis of Platinum Complexes ………..45
2.2.2 Synthesis of PSQ Nanoparticle 2.1 ……….46
2.2.3 Platinum Release from Nanoparticle 2.1 ………52
2.2.4 Post-Synthetic Modification ………..…53
2.2.5 In Vitro Cytotoxicity Studies ………..58
2.2.6 In Vitro Confocal Microscopy Studies ………...61
2.2.7 In Vivo Studies ………65
2.3Conclusions ………...73
2.4Materials and Methods ………..73
2.4.1 General Materials and Methods ………..73
2.4.2 Synthesis of Platinum Complexes ………..74
2.4.3 Synthesis of Silyl-Derived Molecules ………75
2.4.4 Synthesis of Polyethylene Glycol (MW =2000) Derivatives …….…76
2.4.5 Nanoparticle Synthesis ………77
2.4.6 Nanoparticle Surface Functionalization ………..78
2.4.7 Platinum Release from 2.1 ………..79
viii
2.4.9 In Vivo Assays ……….82
2.4.10 Ex Vivo Tissue Histology ………83
2.5References ……….85
3 CO-CONDENSED SILICA NANOPARTICLES FOR PLATINUM-BASED ANTICANCER DRUG DELIVERY………..……….….91
3.1Introduction ………...91
3.2Results and Discussion ……….93
3.2.1 Platinum Complex Synthesis ………..93
3.2.2 Synthesis of Co-condensed Silica Nanoparticles ………94
3.2.3 cRGD Targeting of Nanoparticle 3.6 …………..……….102
3.2.4 Platinum Release from Nanoparticle 3.6 ………..104
3.2.5 In vitro Cytotoxicity Assays ……….105
3.3Conclusion ………..107
3.4Materials and Methods ………....108
3.4.1 General Materials and Methods ………108
3.4.2 Synthesis of Platinum Complexes ………109
3.4.3 Nanoparticle Synthesis ………..110
3.4.4 Nanoparticle Surface Modification ………...111
3.4.5 Platinum Release from 3.6 ………111
3.4.6 In Vitro Assays ………..…112
3.5References ………...114
ix
4.1Introduction ……….119
4.2Results and Discussion ………...120
4.2.1 Platinum Complex Synthesis ………120
4.2.2 Synthesis of Nanoparticle 4.1 ………...…120
4.2.3 Cisplatin Release from Nanoparticle 4.1 ………..124
4.2.4 cRGD Targeting ………125
4.2.5 In Vitro Cytotoxicity of 4.1 and RGD-4.1 ………127
4.2.6 Pegylation of 4.1 ………...130
4.2.7 In Vitro Cytotoxicity of PEG2k-4.1 and APEG2k-4.1 ...………..…133
4.2.8 In Vivo Efficacy of PEG2k-4.1 and APEG2k-4.1 ……….135
4.2.9 Maximum Tolerated Dose Studies of PEG2k-4.1 ………140
4.2.10 Pegylation (MW: 5000) of 4.1 ………..…141
4.2.11 Nonspecific Protein Binding and Plasma Colloidal Stability ……...144
4.2.12 Maximum Tolerated Dose of PEG5k-4.1 ……….149
4.2.13 Biodistribution of PEG5k-4.1 ………...154
4.2.14 Chemotherapeutic Efficacy of PEG5k-4.1 ………...…157
4.2.15 Lung Cancer Chemoradiotherapy with PEG5k-4.1 ………..…160
4.3Conclusions ……….163
4.4Materials and Methods ………165
4.4.1 General Materials and Methods ………165
4.4.2 Synthesis of Platinum Compounds ………...166
4.4.3 Synthesis of Polyethylene Glycol Derivatives ………..166
x
4.4.5 Platinum Release Assays ………..168
4.4.6 Nanoparticle Surface Modification ………...168
4.4.7 Colloidal Stability in Biological Media ………169
4.4.8 In Vitro Assays ………..170
4.4.9 In Vivo Assays ………...172
xi
List of Tables
Page
Table 2-1 Hydrodynamic diameters and zeta potential of various forms
of 2.1 in PBS ………...49
Table 3-1 Hydrodynamic diameters of different forms of nanoparticles obtained in PBS. The numbers in parentheses are the average percent volumes for multimodal size distributions. All measurements are the average of 3
independent measurements. N.A.= not available………98
Table 4-1 Hydrodynamic diameters and zeta potentials of various forms of 4.1. All DLS measurements were obtained in 5mM PBS and are the average of 3 measurements……….123
Table 4-2 IC50 values of cisplatin, 4.1, and RGD-4.1 evaluated against three
cancer cell lines………..129
Table 4-3 IC50 values of cisplatin, 4.1, PEG2k-4.1, and APEG2k-4.1 evaluated
against two NSCLC cell lines………135
Table 4-4 Mouse survival statistics as a result of platinum chemotherapy………137
Table 4-5 MTD study results of non-tumor bearing nude mice treated with
PEG2k-4.1 ……….141
Table 4-6 MTD study results of non-tumor bearing nude mice receiving different dose levels of PEG5k-4.1………...…150
Table 4-7 Comparison of α values of different treatment arms of A549
xii
Table 4-8 Comparison of α values of different treatment arms of H460
chemoradiotherapy efficacy study by students t-test……….163
xiii
List of Figures
Page
Figure 1-1 Methods for synthesizing solid silica nanoparticles. (a) The Stöber method, in which the hydrolysis and
condensation of TEOS is facilitated by base in ethanol/water: TEM micrograph shows 125 nm silica nanoparticles.57 (b) The reverse phase microemulsion, in which TEOS is hydrolyzed at the micellar interface and enters the aqueous droplet to form a silica nanoparticle within the micelle. TEM micrograph shows 37 nm silica nanoparticles.56 The scale bars
indicate 200 nm ………...………..7
Figure 1-2 Schematic demonstrating the synthesis of MCM-41 type MSN particles. The cationic surfactant molecules self-assemble into hexagonal arrays in aqueous solution and the silica precursors then hydrolyze and condense along the exterior of the micelles to form a mesoporous material after surfactant removal..….………9
Figure 1-3 a) Surfactant-free synthesis of NMOFs by mixing NMOF precursors in appropriate solvents. In the nanoprecipitation
method, the NMOF forms rapidly at room temperature, whereas in the solvothermal method, heating the solution leads to more controlled particle growth. b) and c) SEM images of amorphous79 or crystalline80 NMOFs. ………11
Figure 1-4 a) Surfactant-templated NMOF synthesis, either conducted with reverse microemulsions at room temperature or surfactant-assisted solvothermal reactions. b)82 and c)83 show SEM images of crystalline
NMOFs synthesized by these methods………12
Figure 1-5 Schematic showing an organically-modified silica nanoparticle co-encapsulating two-photon absorbing fluorescent dye aggregates and a photosensitizing drug for two-photon photodynamic
therapy.90……….15
Figure 1-6 Cytotoxicity of TNF-α loaded chitosan-silica nanospheres. a) Cytotoxicity effect of TNF-α loaded chitosan-silica
xiv
with different incubation times. b) Concentration dependent cell viability of TNF-α loaded chitosan-silica nanospheres incubated for 4 hours. c) Fluorescent photos of MCF-7 cells
demonstrating the time-dependent cytotoxicity effect of the nanocarriers by acridine orange (green color, live cells) and propidium iodide (red color, dead cells) staining. D) Fluorescent photos of MCF-7 cells demonstrating concentration dependent cytotoxicity effect after 48 hours incubation by acridine orange and propidium iodide stain. Scale bar is 50 µm.98 ……….……….17
Figure 1-7 Schematic of the Au nanoparticle-capped MSN-based drug delivery system. The controlled release of the cargo is based on UV irradiation………...19
Figure 1-8 Schematic of a redox-responsive nanogated ensemble based on polymeric network capped mesoporous silica.106 ………..20
Figure 1-9 a) TEM image of MSN, scale bar= 50nm. Inset shows the dynamic light scattering histogram of these nanoparticles. b) Schematic representation of drug loading of MSN and encapsulation within a liposome to form a protocell, followed by cellular uptake and cargo release. c) Confocal images of the protocell: FITC-labeled MSN (green), Texas-Red labeled liposome (red) and the merged image
showing the protocell.109………..…21
Figure 1-10 a) Schematic representation of the synthesis, post-synthetic
modification and cisplatin release from Tb3+ based NMOF.79 b) Schematic representation of the synthesis, post-synthetic modification, silica coating, and agent release from iron-carboxylate MIL101 NMOFs.80 ...……….……..23
Figure 1-11 a) Images of control mice and the two subcutaneous injections of 100 µL MB-encapsulated PSiNPs with concentrations of 44 mg/mL (a) and 4.4 mg/mL (b). The acquisition was performed two minutes post-injection. b) Real time in vivo images of mice
xv
Figure 1-12 a) In vivo T2-weighted MR and b) fluorescence images of
subcutaneously injected MCF-7 cells labeled with Fe3O4@MSN
and control cells. (c) T2-weighted MR (upper row) and color maps
(lower row) of the tumor before and after the Fe3O4@MSN
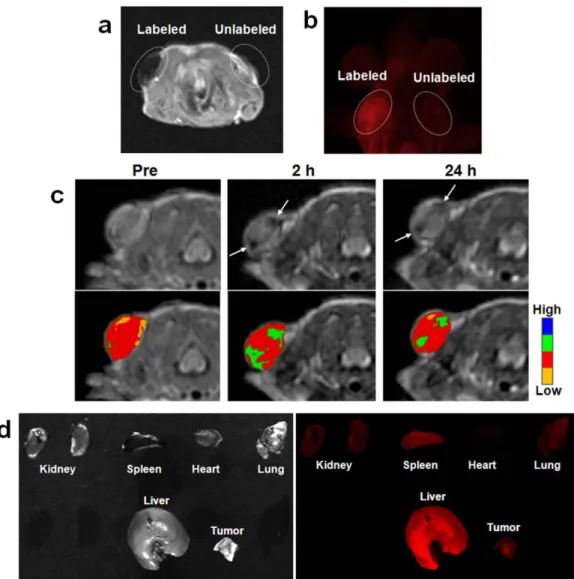
particles were intravenously injected into the tail vein of a nude mouse implanted with MCF-7 cells. A decrease in signal intensity was detected at the tumor site (arrows). (d) Photographic (left) and fluorescence (right) images of several organs and the tumor 24 hours after i.v. injection.71 ………...………...29
Scheme 2-1 Synthesis of platinum complexes used for the synthesis of the PSQ nanoparticle 2.1 ...………...46
Scheme 2-2 Schematic demonstrating the synthesis, platinum release and tumor growth inhibition mechanism of 2.1...………...48
Figure 2-1 TEM micrographs of 2.1………..48
Figure 2-2 Intensity (left) and number (right) weighted DLS spectra of 2.1 ………...…49
Figure 2-3 TGA weight loss curve for 2.1……….49
Figure 2-4 TEM micrographs of rhod-2.1……….50
xvi
Figure 2-6 TGA weight loss curves for 2.1 (black) and rhod-2.1 (cyan)………..51
Figure 2-7 Fluorescence spectra of rhod-2.1 as a dispersion in PBS. The
excitation wavelength was 555 nm………...………...51
Figure 2-8 Platinum release profile from 2.1 in the absence and presence of 10mM L-cysteine. The reducing agent was added where
indicated by the arrow………..53
Scheme 2-3 Post-synthetic modification strategies for 2.1 through either surface silanol groups (i) or carboxylic acids(ii).………...………….53
Figure 2-9 Intensity (left) and number (right) weighted DLS size
distributions for 2.1 (black) and RGD-2.1 (green) in PBS………...…...54
Figure 2-10 TEM micrographs of PEG-2.1……….55
Figure 2-11 Intensity (left) and number (right) weighted DLS spectra of 2.1 (black) and PEG-2.1 (blue) obtained in PBS…...………..56
Figure 2-12 TGA weight loss curves for 2.1 (black) and PEG-2.1 (blue)………...…56
Figure 2-13 TEM micrographs of APEG-2.1 ……….57
xvii
Figure 2-15 TGA weight loss curves for 2.1 (black), PEG-2.1 (blue) and
APEG-2.1 (red)………58
Figure 2-16 Cell viability assays of oxaliplatin (red), 2.1 (black) and RGD-2.1 (blue) evaluated against DLD-1 human colon
adenocarcinoma cells……….………..59
Figure 2-17 Cell viability assays of oxaliplatin (red), 2.1 (black) and RGD-2.1 (blue) evaluated against HT-29 human colon
adenocarcinoma cells……….…..59
Figure 2-18 Cell viability assay of oxaliplatin (red), 2.1 (black), and RGD-2.1 (blue) evaluated against AsPC-1 pancreatic ductal
adenocarcinoma cells……….………..60
Figure 2-19 Cell viability assay of oxaliplatin (red), 2.1 (black), and RGD-2.1 (blue) evaluated against BxPc-3 pancreatic ductal
adenocarcinoma cells……….………..61
Figure 2-20 Cell viability assay of oxaliplatin (black), PEG-2.1 (blue) and APEG-2.1 (red) evaluated against AsPc-1 pancreatic ductal
adenocarcinoma cells………..….61
Figure 2-21 Overlaid confocal microscopy images of rhod-2.1 (top) and RGD-rhod-2.1 (bottom) incubated with DLD-1 colon cancer cells at 0, 0.02, 0.05 and 0.1 mg nanoparticle per
well………...…62
Figure 2-22 Laser scanning confocal microscopy images of AsPC-1 cells incubated with no particle, rhod-2.1, PEG-rhod-2.1, and APEG-rhod-2.1 for 1 hr (5µM Pt concentration) and then treated with Annexin V/FITC. The green fluorescence arises from FITC and the red fluorescence arises from
rhodamine B. Scale bars= 50µm………..64
xviii
APEG-rhod-2.1 for 5.5 hours at 5µM Pt. The cells were stained with FITC-Annexin V (green channel) to mark cellular apoptosis. Nanoparticle fluorescence is the red channel, and the scale bars indicate 50µm………...………65
Figure 2-24 Tumor growth inhibition curves of oxaliplatin (green), PEG-2.1 (blue), APEG-2.1 (red) and PBS control (black) administered by tail vein injection at 5mg Pt/kg on days 0,7, and 14 against an AsPc-1 subcutaneous xenograft………..67
Figure 2-25 Mouse body weights of groups treated with oxaliplatin (green), PEG-2.1 (blue), APEG-2.1 (red) and PBS control (black) administered i.v. at 5mg Pt/kg. Treatment was administered on days 0, 7, and 14 against an AsPC-1 subcutaneous xenograft. Error bars are omitted for clarity……….…67
Figure 2-26 Histology images of resected AsPc-1 tumors with H&E staining from mice receiving PBS control (a), oxaliplatin (b), PEG-2.1 (c), and APEG-2.1 (d). The scale bars indicated 0.5 mm. The blue-purple dots result from nuclear staining of viable cancer cells whereas the pinkish areas indicate necrotic tumor tissue with no viable cells or nuclear material………..……..68
Figure 2-27 AsPc-1 tumor histology images taken at 10x magnification for mice receiving PBS(A), oxaliplatin (B), PEG-2.1 (C), or APEG-2.1 (D). The blue purple dots result from viable cancer cells, the pink areas indicate regions of complete cellular necrosis, leaving no nuclear material to be stained purple and conversion of the area to an abscess and the white areas are regions of deposited fatty tissue. The scale bar indicates 500 µm………69
Figure 2-28 AsPc-1 tumor histology images taken at 20x magnification for mice receiving PBS(A), oxaliplatin (B), PEG-2.1 (C), or APEG-2.1 (D). The blue purple dots result from viable cancer cells, the pink areas indicate regions of complete cellular necrosis, leaving no nuclear material to be stained purple and
xix
Figure 2-29 AsPc-1 tumor histology images taken at 40x magnification for mice receiving PBS(A), oxaliplatin (B), PEG-2.1 (C), or APEG-2.1 (D). The blue purple dots result from viable cancer cells, the pink areas indicate regions of complet cellular necrosis, leaving no nuclear material to be stained purple and conversion of the area to an abscess and the white areas are regions of deposited fatty tissue. The scale bar indicates 60 µm………71
Figure 2-30 Luminescence intensity increases of mice orthotopically implanted with luciferase expressing AsPc-1 tumors and receiving either PBS (black), oxaliplatin (green), or PEG-2.1 (blue) via tail vein injection at 5mg Pt/kg. The study was terminated prematurely due to adverse effects from repeated tail vein injection………..72
Scheme 3-1 Schematic of the synthesis of the platinum complexes used i) cisplatin is oxidized with hydrogen peroxide in water to form
c,c,t-Pt(NH3)2Cl2(OH)2. ii) c,c,t-Pt(NH3)2Cl2(OH)2 reacts with
triethoxysilyl propyl succinic anhydride to form DSCP-Si………..……….94
Scheme 3-2 Schematic demonstrating the synthesis of co-condensed silica nanoparticles. TEOS diffuses into the water droplets and
subsequent hydrolysis and condensation leads to the creation of the Pt-containing nanoparticles within the water droplets………95
Figure 3-1 SEM images of as synthesized 3.1 (A), 3.2 (B), 3.3 (C), and 3.4 (D)……….97
Figure 3-2 Intensity (left) and number (right) weighted DLS spectra of 3.2 (red), 3.3 (blue) and 3.4 (black) obtained in PBS………97
Figure 3-3 TGA weight loss curves for silica nanoparticles synthesized under the same reaction conditions TEOS only (black), 3.1 (red), 3.2 (green), 3.3 (blue) and 3.4 (maroon)…..………..98
xx
Figure 3-5 TEM micrographs of 3.5 (A) and 3.6 (B)………..100
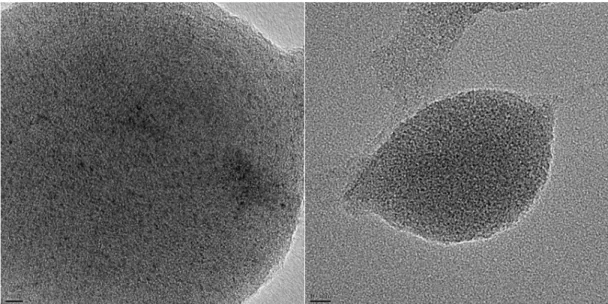
Figure 3-6 High resolution TEM images of 3.6. Scale bar is 5 nm for the left image and 10 nm for the right image……...………101
Figure 3-7 Intensity (left) and number (right) weighted DLS spectra of 3.5 (blue) and 3.6 (red) obtained in 5mM PBS………..101
Figure 3-8 TGA weight loss curves for 3.5 (blue) and 3.6 (red)……….102
Scheme 3-3 Post-synthetic modification scheme of 3.6. 3.6 is first activated to form an active NHS ester, which then reacts with amine groups on cRGDfK to create RGD-3.6………..103
Figure 3-9 SEM image of RGD-3.6………103
Figure 3-10 Intensity (left) and number (right) weighted DLS spectra of 3.6 (red) and RGD-3.6 (black) obtained in 5mM PBS………….………….104
Figure 3-11 Platinum release from 3.6 can be triggered by the addition of an
endogenous reducing agent (indicated by arrow)……….105
Figure 3-12 Cell viability assay of cisplatin (black), 3.6 (red), and RGD-3.6 (blue) evaluated against A549 human lung
carcinoma cells………...………106
xxi
Scheme 4-1 Schematic of the synthesis of 4.1. Drug release can be triggered by endogenous reducing agents with the released drug leading to various anticancer effects…………..………...122
Figure 4-1 TEM micrographs of 4.1………122
Figure 4-2 SEM micrographs of 4.1………123
Figure 4-3 Intensity (left) and number (right) weighted DLS spectra for 4.1 obtained in 5mM PBS……….………...123
Figure 4-4 TGA weight loss curve for 4.1………...124
Figure 4-5 Platinum Release from 4.1 in the presence of low (15 µM, red line) or high (5 mM, blue line) concentrations of L-cysteine as a model reducing agent. L-cysteine was added at time zero, as indicated by the black arrow……….………..125
Scheme 4-2 Post-synthetic modification of 4.1 to form RGD-4.1………126
Figure 4-6 SEM micrographs of RGD-4.1………..127
Figure 4-7 Intensity (left) and number (right) weighted DLS spectra of 4.1 (black) and RGD-4.1 (red) obtained in 5mM PBS……….……….127
Figure 4-8 Cell viability assay of A549 lung adenocarcinoma cells treated with cisplatin (black), 4.1 (red) or RGD-4.1 (blue)………...128
xxii
Figure 4-10 Cell viability assay of PC-3 prostate adenocarcinoma cells treated with cisplatin (black), 4.1 (red) or RGD-4.1 (blue)………...…129
Figure 4-11 SEM micrographs of PEG2k-4.1 (left) and APEG2k-4.1 (right)…………..131
Figure 4-12 Intensity (left) and number (right) weighted DLS spectra of 4.1 (black), PEG2k-4.1 (red) and APEG2k-4.1 (blue) obtained in 5mM
PBS……….131
Figure 4-13 TGA weight loss curves for 4.1 (black), PEG2k-4.1(red), and
APEG2k-4.1 (blue)………132
Figure 4-14 Cell viability assay of A549 lung adenocarcinoma cells treated with either cisplatin (black) or PEG2k-4.1 (red)……….……..134
Figure 4-15 Cell Viability assay of H460 large cell lung carcinoma cells treated with either cisplatin (black), 4.1 (green), PEG2k-4.1 (red) or
APEG2k-4.1 (blue)………134
Figure 4-16 Tumor growth inhibition in a H460 large cell lung carcinoma subcutaneous xenograft model. Mice received either saline control (black), cisplatin (green, 4 mg/kg), PEG2k-4.1 (red, 4 mg cisplatin/kg equivalent), or APEG2k-4.1 (blue, 4mg cisplatin/kg equivalent) on days 0, 2, and 4…………...………...136
Figure 4-17 Mouse body weight changes during the course of the study. Mice received either saline control (black), cisplatin (green, 4 mg/kg),
PEG2k-4.1 (red, 4 mg cisplatin/kg equivalent), or APEG2k-4.1 (blue, 4 mg cisplatin/kg equivalent) on days 0, 2, and 4………...137
xxiii
regions containing no viable tumor tissue. Scale bar indicates 0.5
mm………...……..138
Figure 4-19 Histological images of resected H460 tumors with H&E staining at 10x magnification. Mice received either saline control (A), cisplatin (B), PEG2k-4.1 (C), or APEG2k-4.1(D) on study days 0, 2, and 4. The blue-purple dots result from nuclear staining of viable cancer cells whereas the pinkish areas are necrotic regions containing no viable tumor tissue. Scale bars indicate 500
µm………..…139
Figure 4-20 Histological images of resected H460 tumors with H&E staining at 20x magnification. Mice received either saline control (A), cisplatin (B), PEG2k-4.1 (C), or APEG2k-4.1(D) on study days 0, 2, and 4. The blue-purple dots result from nuclear staining of viable cancer cells whereas the pinkish areas are necrotic regions containing no viable tumor tissue. Scale bars indicate 120 µm………..……..…140
Figure 4-21 Liver histology results of mice treated with saline (A) or PEG2k-4.1 (B) with H&E staining at 4x magnification. Purple areas indicate viable cells, pink areas indicate dead cells, and red circles indicate red blood cells. Scale bars indicate 0.5 mm……….………..141
Scheme 4-3 Schematic of pegylation of 4.1 to PEG5k-4.1………..……….142
Figure 4-22 SEM micrographs of PEG5k-4.1………...143
Figure 4-23 TEM micrographs of PEG5k-4.1………...143
Figure 4-24 Intensity (left) and number (right) weighted DLS spectra of 4.1 (black) and PEG5k-4.1 obtained in 5mM PBS..………..143
xxiv
Figure 4-26 d(Zavg) trends as a function of exposure to BSA for 4.1 (red) and
PEG5k-4.1 (blue). BSA was added at t =0………145
Figure 4-27 DLS count rate trends as a function of time after exposure to BSA for 4.1 (red) and PEG5k-4.1 (blue)………146
Figure 4-28 Intensity weighted DLS curves of 4.1 before (black) and after (blue) BSA addition. After curves were obtained every 10 minutes for 3 hours……….….146
Figure 4-29 Intensity weighted DLS curves of PEG5k-4.1 before (black) and after (blue) BSA addition. After curves were obtained every 10 minutes for 3 hours………..………..147
Figure 4-30 Colloidal stability measurements of PEG5k-4.1 (A) in rat plasma………...148
Figure 4-31 Colloidal stability of PEG5k-4.1 (B) in rat plasma………149
Figure 4-32 Percent mouse body weight changes after administration of 4 mg/kg (black), 6 mg/kg (red), 10 mg/kg (green) 12 mg/kg (blue), 15 mg/kg (cyan) or 20 mg /kg (orange) doses of PEG5k-4.1 in non-tumor bearing nude mice. All doses are cisplatin
equivalent………...………150
Figure 4-33 Liver histological images (with H& E staining) obtained at 4 x
magnification of mice receiving either 0 mg/kg (A), 4 mg/ kg (B), 10 mg/kg (C) or 15 mg /kg (D) doses of PEG5k-4.1. All doses are
expressed as cisplatin equivalent doses. Scale bars indicate 0.5 mm………151
xxv
PEG5k-4.1. All doses are expressed as cisplatin equivalent doses. Scale bars indicate 500 µm……….152
Figure 4-35 Spleen histological images (with H& E staining) obtained at 4x
magnification of mice receiving either 0 mg/kg (A), 4 mg/ kg (B), 10 mg/kg (C) or 15 mg /kg (D) doses of PEG5k-4.1. All doses are expressed as cisplatin equivalent doses. Scale bar indicates 0.5 mm………...……153
Figure 4-36 Spleen histological images (with H& E staining) obtained at 10 x
magnification of mice receiving either 0 mg/kg (A), 4 mg/ kg (B), 10 mg/kg (C) or 15 mg /kg (D) doses of PEG5k-4.1. All doses are expressed as cisplatin equivalent doses. Scale bar
indicates 500 µm………154
Figure 4-37 Platinum concentrations in the tumor (black), liver (red), spleen (blue), kidneys (cyan), and blood (pink) after administration of PEG5k-4.1 (A) to mice bearing H460 s.c. xenografts………..156
Figure 4-38 Blood platinum concentration levels over time after administration of PEG5k-4.1 (A) (red) and PEG5k-4.1 (B) (blue) to nu/nu
mice………...156
Figure 4-39 Platinum concentrations in liver (red), spleen (blue), kidneys (cyan), and blood (pink) after administration of PEG5k-4.1 (B) to mice……….157
Figure 4-40 Chemotherapeutic efficacy study in mice with H460 s.c. xenografts receiving either saline control (black), cisplatin (red, 4mg/kg) or
PEG5k-4.1 (blue, 4 mg/kg cisplatin) on days 0, 4 and 8………...159
Figure 4-41 Body weight changes in mice with H460 s.c. xenografts receiving either saline control (black), cisplatin (red) or PEG5k-4.1 (blue)………….159
xxvi
radiation (red), cisplatin (1mg/kg) 6 hours prior to 10 Gy radiation (green) or PEG5k-4.1 (1mg cisplatin/kg) 6 hours prior to
radiation (blue)………...162
Figure 4-43 Chemoradiotherapy efficacy assay against mice bearing H460 lung cancer xenografts. Mice received either saline control (black), 10 Gy radiation (red), cisplatin (1mg/kg) 6 hours prior to 10 Gy radiation (green) or
xxvii
List of Abbreviations
2.1 Polysilsesquioxane nanoparticle containing an oxaliplatin derivative
3.1 Co-condensed silica nanoparticle with cisplatin and 5 molar equivalents of
TEOS
3.2 Co-condensed silica nanoparticle containing cisplatin and 10 molar
equivalents of TEOS
3.3 Co-condensed silica nanoparticle containing cisplatin and 15 molar
equivalents of TEOS
3.4 Co-condensed silica nanoparticle containing cisplatin and 20 molar
equivalents of TEOS
3.5 Co-condensed silica nanoparticle containing cisplatin and 5 molar equivalents
of TEOS
3.6 Co-condensed silica nanoparticle containing cisplatin and 10 molar
equivalents of TEOS
4.1 Polysilsesquioxane nanoparticle containing a cisplatin derivative
°C degrees Celsius
α alpha
λex wavelength of exciation
xxviii A549 human lung adenocarcinoma cell line
AA Anisamide
ACN acetonitrile
AOT bis(1-ethylhexyl)sulfosuccinate
APEG-2.1 an anisamide targeted, pegylated version of nanoparticle 2.1
APEG-rhod-2.1 an anisamide targeted, pegylated version of nanoparticle rhod-2.1
APEG2k-4.1 an anisamide targeted, pegylated version of nanoparticle 4.1
ASPC-1 human pancreatic ductal adenocarcinoma cell line
ATCC American Type Culture Collection
BxPC-3 human pancreatic ductal adenocarcinoma cell line
BSA Bovine serum albumin
c(RGDfK) cyclic(arginine-glycine-aspartic acid-phenylalanine-lysine)
Dach 1,2-(R,R)-diaminocyclohexane
DACH-Si Pt(dach)Cl2(triethoxysilylpropyl succinate)2
DLD-1 human colon adenocarcinoma cell line
DLS Dynamic Light Scattering
xxix DMSO Dimethylsulfoxide
DSCP disuccinato cisplatin
DSCP-Si c,c,t-Pt(NH3)2Cl2(triethoxysilylpropyl succinate)2
EDC 1-Ethyl-3-(3-dimethylaminopropyl) carbodiimide hydrochloride
EDS Energy Dispersive X-ray Spectroscopy
FITC Fluorescein isothiocyanate
g gram
Gy Gray
HBTU O-(benzotriazol-1-yl)-1,1,3,3-tetramethyluronium hexafluorophosphate
hr hour
HRTEM High Resolution Transmission Electron Microscopy
HT-29 Human colon carcinoma cell line
IC50 Inhibitory Concentration 50%
ICP-MS Inductively Coupled Plasma-Mass Spectrometry
i.v. intravenous
k kilo-
xxx m milli-
M Molar
min minute
MOF Metal Organic Framework
MTD Maximum Tolerated Dose
MW Molecular Weight
n nano
NCI-H460 human large cell lung carcinoma cell line
NHS N-hydroxysuccinimde
NMOF nanoscale metal organic framework
NMR Nuclear Magnetic Resonance
PBS Phosphate Buffered Saline
PC-3 human prostate adenoncarcinoma cell line
PDI Polydispersity Index
PEG Polyethylene Glycol
PEG-2.1 a PEG coated version of nanoparticle 2.1
xxxi
PEG2k-4.1 a PEG (MW 2000) coated version of nanoparticle 4.1
PEG5k-4.1 a PEG (MW 5000) coated version of nanoparticle 4.1
PSQ Polysilsesquioxane
R a generic organic group
RGD-2.1 a cRGD targeted version of nanoparticle 2.1
RGD-rhod-2.1 a cRGD targeted version of nanoparticle rhod-2.1
RGD-3.6 a cRGD targeted version of nanoparticle 3.6
RGD-4.1 a cRGD targeted version of nanoparticle 4.1
Rhod-2.1 a rhodamine containing version of nanoparticle 2.1
r.t. room temperature
SEM scanning electron microscopy
T1/2 half-life
TEA triethylamine
TEM Transmission Electron Microscopy
TEOS tetraethylorthosilicate
TGA Thermogravimetric Analysis
xxxii
W water to surfactant ratio
X multiplied (or enhanced) by
Chapter 1:
Hybrid Nanoparticles for Anticancer Drug Delivery
1.1 Introduction
Cancer remains one of the deadliest diseases known to man, causing significant
mortality and morbidity and costing hundreds of billions of dollars in healthcare expenses in
the United States annually. Despite remarkable advances in our knowledge of the
fundamental biology of cancer and the billions of dollars spent on drug research and
development, there has not been a significant increase in overall patient survival for many
types of cancer. A major reason for this dilemma is the lack of effective chemotherapeutic
options. Over the past thirty years, the rate of new drug approvals has remained relatively
constant (20-30 drugs annually). Most new approvals are reformulations, new applications,
or new combinations of previously approved agents.1 The treatment options for many
cancers have remained nearly unchanged as a result of the lack of new drug approvals.
Pharmaceutical development is limited by a number of factors including high research and
development costs and regulatory barriers, but the lack of effective drug delivery vectors
remains a major bottleneck. Many drug candidates identified through high throughput
screenings do not possess sufficient solubility to be bioavailable,2 and the
biologically-derived agents (e.g., peptides, proteins, and siRNA) are degraded readily by endogenous
enzymes in circulation. The currently approved agents, mostly small molecules, are limited
2
acute need to identify a method to make small molecule drugs more bioavailable, protect
biologics from premature degradation, and increase tumor uptake of the agent while
minimizing nonspecific uptake.
Nanoparticle-based chemotherapeutics are an emerging class of drug delivery
systems which have the potential to revolutionize cancer chemotherapy. Broadly speaking, a
nanoparticle- based chemotherapeutic (nanotherapeutic) consists of a therapeutic embedded
within or attached to a nanoparticle matrix. A variety of nanocarriers have been developed to
deliver a wide range of cancer chemotherapeutics.3 Nanoparticles possess many advantages
over conventional therapeutics such as extended systemic circulation times, increased tumor
uptake due to the enhanced permeability and retention (EPR) effect, and targeted delivery to
specific tissues with surface-conjugated ligands. Due to their size, nanotherapuetics cannot
penetrate normal vasculatures and capillaries, leading to a lower nanoparticle dose to normal
tissues such as skin, muscle, lungs, hearts and kidneys compared to small molecules. The
clearance of nanotherapuetics generally occurs through the mononuclear phagocytic system
(MPS), resulting in accumulation in the Kupffer cells of the liver and the macrophages of the
spleen. This unique biodistribution generally results in lower systemic toxicity of
nanotherapeutics. Additionally, nanoparticles can be engineered to incorporate multiple types
of therapeutic or diagnostic agents, allowing for the synergistic therapeutic efficacy and
real-time monitoring of therapeutic response. The promise of nanoparticle therapeutics is
validated with the clinical success of multiple entities such as Doxil and Abraxane.4
The story of nanoparticle therapeutics cannot, however, be considered an
unblemished success as clinically deployed nanotherapeutics have limitations. For example,
3
Abraxane shows improved efficacy compared to paclitaxel, but it is extremely expensive to
manufacture and generally has not replaced paclitaxel clinically.4, 7 Most nanocarriers can
only be used to deliver drugs with specific properties (e.g., charge, hydrophobicity, etc) and
have a fairly low threshold for drug incorporation, typically a few weight percent of active
pharmaceutical ingredients (API). Most nanomedicines are in fact composed mostly of
non-API components. The commercialization of nanotherapeutics is also hamstrung by high
production costs and persistent manufacturing issues such as scalability to multi-kilogram
batches and batch-to-batch consistency. The toxicological impact and biological persistence
of many nanoparticles remain poorly investigated, posing long term issues from exposure to
these materials.8
The nanoparticle platforms that have been extensively explored for biomedical
applications are predominantly either purely inorganic or organic materials. The archetypical
inorganic nanoparticles, quantum dots (QDs), are nanomaterials generally composed of
elements from either groups II and VI or III and V.9-13 They display unique optical
properties, including sharp and symmetrical emission spectra, high quantum yields, broad
absorption spectra, good chemical and photo-stability, and tunable size-dependent emission
wavelengths.11 As a result, they have been evaluated extensively for use as optical imaging
probes both in vitro and in vivo. Another class of inorganic nanoparticles that have been
evaluated for biomedical imaging applications are metal oxides, such as superparamagnetic
iron oxide nanoparticles (SPIO). Iron oxide nanoparticles have been used as contrast agents
for magnetic resonance imaging (MRI), and one formulation of SPIO has received FDA
approval for clinical use.14 Gold nanoparticles with controllable morphologies have been
4
strong absorption in the NIR region.15-17 Gold nanoparticles have also been explored for
photothermal therapy, where absorbed light by small gold nanoparticles (10-30 nm) is
rapidly converted into thermal energy, leading to hyperthermia and cell death.
Purely organic nanoparticles have also found widespread use as imaging and
therapeutic agents. Liposomes have been the most successful nanoparticle platform for
biomedical applications, with several formulations clinically available.18-19 These
nanoparticles are composed of an aqueous core surrounded by a phospholipid bilayer and
have been used to deliver a variety of therapeutic and imaging agents.20-23 Surface
modification of the lipid bilayer allows for long in vivo circulation times and targeting to
specific regions.24 There have been many reports on the use of polymeric hydrogel
nanoparticles as delivery vehicles for imaging contrast agents and therapeutics.25-35
Dendrimers and other hyper-branched organic polymers have also been extensively evaluated
for their potential in imaging and drug delivery applications.36-40
Hybrid nanoparticles are composed of both inorganic and organic components that
can not only retain the beneficial features of both inorganic and organic nanomaterials, but
also possess unique advantages over the other two types. For example, the ability to combine
a multitude of organic and inorganic components in a modular fashion allows for systematic
tuning of the properties of the resultant hybrid nanomaterial. This chapter will cover two
major classes of hybrid nanomaterials, namely silica-based nanomaterials and nanoscale
metal-organic frameworks (NMOFs), which have been recently explored for therapeutic
applications. While many nanoparticle platforms may be considered hybrid, we have chosen
to restrict our discussion to silica-based nanomaterials and NMOFs that are closely examined
5
There are two major types of silica-based hybrid nanomaterials, solid silica particles
and mesoporous silica nanoparticles (MSNs). Unlike solid silica particles, MSNs exhibit
many unique properties such as high surface areas, tunable pore sizes, and large pore
volumes. Imaging or therapeutic cargoes can either be directly incorporated in the silica
matrix or grafted to the outer surface of the solid silica particles. MSNs can be
functionalized with imaging or therapeutic agents in several ways, including loading of cargo
into the pores, covalent grafting, and co-condensation of siloxy-derived cargoes.
NMOFs, also termed nanoscale coordination polymers (NCPs), are a new class of
hybrid nanomaterials crafted from metal connecting points and organic bridging ligands.
These materials can be tailored for biomedical applications by direct incorporation of
functionalities into the framework or via post-synthesis modification of an existing
framework structure.41-44 Due to the presence of tunable pores and channels in many types of
NMOF materials, it is also possible to encapsulate hydrophobic or charged agents into
NMOFs through noncovalent interactions.45-48 This chapter highlights recent advances in the
design and synthesis of hybrid silica and NMOF nanoparticles and their applications in
cancer chemotherapy.
1.2 Synthesis and Functionalization of Hybrid Nanomaterials
1.2.1 Silica Nanomaterials
The synthesis and functionalization of silica nanoparticles has been extensively
reviewed elsewhere;49-51 only the synthetic strategies will be briefly discussed here. Two
major strategies are used to synthesize silica nanoparticles: the sol-gel synthesis and reverse
6
in size from 50 nm to 2 µm was first reported in 1968 by Stöber and co-workers.52 This
method involves the controlled hydrolysis and condensation of a silica precursor, such as
tetraethyl orthosilicate (TEOS), in ethanol using ammonia as a catalyst (Figure 1-1a). The
particle size can be tuned by adjusting the reaction conditions. For example, adjusting the
TEOS concentration from 0.05 M to 0.67 M while keeping the other reactant conditions
constant affords silica particles from 20 to 880 nm in size.53 These particles remain stable in
solution due to electrostatic repulsion from the negatively-charged silica particles. Another
common method for the synthesis of monodisperse silica nanoparticles uses reverse phase, or
water-in-oil, microemulsions (Figure 1-1b).53-56 Reverse phase microemulsions are highly
tailorable systems that consist of nanometer-sized water droplets stabilized by a surfactant in
a predominantly organic phase. The micelles in the microemulsion essentially act as
“nanoreactors” that assist in controlling the kinetics of particle nucleation and growth. The
size and number of micelles within the microemulsion can be tuned by varying the water to
surfactant ratio (W). This method allows for careful control of particle size and
polydispersity. The reverse microemulsion method is superior to the Stöber method for
7
Figure 1-1: Methods for synthesizing solid silica nanoparticles. (a) The Stöber method, in which
the hydrolysis and condensation of TEOS is facilitated by base in ethanol/water: TEM micrograph shows 125 nm silica nanoparticles.57 (b) The reverse phase microemulsion, in which TEOS is
hydrolyzed at the micellar interface and enters the aqueous droplet to form a silica nanoparticle within the micelle. TEM micrograph shows 37 nm silica nanoparticles.56 The scale bars indicate 200 nm.
Solid silica nanoparticles can be functionalized for drug delivery using several
strategies. The simplest method is to entrap hydrophillic functional molecules within the
silica matrix via noncovalent interactions. This method was widely used to incorporate
luminescent dyes (such as the cationic fluorophore Ru(bpy)32+) within the anionic silica
matrix.58 However, the entrapped molecule can leach out of the nanoparticle under
physiological conditions, limiting the stability and utility of the nanoconstruct. Alternatively,
therapeutic agents can be covalently incorporated into silica nanoparticles by using
trialkoxysilane-derived molecules that contain suitable moieties. These molecules are
incorporated within the silica matrix through silanol linkages during particle synthesis,
leading to stable hybrid silica nanoparticles with agents incorporated uniformly throughout
the silica matrix. The silica nanoparticles can also be post-synthetically modified by reacting
Post-8
synthesis grafting is particularly useful for modifying the particle surface selectively. The
synthetic versatility also allows the incorporation of different cargoes in multi-step
sequences. After the desired organic functionality is attached to the silica nanoparticles, the
nanoparticles can be further modified using traditional conjugation chemistry. For example,
an amine-modified particle can be reacted with various carboxylate-containing molecules to
form a stable amide bond. The cargoes can also be conjugated to the nanoparticle surface by
electrostatic interactions. Another popular strategy is to create a core-shell nanoparticle of a
small inorganic nanoparticle or nanoparticles embedded within a silica matrix. 59-61
1.2.2 Mesoporous Silica Nanoparticles
MSNs are typically synthesized using a surfactant-templated sol-gel method (Figure
1-2). 62-63 They provide a unique platform for the development of hybrid nanoparticles due to
their high surface areas and tunable pore structures. MCM-41 type materials, for example,
possess a hexagonal array of one dimensional channels with diameters that can be tuned from
2–10 nm.64 Synthetic procedures have been developed for controlling the morphologies of
MCM-41 materials,65-66 leading to mesoporous silica nanospheres with diameters ranging
from 60 to 1100 nm that have been utilized in a variety of applications, including catalysis,
9
Figure 1-2: Schematic demonstrating the synthesis of MCM-41 type MSN particles. The cationic surfactant molecules self-assemble into hexagonal arrays in aqueous solution and the silica precursors then hydrolyze and condense along the exterior of the micelles to form a mesoporous material after surfactant removal.
MSNs can be covalently functionalized using two different approaches, either via
condensation or by post-synthesis grafting. Victor Lin and coworkers have reported a
co-condensation method for incorporating various organic functional groups into the pores of
MSN.63, 76-77 This co-condensation method has been extended in our lab to incorporate
gadolinium chelates for MRI imaging.74 The desired triethoxysilane is condensed into the
walls of the MSNs during synthesis of the nanoparticle resulting in the uniform incorporation
of the organic functionality throughout the particles. The degree of functionalization and
particle size can be modified by adjusting the reagent concentration, size, and the
hydrophobicity or hydrophillicity of the co-condensing reagents. However, not all types of
MSN nanoparticles can be made by this method, as the organically-modified triethoxysilane
can destabilize the surfactant templates during the synthesis, leading to large, rod-like
particles (≈1000 nm).77 The organic functionality can also have a pronounced effect on the
pore structure of the nanoparticle.
Alternatively, as-synthesized MSNs can be functionalized via post-synthesis
modification, for example, by reacting MSN nanoparticles with a variety of trialkoxysilanes
to affect condensation with silanol groups on the silica surface. This method allows the
10
inhomogeneous surface coverage of the nanoparticle, as the particle exterior surface and pore
entrances are kinetically more accessible. This feature can also be exploited to selectively
modify the exterior surface of the nanoparticles before the extraction of the surfactant in the
channels. The surfactant is then removed and the interiors of the pores can then be
differentially functionalized. The organically-modified MSN nanoparticles can be further
modified with biomedically-relevant molecules.
1.2.3 Nanoscale Metal-Organic Frameworks
As the synthesis of nanoscale and microscale MOFs has recently been reviewed,42, 44,
78 only general synthetic strategies will be outlined here. Four general methods have been
utilized to synthesize NMOFs: nanoprecipitation, solvothermal, reverse microemulsion, and
surfactant-templated solvothermal. The first method tends to yield amorphous materials,
while the latter three methods can afford crystalline materials, owing to the ability to exert
better control on nanoparticle nucleation and growth kinetics. The first two methods are
surfactant free, whereas the last two methods rely on surfactants not only to control the
11
Figure 1-3: a) Surfactant-free synthesis of NMOFs by mixing NMOF precursors in appropriate solvents. In the nanoprecipitation method, the NMOF forms rapidly at room temperature, whereas in the solvothermal method, heating the solution leads to more controlled particle growth. b) and c) SEM images of amorphous79 or crystalline80 NMOFs.
In a typical NMOF synthesis, precursor solutions are mixed together to allow particle
nucleation and growth (Figure 1-3a). In the nanoprecipitation method, nanoparticles form
because the particles are insoluble in the solvent system whereas the individual precursors
remain soluble. Due to the rapid particle growth, NMOFs produced by this method tend to be
amorphous (Figure 1-3b). Solvothermal synthesis of NMOFs can be achieved with either
conventional or microwave heating. Because high reaction temperatures are involved in the
solvothermal method, more extensive transformations of the precursors typically occur
before NMOF nanoparticle formation and favor the creation of more stable crystalline
materials (Figure 1-3c). Temperature and heating rate provide additional parameters to
control NMOF particle nucleation and growth. Surfactant-assisted synthesis of NMOFs can
be carried out at either room or elevated temperatures. Because the building blocks for
NMOFs are typically water soluble, reverse microemulsions provide another method to
control the nucleation and growth kinetics of NMOF particles. Reverse microemulsions are
formed by using surfactants to stabilize water droplets within a nonpolar organic phase
12
solvothermal conditions (Figure 1-4a) by coating the surfaces of growing NMOF particles.
Surfactant molecules play an important role in defining NMOF morphologies. The four
general methods described above have been adopted to synthesize a variety of NMOFs. With
the ability to independently adjust NMOF precursors, reaction solvents, pH values,
temperatures, surfactant or other templating molecules, W values, and other parameters, a
range of NMOFs with well-defined compositions and morphologies have been synthesized. It
has also been shown that surface termination can be an important parameter in defining
NMOF morphologies.46, 81 Although the synthesis of NMOFs has been phenomenologically
described, there is little study on the NMOF growth mechanism and kinetics. Fundamental
understanding of NMOF growth mechanism and kinetics will facilitate the development of
NMOFs as a promising class of hybrid nanomaterials for biological and biomedical
applications.
Figure 1.4: a) Surfactant-templated NMOF synthesis, either conducted with reverse microemulsions at room temperature or surfactant-assisted solvothermal reactions. b)82 and c)83 show SEM images of crystalline NMOFs synthesized by these methods.
NMOF materials tend to dissociate rapidly in aqueous media, so they must be
13
encapsulate NMOFs within a silica shell.79-80, 84-86 Briefly, the as-synthesized NMOFs were
treated with polyvinylpyrollidone, then coated with a shell of amorphous silica in basic
ethanol. The silica shell thickness could be controlled by varying the reaction parameters and
the silica shell could be further functionalized with a variety of silyl-derived molecules. An
alternative procedure to coat NMOFs with silica also was developed using sodium silicate as
the silica source in aqueous media for NMOFs that are unstable under basic conditions.80 The
silica shell could significantly retard, but not entirely prevent, NMOF decomposition. Our
group has also developed a method to coat NMOFs with a lipid bilayer.87 The lipid bilayer
could drastically improve the stability of NMOFs under physiological conditions and could
be functionalized to contain additional moieties (targeting molecules, fluorescent dyes).
Several groups have demonstrated the coating of NMOFs with biocompatible polymers via
coordination to surface metal centers. 46, 88-89 These polymers could be used to increase
NMOF stability, improve biocompatibility, and modulate MRI relaxivity. Additional active
agents or targeting molecules could be conjugated to the NMOF through these polymers.
1.3 Therapeutic Applications of Hybrid Materials
1.3.1 Silica Based Materials
Hybrid silica nanoparticles have been used in drug delivery and therapy applications.
Prasad and coworkers described the use of an organically-modified silica nanoparticle for
photodynamic therapy (PDT).90 PDT is a light-activated treatment for cancer and other
diseases, and works by utilizing light sensitive drugs (i.e. photosensitizers) that can be
preferentially localized in malignant tissues. PDT’s therapeutic effect is initiated by
14
oxygen (1O2). This leads to selective and irreversible destruction of diseased tissues, without
damaging adjacent healthy ones. The main drawback to this therapy is that currently
approved PDT photosensitizers absorb in the visible spectral region below 700 nm, where
light penetration into the skin is only a few millimeters. This problem can be overcome by
combining a two-photon absorbing (TPA) dye with the photosensitizer. Here, the
photosensitizer is indirectly excited through fluorescence resonance energy transfer (FRET).
In this work, a known photosensitizer and a two-photon energy donor were co-encapsulated
in a ~30 nm silica nanoparticle (Figure 1-5). Upon two-photon irradiation, the
photosensitizer is excited as a result of intraparticle FRET from the two-photon absorbing
dye, resulting in the generation of singlet oxygen and other reactive oxygen species. The
uptake of these particles was demonstrated through fluorescence imaging of HeLa cells.
Upon two-photon irradiation, HeLa cells that had been incubated with the nanoparticles
exhibited drastic morphology changes associated with cell necrosis, apparently induced by
the reactive oxygen species generated by the photosensitizer. Prasad and coworkers
developed a similar system where a photosensitizer was covalently incorporated within a 20
nm silica nanoparticle.91 These nanoparticles are rapidly taken up
in vitro and demonstrate
15
Figure 1.5: Schematic showing an organically-modified silica nanoparticle co-encapsulating two-photon absorbing fluorescent dye aggregates and a photosensitizing drug for two-photon photodynamic therapy.90
Silica nanoparticles have been extensively studied as DNA carriers for gene
therapy.62, 92-96 For example, Prasad and coworkers have developed a fluorescently-labeled
silica nanoparticle with a cationic surface coating.92, 95 Gel electrophoresis studies revealed
that the particles efficiently bind DNA via electrostatic interactions and prevent enzymatic
degradation of the encapsulated DNA. Confocal microscopy studies revealed that the
nanoparticles were internalized by cells in vitro with the released DNA migrating to the
nucleus. Further in vivo studies showed that the particles were able to successfully transfect
and modulate the activity of neural cells in a murine model.92 The transfection efficiency
was equal to or exceeded that of a viral vector and no particle-related toxicity was observed
after 4 weeks.
Jiang and coworkers have reported a system of hollow chitosan-silica nanospheres
fabricated in aqueous medium.97 The anticancer drug doxorubicin was loaded within the
interior of the nanosphere (8.9 wt %). Drug release was found to be pH sensitive, with
minimal release occurring at pH = 7.4; however, the drug is rapidly released at pH=4.
16
doxorubicin, presumably by more efficient drug uptake. A similar chitosan-silica nanosphere
system was used for the treatment of breast cancer in vitro and in vivo with tumor necrosis
factor alpha (TNF-α).98 TNF-α was electrostatically bound to the nanosphere and a targeting
antibody was covalently attached to the surface. The TNF-α conjugated nanospheres
possessed time and concentration dependent cytotoxic effects on MCF-7 breast cancer cells
(Figure 1-6) with targeting increasing nanoparticle localization to the cell surface. In vivo
assays using a breast cancer xenograft model demonstrated that nanoparticle-bound TNF-α
enhanced tumor growth inhibition compared to free TNF-α or the non-treated control.
Corma and coworkers have developed liposomal doxorubicin nanoparticles with a
poly(silsesquioxane) shell.99 In vitro assays against human glioma cells demonstrated that
the nanospheres were able to kill the cells, reaching mortality rates of 44%, compared to 90%
for the free drug. Fluorescence microscopy images revealed that the nanospheres enter the
cells and release doxorubicin. Botella and coworkers designed a silica nanoparticle-based
system for the systemic delivery of the anticancer drug camptothecin.100 Camptothecin was
covalently linked to the nanoparticle surface, which was further modified to contain a
fluorescent dye. The nanoparticle-conjugate showed minimal background release.
Preliminary in vitro cytotoxicity assays revealed that the nanoparticles were efficiently
internalized by cells, but the efficacy of the nanoparticle conjuagate was less than free
camptothecin. In vivo biodistribution and efficacy studies were performed in colon cancer
xenografts. Nanoparticle conjugation increased tumor camptothecin concentration compared
to the free drug. Additionally, nanoparticle-delivered camptothecin treatment delayed tumor
17
Figure 1-6: Cytotoxicity of TNF-α loaded chitosan-silica nanospheres. a) Cytotoxicity effect of TNF-α loaded chitosan-silica nanospheres at the same concentration (500 ng/mL TNF-α) with different incubation times. b) Concentration dependent cell viability of TNF-α loaded chitosan-silica nanospheres incubated for 4 hours. c) Fluorescent photos of MCF-7 cells demonstrating the time-dependent cytotoxicity effect of the nanocarriers by acridine orange (green color, live cells) and propidium iodide (red color, dead cells) staining. D) Fluorescent photos of MCF-7 cells demonstrating concentration dependent cytotoxicity effect after 48 hours incubation by acridine orange and propidium iodide stain. Scale bar is 50 µm.98
1.3.2 Mesoporous Silica Nanoparticles
Due to their unique properties, mesoporous silica nanoparticles have been extensively
evaluated as drug delivery vehicles. Victor Lin and coworkers first demonstrated the use of
MCM-41 nanoparticles for the delivery of a membrane impermeable protein, cytochrome
C.69 After removing the surfactants from large-pore (5.4 nm) MSN particles, cytochrome C
18
measured in PBS at two different pH values (7.4 and 5.2) over a 25 hour period. The total
percentages of proteins that were released were 45 and 55% at pH values of 7.4 and 5.2,
respectively. The difference in release was attributed to the extent of negative charge on the
MSN surface, which favorably interacts with the positively-charged protein. No significant
release of the protein was detected within the first 4 hours at pH 7.4, which allowed for the
introduction of protein-loaded particles into cell culture at physiological pH without losing a
large amount of the entrapped protein due to burst release. The released cytochrome C was
found to retain catalytic activity for the oxidation of
2,2’-azino-bis(3-ethylbenzthiazoline-6-sulfonate) (ABTS) by hydrogen peroxide. HeLa cells could internalize the loaded MSN
particles and confocal microscopy showed escape of the protein from endosomal entrapment.
MSN systems were also used to deliver cysteine to cells.101 The covalently attached cysteine
does not release from the MSNs in the absence of a reducing agent; however, all cysteine
was released within 1 h after the addition of a suitable reducing agent. In vitro assays against
HeLa cells demonstrated that the conjugated nanoparticle was 444 times more effective in
19
Figure 1-7: Schematic of the Au nanoparticle-capped MSN-based drug delivery system. The controlled release of the cargo is based on UV irradiation.102
Victor Lin and coworkers pioneered the development of MSN-based drug delivery
systems where the nanoparticle pores are capped by a stimuli-responsive system to allow
controlled cargo release.102-104 As an example shown in Figure 1-7, the gold nanoparticles
were conjugated to the MSN materials with a photolabile linker.102 The hybrid system will
release the Au nanoparticle pore caps when exposed to UV irradiation. This system was used
to deliver paclitaxel to human liver and fibroblast cells. After UV irradiation, significant
decreases in cell viability were observed. Other drug molecules and neurotransmitters, such
as vancomycin and adenosine triphosphate (ATP), have also been delivered using this
strategy.103-104
A double drug delivery system was also developed based on capped MSN
nanoparticles.105 Boronic acid functionalized MSN nanoparticles were loaded with cyclic
the m was s boron entrap frame low c mann Figur netwo “gate ancho (RAF the re cross material were
shown to be
nic acids on
pped cAMP
e without glu
cytotoxicity
ner.
re 1-8: Sche ork capped m
Feng and
ekeeper” for
ored to the M
FT) polymer
elease of car
-linking of t
e then capped
triggered by
the nanopar
was release
ucose. Preli
and were ab
ematic of a r mesoporous
coworkers d
MSN (Figur
MSN surface
rization and t
rgos was dem
the polymer.
d with fluore
y saccharides
ticles. In a 5
ed within 20
minary in vi
ble to deliver
edox-respon silica.106
demonstrated
re 1-8).106 P
e through rev
then cross-li
monstrated b
A light-act
20 escein-labele
s, as they for
50 mM solut
hours, with
itro assays d
r cAMP to pa
nsive nanoga
d the use of
Poly(N-acryl
versible addi
inked by add
by entrapping
tivated nanoi
ed insulin. R
rm more stab
tion of gluco
less than 10
demonstrated ancreatic cel ated ensembl a cross-linke oxysuccinim ition-fragme ding cystami g rhodamine impeller-con Release from ble conjugat
ose in PBS, 8
0% released i
d that the ma
lls in a dose
le based on p
ed polymer n
mide) (2nm t
entation chai
ine. The abi
e B inside the
ntrolled drug
m the materia
tes with the
80% of the
in the same t
aterials show
dependent
polymeric
network as a
thick) was
in transfer
lity to contro
e MSN befo