IDENTIFYING GENETIC FACTORS AFFECTING ANTHRACYCLINE-INDUCED CYTOTOXCITY
Brent D. Hehl
A thesis submitted to the faculty of the University of North Carolina at Chapel Hill in partial fulfillment of the requirements for the degree of Master of Science in the School of Medicine, Department of Pharmacology.
Chapel Hill 2012
iii
ABSTRACT
BRENT D. HEHL: Identifying Genetic Factors Affecting Anthracycline-Induced Cytotoxcity (Under the direction of Howard McLeod, PharmD)
The molecular mechanisms responsible for anthracycline-induced cytotoxicity have been elusive despite intensive research over the past half century. Here, hits from a genome-wide association (GWA) screen seeking to identify genetic factors influencing drug-dose response were validated using a shRNA approach. The initial screen examined the phenotypic response of over 500 CHORI patient lymphoblastoid cell lines (LCLs) to the anthracyclines daunorubicin, epirubicin, and doxorubicin. Five candidate genes were identified from statistical correlation between intrinsic genomic differences and phenotype variability across the population of cell lines.
v
ACKNOWLEDGEMENTS
This body of work wouldn’t exist without the contributions of a number of wonderful people, especially Tammy Havener, Bill Small, and Chad Brown. Thank you for providing generous
amounts of your time, patience, and technical expertise.
For whom much is owed, Howard McLeod. Your guidance will have a longstanding impact.
I’m very grateful to Carol Otey and Rob Nicholas for their commitment and advocacy on my behalf.
The team at Gentris, especially Scott Clark and Carrie Browning
Thank you to my fellow lab members, the Department of Pharmacology, and my committee for the training and various engaging experiences along the way.
vi
TABLE OF CONTENTS
LIST OF TABLES ... vii
LIST OF FIGURES ... viii
LIST OF ABBREVIATIONS ... ix
CHAPTER 1: Background ... 1
CHAPTER 2: Materials and Methods ... 8
CHAPTER 3: Results ... 14
CHAPTER 4: Discussion ... 23
APPENDIX ... 27
vii
LIST OF TABLES
Table
1. Proportion of Raw Data Affected by Each Quality Control Step ...11
2. Candidate Genes...16
3. Selected CHORI cell lines...17
viii
LIST OF FIGURES
Figure
1. Cellular factors affecting doxorubicin (DOX) response...2
2. Anthracycline Chemical Structures...6
3. Doxorubicin GWAS...15
4. CHORI cell line selection...17
5. Generation of Stable Cell Lines...19
ix
LIST OF ABBREVIATIONS
ADTRP: androgen-dependent TFPI-regulating protein AUC: area under the curve
CHORI: Children’s Hospital of Oakland Research Institute CSMD3: CUB and Sushi multiple domains 3
CV: coefficient of variation DMSO: dimethyl sulfoxide DNA: deoxyribonucleic acid DNR: daunorubicin
DOX: doxorubicin EPI: epirubicin
FHIT: fragile histidine triad GWA: genome-wide association LCL: lymphoblastoid cell line PELI2: pellino 2
PGx: pharmacogenomics or pharmacogenetics, interchangably RFU: relative fluorescence unit
shRNA: short hairpin RNA
SLC24A3: solute carrier family 24 (sodium/potassium/calcium exchanger), member 3 SNP: single nucleotide polymorphism
CHAPTER 1
BACKGROUND
While the promise of genetic screening and personalized medicine has yet to be fully realized in the post-Human Genome Project world [1], a better understanding of the influence of individual genetic variation on established methods of pharmacological intervention will positively affect current standards of care [2]. Tools that model genetic diversity, such as lymphoblastoid cell lines (LCLs), have proven effective in identifying loci affecting drug-response phenotypes [3]. This study employs the advantages (natural genomic variation and experimentally tractability) of the LCL system in efforts to better understand genes involved in the mechanism of anthracycline action.
2
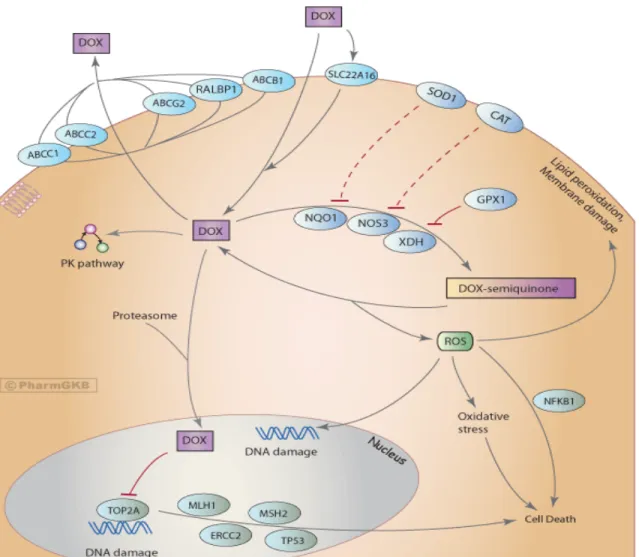
Anthracycline antineoplastic, cardiotoxic, and drug resistance mechanism(s) are vigorously debated [11, 12]. Intriguingly, several different pathways are thought to meditate these effects (Figure 1), promising the hope of developing more effective and less toxic analogues. Anthracycline-DNA intercalation and damage induce cancer cell apoptosis, while in the heart, iron-mediated free radical generation has been shown to disrupt mitochondria to deleterious effect. Proposed resistance mechanisms include induction of drug metabolizing enzymes and transporters, as well as modulation of DNA damage and oxidative stress pathways [13].
3
Figure 1: Continued
Rather than a single molecular target, a diverse set of cellular factors (transporters, oxidative signaling components,
interactions with the proteasome, and DNA-repair/signaling proteins) contribute to doxorubicin’s antineoplastic
efficacy. It has been shown that tumors that establish chemo-resistance to DOX both modulate expression of and
accumulate mutations within these pathways.
Antitumor activity: Early work in the 1970s revealed that anthracyclines bind nucleic acid and inhibit DNA synthesis [14], as well as induce protein-associated dsDNA breaks [15]. Topoisomerase II (TOP2A) [16, 17] was later discovered to mediate anthracycline-induced DNA lesions and activate DNA-damage apoptotic pathways, although the contribution of these pathways in the antitumor response isn’t entirely clear in context of heterogeneous malignancies [18, 19]. Studies have also investigated the sequence specificity of anthracycline-DNA binding, which causes genotoxic stress by blocking transcription factor binding [20, 21]. Interestingly, anthracyclines also inhibit the proteasome, affecting protein turnover and cellular signaling [22]. Albeit controversial [12], the role of free radical formation also plays a role in apoptotic (nuclear signaling) and cardiotoxic (mitochondrial disruption) effects.
4
Specific characteristics of cardiomyocytes related to oxidative capacity have been proposed to explain their susceptibility to anthracycline stress [24, 25]. In comparison to other tissues, the heart contains relatively low concentrations of regenerative antioxidants such as glutathione and catalase, and higher amounts of iron, an important metal species in the generation of reactive oxygen species. Anthracycline metabolites (oxidative stressors) have a long half-life and seem to preferentially accumulate in heart tissue [26]. As systemic blood levels of antioxidants also diminish upon anthracycline treatment, it is tempting to speculate that the heart may be exposed to a greater oxidative stress that it, as particularly susceptible to free radical damage, can reasonably accommodate. Many animal studies investigating the cardio-protective effects of various antioxidants in context of anthracycline treatment corroborate this line of reasoning, while similar protocols in human clinical trials have been disappointing in their inability to demonstrate any cardio-protective benefit [24].
Anthracycline Family
In the body of work described here, three members of the anthracycline family were examined: daunorubicin, doxorubicin, and epirubicin.
Daunorubicin [6]: Daunorubicin (DNR) was independently discovered by both Di Marco and Dubost in the late 1950s and early 1960s. A natural product from the soil microbe Streptomyces peucetius, it saw great use in the 70s and 80s against a wide variety of neoplasms.
5
Doxorubicin [6]: Doxorubicin is very similar in chemical structure to DNR and can also be considered a natural product, however it was isolated from a mutagenized strain of Streptomyces. Approved after only six years of clinical testing, doxorubicin (DOX) is the most
potent anthracycline and mainly used in highly effective liposomal preparations (Doxil™) against breast, small-cell lung, and ovarian carcinomas, and many sarcomas as well. Skin, colon and renal cancer are some of the few cancer types that do not respond to doxorubicin (DOX). Due to its incorporation into drug cocktails targeting a wide number of neoplasms, annual sales are currently maintained over $500 million, nearly fifty years after its identification [28].
6
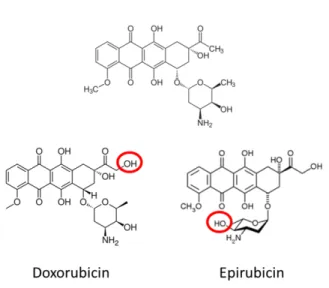
Figure 2: Anthracycline Chemical Structures
The three anthracyclines in our screen are remarkably similar, with the minor chemical differences from DNR
highlighted in red.
Genome-Wide Association (GWA) studies
Genome-wide approaches [31-34] have been developed to interrogate drug function, examine biological mechanisms, and identify molecular targets. A more clear understanding of such information enables the development of next-generation pharmaceuticals that minimize underlying toxicity, resistance, and/or boost efficacy.
7
CHAPTER 2
MATERIALS AND METHODS
Cell Culture
CHORI (Children’s Hospital of Oakland Research Institute) generously donated EBV-transformed lymphoblastoid cell lines [35]. These CHORI lines were cultured in Roswell Park Memorial Institute (RPMI) medium (Invitrogen) supplemented with 15% fetal bovine serum (Sigma) and 100U/mL Penicillin and Streptomycin (Cellgro).
For stable cell line selection, Puromycin was added to the media at a final concentration of 1.0 µg/mL. Cell cultures were incubated at 37ºC and 5% CO2 in a humidified incubator. A Z1 Coulter Particle Counter (Beckman Coulter) was used to count cell concentrations. Cell lines were frozen into aliquots for use in future experiments and a new vial was used for each of the three replicates performed in this study.
Production of Lentiviral Particles
9
For each transfected plasmid, 1x10⁶ HEK-293T cells were seeded into a 6 cm cell culture dish overnight. The media was replaced with 5 mL antibiotic-free media for 8 hours. The transfection was then performed using 1 µg of each pLKO.1 shRNA plasmid with 750 ng of psPAX2 packaging plasmid and 250 ng pMD2.G envelope plasmid in 20 µl of serum-free OPTI-MEM (Invitrogen). The plasmid DNA mixture was mixed with 80 µl of OPTI-OPTI-MEM containing 6 µl FuGENE 6 (Promega) and incubated for 30 minutes. The mixture was then added to the HEK-293T cells for 18 hrs, after which media was replaced with 5 mL fresh DMEM. The virus-containing media was collected and stored at 4°C 24h and 48h post-transfection, with 5 mL fresh media added to the cells after collection.
Transduction of Cell Lines
Five pools per each targeted gene of virus-containing media were combined and added to CHORI cell lines. One mL of transduction particle supernatant was added to 1 mL (1x10⁶ cells) of each of the CHORI cell lines. Media was replaced after 24 hours and 1 µg/mL of puromycin was added 48 hrs post-infection to select for transduced cells. Cells were under selection for 1 week with fresh puromycin added at day 4.
Knockdown Quantification
10
Inhibitor Cocktail 2 (Sigma, St. Louis, MO). An aliquot was used for protein quantitation determination using the BCA protein assay kit (Pierce Technology, Inc., St. Louis, MO). The remaining sample was mixed with 0.5 vol of 3x SDS sample buffer (1x equals 31.25 mM Tris-HCl (pH 6.8), 2% SDS, 5% 2-mercaptoethanol, 10% sucrose, and 0.005% bromophenol blue) and heated for 5 minutes at approximately 95oC. Equivalent protein amounts were run on SDS-PAGE in Tris/glycine/SDS buffer using 10% acrylamide gels. Resolved proteins were then transferred to PVDF membranes. The blots were blocked using a 5% solution of nonfat dry milk in 20mM Tris-HCl, pH7.4, 140mM NaCl, 0.1% Tween 20 and exposed to antibodies in the same buffer. Rabbit anti-human TOP2 (kind gift of Dr. Jack Griffith) was used to detect TOP2. Anti-β-actin (Sigma) was used as a loading control. Horseradish peroxidase-conjugated secondary antibodies were used as needed with ECL detection reagent (GE Healthcare Bio-Sciences Corp.) to visualize immunoreactive bands. Protein levels were quantified from autoradiographs scanned with an Agfa Duoscan T2500 scanner (Agfa Corp.) followed by densitometry using NIH Image 1.61.
Cytotoxicity assay
11
(Tecan) 24 hours later. Three independent biological replicate experiments were performed, each with quadruplicate technical replicates for each experimental condition.
Quality control pipeline
The fluorescence data were processed through a quality control pipeline before being converted into percent cell viability at each drug concentration, per Equation 1 below. Briefly, any plate whose 90th percentile was below 2000 relative fluorescence units (RFUs) was assumed to contain mostly dead cells, and was removed from subsequent analysis. Next, positional effects (within a 2x12 group of 6 quadruplicate replicates, statistically significant (p<0.01) with effect sizes >1500 RFUs) were also examined. Third, a coefficient of variation (CV) screen was performed. If the CV >0.2, the deviate value was replaced with the mean of the other 3 non-deviant replicates. Finally, special care was taken with the 10% dimethyl sulfoxide (DMSO, negative) and vehicle (positive) controls, given their significant impact in calculating % viability. Mean viabilities from the 10% DMSO readings were checked to be within the biologically plausible range of 550 to 900 RFUs. The proportion of data affected by each step is given in Table 1.
Table 1: Proportion of Raw Data Affected by Each Quality Control Step
The high-throughput format of the experimental system is robust, as evidenced by less than 5% total of the overall
data subject to quality control correction measures.
Step Proportion
1 0.021
2 0.012
3 0.013
12
Percent viability was determined from each independent experiment per equation 1. Data were plotted and non-linear (Hill slope) curve fits were applied to generate dose-response graphs. These graphs were utilized to generate IC50, Δ, and mean viability (AUC) values.
Equation 1:
% 𝑉𝑖𝑎𝑏𝑖𝑙𝑖𝑡𝑦= 𝑚𝑒𝑎𝑛𝑚𝑒𝑎𝑛𝑒𝑥𝑝𝑒𝑟𝑖𝑚𝑒𝑛𝑡𝑎𝑙𝑣𝑒ℎ𝑖𝑐𝑙𝑒𝑅𝐹𝑈 − 𝑚𝑒𝑎𝑛𝑅𝐹𝑈 − 𝑚𝑒𝑎𝑛𝑛𝑒𝑔𝑎𝑡𝑖𝑣𝑒𝑛𝑒𝑔𝑎𝑡𝑖𝑣𝑒𝑐𝑜𝑛𝑡𝑟𝑜𝑙𝑐𝑜𝑛𝑡𝑟𝑜𝑙𝑅𝐹𝑈𝑅𝐹𝑈
• Mean RFU (Relative Fluoresence Unit) values were derived from four wells.
• 10% DMSO serves as a negative control against background fluorescence due to media or cellular debris. Water served as vehicle for all drugs in this study.
Statistical analysis methodology
13 Equation 2:
𝐴𝑈𝐶𝑖𝑗𝑘𝑙𝑚= 𝜇+𝑆𝑖+𝐶𝑖𝑗+𝐺𝑘 +𝐷𝑙+𝑅𝑚+𝐺𝐷𝑘𝑙+𝑆𝐺𝑗𝑘+𝐶𝐷𝑖𝑗𝑙+𝐶𝐷𝑅𝑖𝑗𝑙𝑚+∈𝑖𝑗𝑘𝑙𝑚
• AUCijklm is the AUC for the jth cell line having sensitivity i, the kth gene target, the lth drug and the mth replicate.
• Cell line is nested in sensitivity since each cell line has only one level of sensitivity, as opposed to the other factors, which are all crossed.
• To account for their correlation between observations, cell line and replication were modeled as random effects
CHAPTER 3
RESULTS
Genome-wide association analysis and candidate gene selection
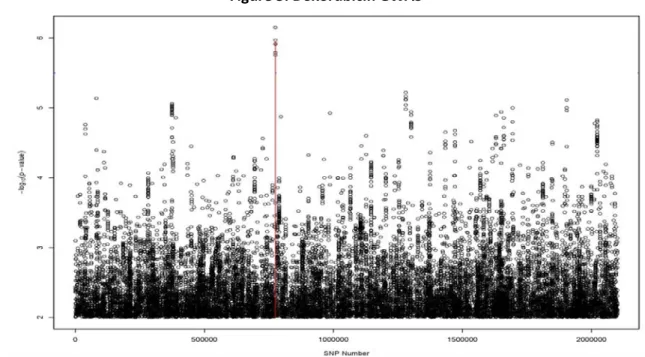
Prior to the work performed here, drug-dose phenotypes were established for over 500 CHORI cell lines across the panel of 29 FDA-approved cytotoxic drugs as established in Peters et al. [36]. Genome-wide SNP profiles were also mapped for each cell line and nonparametric linkage analysis was utilized to identify genomic loci (“hits”) with putative correlation to variation in drug-dose response. Figure 3 outlines a visual representation (Manhattan plot) of the association data for doxorubicin.
15
Figure 3: Doxorubicin GWAS
The relative genome coordinate of each scanned SNP is located on the x-axis (left to right: Chromosome 1 through
Chromosome 23) with the negative log of the statistical association p-value on the y-axis. The greater the y-axis
value, the stronger the association.
16
Table 2: Candidate Genes
Selection of and generation of validation cell lines
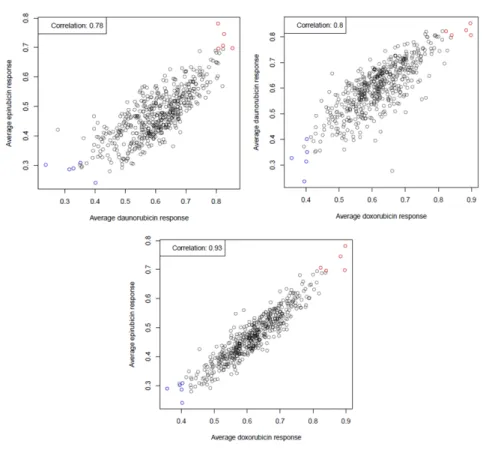
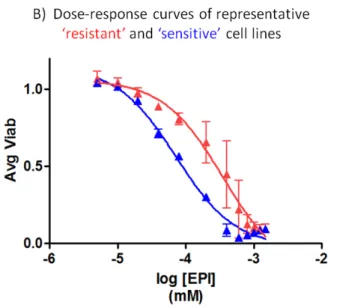
Little to no information is available on the functional impact of each SNP on its respective candidate gene, so we sought to identify a subset of CHORI cell lines suitable for use in the candidate gene validation. As described in Brown et al. [38], various summary statistics are appropriate to describe drug dose-response. We utilized the average viability statistic (the cell line-specific viability average at each tested drug concentration, approximately proportional to area under the curve [AUC]) using the phenotype data from the original screen to identify the sensitivity of all CHORI cell lines to each of the anthracyclines doxorubicin, daunorubicin, and epirubicin. While IC50 is classically used to measure drug response, the viability statistic is also influenced by the shape of the hill slope curve and provides a more appropriate measure of response for our studies here. As seen in Figure 4, the cell lines displayed a robust correlation in dose-response across all three drugs. From the strength of these correlation data, the three most “sensitive” and “resistant” CHORI lines (Table 3) were selected and used for experiments with all three anthracycline drugs.
Gene Official Name TOP2A topoisomerase IIa PELI2 pellino 2
FHIT fragile histidine triad
ADTRP androgen-dependent TFPI-regulating protein CSMD3 CUB and Sushi multiple domains 3
17
Table 3: Selected CHORI cell lines
Figure 4: CHORI cell line selection
A) Each dot corresponds to an individual cell line in the original screen, with the same 5 resistant and sensitive lines
depicted in each comparative plot. The cell lines were well correlated in response across all anthracyclines.
Sensitive Resistant
032098 032174 031634 040722
18
Figure 4: Continued
B) A dose-response plot of a representative sensitive and resistant cell line depicts the nearly 0.75 log difference in
IC50 these lines have to epirubicin.
19
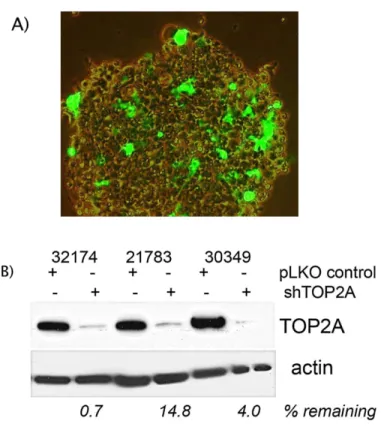
Figure 5: Generation of Stable Cell Lines
A) Infection of CHORI cells by lentivirus loaded with GFP expression plasmids indicates CHORI cells can be genetically
manipulated, however at low efficiency. Puromycin selection was used to establish stable cell line populations.
B) Lysates from three cell lines (both shTOP2A and negative control) were probed for TOP2A protein expression three
weeks after puromycin selection to demonstrate long-term, stable candidate gene knockdown.
Results of Candidate Gene Validation
20
Hypothesis 1: Does gene knockdown affect viability in response to anthracycline exposure?
In this model, a significant percentage of the AUC variability was explained by the gene target (Table 4). After controlling for the effects of replicate, cell line, and drug treatment, PELI2 (p<0.0014) and TOP2A (p<0.0006) (Figure 6) were significantly different in comparison to controls, with PELI2 knockdown conferring a sensitizing effect and TOP2A a resistance effect. Although not quite meeting the threshold of resistance, FHIT (p =0.0522) also had a sensitizing response. Of the six cell lines screened in our validation study, generation of stable FHIT knockdown in 030349 (sensitive) and 021783 (resistant) cell lines was unsuccessful and may influence the FHIT result.
Table 4: Candidate Gene Knockdown p-values
The positive control TOP2A and candidate PELI2 were both shown to significantly affect anthracycline drug-dose
response, with reduction of PELI2 sensitizing cells, and TOP2A knockdown causing resistance. shRNA P-value
ADTRP 0.0968
CSMD3 0.701
FHIT 0.0522
PELI2 0.0014
SLC24A3 0.2624
21
Figure 6: Effects of TOP2A and PELI2 reduction on drug dose-response
TOP2A reduction served as a positive control in this study and authenticated the validation assay's ability to identify
genetic loci important to anthracycline response. shTOP2A cell lines (red) were approximate 1.75 fold more resistant
(via IC50) to epirubicin than negative controls (black), a consistent effect across the drug class.
ADTRP, CSMD3, FHIT, and SLC24A3 failed to validate in this study. A representative dose-response plot is shown for
22
Hypothesis 2: Are viability effects consistent for the entire drug class versus a specific drug?
CHAPTER 4
DISCUSSION
The primary goal of these experiments was to validate hits arising from a pharmacogenomics screen employed to identify variant loci that affect anthracycline dose response. As an important piece of this screening approach, these data are expected to yield new insight into biological mechanisms of anthracycline efficacy and/or identify potential genomic indicators of response and toxicity. The findings indicate that 1) dose-response assays utilizing lentivirus to mediate shRNA gene knockdown are an effective validation strategy; 2) of the candidate genes tested, PELI2 (described further below) is the strongest candidate for further studies investigating its role in anthracycline response; and 3) average viability and AUC are valid statistics to measure drug response.
Method Validation
24
Topoisomerase IIa is a well-established molecular target for anthracyclines [16, 17] and as such, TOP2A-deficient LCLs were generated and tested to determine if the dose-response assay could detect a phenotypic response. As shown by statistically significant increase in AUC (p<0.0006, Supplemental Table 6), cells with reduction in TOP2A were more resistant to anthracyclines. Interestingly, it has also been shown that drug-resistant tumors have similar changes in TOP2A protein levels [18].
Candidate Gene Validation
Of the five candidate genes examined, reduction of ADTRP, CSMD3, and SLC24A3 failed to show any significant cellular response to DNR, DOX, or EPI. While little is known of their individual endogenous functions, it is interesting to consider CSMD3 was recently shown in a whole-exome sequencing analysis to be the second-most mutated gene in lung cancer behind TP53 [39]. Our results do not conclusively exempt the possible impact of these genes on cancer biology, but rather leave them open to future examination. In conjunction with previous evidence, our data support a further investigation of the hits validated in this study.
PELI2: Studies have identified pellino 2, or PELI2, as an important signaling scaffold involved in IL-1-mediated activation of NF-ᴋβ [40]. PELI2 modulates NF-ᴋβ dynamics through its RING E3-ubiquitin-ligase activity [41] and has also been shown to activate MAPK pathways [42]. A significant node in acquired chemotherapy-resistance [43, 44], NF-ᴋβ signaling mediates resistance to anthracyclines [45, 46] and has also been implicated in cardiotoxicity [47].
25
response [40] and may explain its demonstrable effect in our particular cell system. Further studies examining PELI2 involvement in cancer-specific NF-ᴋβ activation may prove clinically relevant given many cancers are thought to undergo “dedifferentiation” [48]. The role of NF-ᴋβ inhibition in reducing both anthracycline-induced cardiotoxicity [47] and drug-resistance [44] lends considerable weight to further exploration of this pathway and its many regulatory modulators.
FHIT: FHIT reduction was seen to sensitize cells to anthracycline exposure, though our results were not statistically significant (p<0.522) and underpowered (n=4) when compared to the other candidate genes (n=6). Regardless, it is interesting to note that FHIT is thought to be a tumor-suppressor and loss or aberrant expression is a hallmark of many cancers of the breast and lung [49]. Further studies with larger samples sizes will be important in determining if our tentative result is biologically relevant.
Measuring drug ‘response’
26
Conclusions
APPENDIX
Supplemental Table 1:
AUC statistic, mean and standard deviation
Table A: Daunorubicin
Control TOP2A PELII2 FHIT ADTRP CSMD3 SLC24A3 32098 10.9 +- 0.51 10.7 +- 0.39 10.6 +- 0.36 10.6 +- 0.44 10.9 +- 0.87 10.7 +- 0.47 10.7 +- 0.33 32174 11.5 +- 0.45 11.4 +- 0.098 11.2 +- 0.27 11.5 +- 0.31 11.6 +- 0.43 11.6 +- 0.5 11.5 +- 0.27 40722 11 +- 0.42 11.1 +- 0.42 11.3 +- 0.23 10.6 +- 0.078 11.4 +- 1.3 10.5 +- 0.32 10.7 +- 0.42 31634 10.9 +- 0.46 11.6 +- 0.23 11.2 +- 0.042 11.1 +- 0.068 11.1 +- 0.14 11.6 +- 0.21 11.1 +- 0.3 30349 10.7 +- 0.27 10.8 +- 0.57 10.2 +- 0.37 10.5 +- 0.86 10.6 +- 0.17 10.6 +- 0.48 21783 11.5 +- 0.42 11.8 +- 1.4 11.3 +- 0.81 11.6 +- 0.71 11.8 +- 0.61 Table B: Doxorubicin
Control TOP2A PELI2 FHIT ADTRP CSMD3 SLC24A3
32098 8.57 +- 0.81 8.7 +- 0.55 7.97 +- 0.77 8.14 +- 0.75 8.44 +- 0.92 8.38 +- 0.52 8.49 +- 0.81 32174 10.2 +- 0.76 10.4 +- 0.26 9.39 +- 0.58 10.2 +- 0.7 10.4 +- 0.87 10.4 +- 0.32 10.1 +- 0.67 40722 9.07 +- 0.37 8.78 +- 0.44 8.44 +- 0.19 8.21 +- 0.75 9.54 +- 1.3 8.13 +- 0.34 8.83 +- 0.38 31634 9.03 +- 0.63 10 +- 0.35 9.23 +- 0.52 9.18 +- 0.7 9.3 +- 0.64 9.87 +- 0.31 9.39 +- 0.7 30349 8.4 +- 0.65 8.78 +- 1.1 7.71 +- 1 8.56 +- 1.5 8.4 +- 0.64 8.58 +- 1.2 21783 10.4 +- 1 10.5 +- 1.8 9.88 +- 1.6 10.2 +- 1.8 10.6 +- 1.3 Table C: Epirubicin
Control TOP2A PELI2 FHIT ADTRP CSMD3 SLC24A3
28
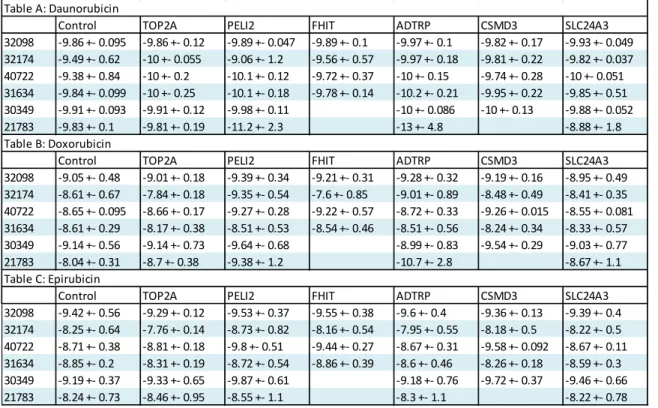
Supplemental Table 2:
log IC50 statistic, mean and standard deviation
Table A: Daunorubicin
Control TOP2A PELI2 FHIT ADTRP CSMD3 SLC24A3
32098 -9.86 +- 0.095 -9.86 +- 0.12 -9.89 +- 0.047 -9.89 +- 0.1 -9.97 +- 0.1 -9.82 +- 0.17 -9.93 +- 0.049 32174 -9.49 +- 0.62 -10 +- 0.055 -9.06 +- 1.2 -9.56 +- 0.57 -9.97 +- 0.18 -9.81 +- 0.22 -9.82 +- 0.037 40722 -9.38 +- 0.84 -10 +- 0.2 -10.1 +- 0.12 -9.72 +- 0.37 -10 +- 0.15 -9.74 +- 0.28 -10 +- 0.051 31634 -9.84 +- 0.099 -10 +- 0.25 -10.1 +- 0.18 -9.78 +- 0.14 -10.2 +- 0.21 -9.95 +- 0.22 -9.85 +- 0.51 30349 -9.91 +- 0.093 -9.91 +- 0.12 -9.98 +- 0.11 -10 +- 0.086 -10 +- 0.13 -9.88 +- 0.052 21783 -9.83 +- 0.1 -9.81 +- 0.19 -11.2 +- 2.3 -13 +- 4.8 -8.88 +- 1.8 Table B: Doxorubicin
Control TOP2A PELI2 FHIT ADTRP CSMD3 SLC24A3
32098 -9.05 +- 0.48 -9.01 +- 0.18 -9.39 +- 0.34 -9.21 +- 0.31 -9.28 +- 0.32 -9.19 +- 0.16 -8.95 +- 0.49 32174 -8.61 +- 0.67 -7.84 +- 0.18 -9.35 +- 0.54 -7.6 +- 0.85 -9.01 +- 0.89 -8.48 +- 0.49 -8.41 +- 0.35 40722 -8.65 +- 0.095 -8.66 +- 0.17 -9.27 +- 0.28 -9.22 +- 0.57 -8.72 +- 0.33 -9.26 +- 0.015 -8.55 +- 0.081 31634 -8.61 +- 0.29 -8.17 +- 0.38 -8.51 +- 0.53 -8.54 +- 0.46 -8.51 +- 0.56 -8.24 +- 0.34 -8.33 +- 0.57 30349 -9.14 +- 0.56 -9.14 +- 0.73 -9.64 +- 0.68 -8.99 +- 0.83 -9.54 +- 0.29 -9.03 +- 0.77 21783 -8.04 +- 0.31 -8.7 +- 0.38 -9.38 +- 1.2 -10.7 +- 2.8 -8.67 +- 1.1 Table C: Epirubicin
Control TOP2A PELI2 FHIT ADTRP CSMD3 SLC24A3
29
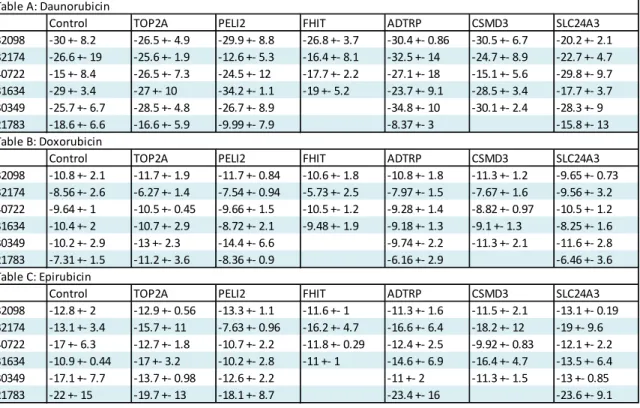
Supplemental Table 3:
Hill-slope statistic, mean and standard deviation
Table A: Daunorubicin
Control TOP2A PELI2 FHIT ADTRP CSMD3 SLC24A3
32098 -30 +- 8.2 -26.5 +- 4.9 -29.9 +- 8.8 -26.8 +- 3.7 -30.4 +- 0.86 -30.5 +- 6.7 -20.2 +- 2.1 32174 -26.6 +- 19 -25.6 +- 1.9 -12.6 +- 5.3 -16.4 +- 8.1 -32.5 +- 14 -24.7 +- 8.9 -22.7 +- 4.7 40722 -15 +- 8.4 -26.5 +- 7.3 -24.5 +- 12 -17.7 +- 2.2 -27.1 +- 18 -15.1 +- 5.6 -29.8 +- 9.7 31634 -29 +- 3.4 -27 +- 10 -34.2 +- 1.1 -19 +- 5.2 -23.7 +- 9.1 -28.5 +- 3.4 -17.7 +- 3.7 30349 -25.7 +- 6.7 -28.5 +- 4.8 -26.7 +- 8.9 -34.8 +- 10 -30.1 +- 2.4 -28.3 +- 9 21783 -18.6 +- 6.6 -16.6 +- 5.9 -9.99 +- 7.9 -8.37 +- 3 -15.8 +- 13 Table B: Doxorubicin
Control TOP2A PELI2 FHIT ADTRP CSMD3 SLC24A3
32098 -10.8 +- 2.1 -11.7 +- 1.9 -11.7 +- 0.84 -10.6 +- 1.8 -10.8 +- 1.8 -11.3 +- 1.2 -9.65 +- 0.73 32174 -8.56 +- 2.6 -6.27 +- 1.4 -7.54 +- 0.94 -5.73 +- 2.5 -7.97 +- 1.5 -7.67 +- 1.6 -9.56 +- 3.2 40722 -9.64 +- 1 -10.5 +- 0.45 -9.66 +- 1.5 -10.5 +- 1.2 -9.28 +- 1.4 -8.82 +- 0.97 -10.5 +- 1.2 31634 -10.4 +- 2 -10.7 +- 2.9 -8.72 +- 2.1 -9.48 +- 1.9 -9.18 +- 1.3 -9.1 +- 1.3 -8.25 +- 1.6 30349 -10.2 +- 2.9 -13 +- 2.3 -14.4 +- 6.6 -9.74 +- 2.2 -11.3 +- 2.1 -11.6 +- 2.8 21783 -7.31 +- 1.5 -11.2 +- 3.6 -8.36 +- 0.9 -6.16 +- 2.9 -6.46 +- 3.6 Table C: Epirubicin
Control TOP2A PELI2 FHIT ADTRP CSMD3 SLC24A3
Supplemental Figure 1a:
CHORI line 032098
Daunorubicin response
Doxorubicin response
31
Supplemental Figure 1b:
CHORI line 032174
Daunorubicin response
Doxorubicin response
32
Supplemental Figure 1c:
CHORI line 040722
Daunorubicin response
Doxorubicin response
33
Supplemental Figure 1d:
CHORI line 031634
Daunorubicin response
Doxorubicin response
34
Supplemental Figure 1e:
CHORI line 030349
Daunorubicin response
Doxorubicin response
35
Supplemental Figure 1f:
CHORI line 021784
Daunorubicin response
Doxorubicin response
REFERENCES
1. Bates, S., Progress towards personalized medicine. Drug Discovery Today, 2010. 15(3–4): p. 115-120.
2. Huang, S.-M., et al., Application of Pharmacogenomics in Clinical Pharmacology. Toxicology Mechanisms and Methods, 2006. 16(2-3): p. 89-99.
3. Wheeler, H.E. and M.E. Dolan, Lymphoblastoid cell lines in pharmacogenomic discovery and clinical translation. Pharmacogenomics, 2011. 13(1): p. 55-70.
4. Arcamone, F., Adriamycin, 14-hydroxydaunomycin, a new antitumor antibiotic from S. peucetius var. caesius. Biotechnology and bioengineering, 1969. 11(6): p. 1101-10.
5. Cortés-Funes, H. and C. Coronado, Role of anthracyclines in the era of targeted therapy. Cardiovascular Toxicology, 2007. 7(2): p. 56-60.
6. Weiss, R.B., The anthracyclines: will we ever find a better doxorubicin? Seminars in oncology, 1992. 19(6): p. 670-86.
7. Kaye, S. and S. Merry, Tumour cell resistance to anthracyclines — A review. Cancer Chemotherapy and Pharmacology, 1985. 14(2): p. 96-103.
8. Robert, J., Pharmacokinetics and metabolism of anthracyclines. Cancer surveys, 1993.
17: p. 219-52.
9. Toffoli, G., et al., Dose-finding and Pharmacologic Study of Chronic Oral Idarubicin Therapy in Metastatic Breast Cancer Patients. Clinical Cancer Research, 2000. 6(6): p. 2279-2287.
10. Thomas, X. and E. Archimbaud, Mitoxantrone in the treatment of acute myelogenous leukemia: a review. Hematology and Cell Therapy, 1997. 39(4): p. 163-174.
11. Minotti, G., et al., Anthracyclines: Molecular Advances and Pharmacologic Developments in Antitumor Activity and Cardiotoxicity. Pharmacological Reviews, 2004. 56(2): p. 185-229.
12. Gewirtz, D., A critical evaluation of the mechanisms of action proposed for the antitumor effects of the anthracycline antibiotics adriamycin and daunorubicin. Biochemical Pharmacology, 1999. 57(7): p. 727-741.
13. Lal, S., et al., Pharmacogenetics of Target Genes Across Doxorubicin Disposition Pathway: A Review. Current Drug Metabolism, 2010. 11(1): p. 115-128.
37
15. Ross, W.E., Protein-associated DNA breaks in cells treated with adriamycin or ellipticine. Biochimica et biophysica acta, 1978. 519(1): p. 23-30.
16. Tewey, K.M., et al., Adriamycin-Induced DNA Damage Mediated by Mammalian DNA Topoisomerase II. Science, 1984. 226(4673): p. 466-468.
17. Wassermann, K., Effects of morpholinyl doxorubicins, doxorubicin, and actinomycin D on mammalian DNA topoisomerases I and II. Molecular pharmacology, 1990. 38(1): p. 38-45.
18. Perego, P., et al., Role of Apoptosis and Apoptosis-Related Genes in Cellular Response and Antitumor Efficacy of Anthracyclines. Current Medicinal Chemistry, 2001. 8(1): p. 31-37.
19. Bertheau, P., et al., Effect of mutated TP53 on response of advanced breast cancers to high-dose chemotherapy. Lancet, 2002. 360(9336): p. 852.
20. Szulawska, A., M. Gniazdowski, and M. Czyz, Sequence specificity of formaldehyde-mediated covalent binding of anthracycline derivatives to DNA. Biochemical Pharmacology, 2005. 69(1): p. 7-17.
21. Cutts, S.M., et al., Sequence Specificity of Adriamycin-DNA Adducts in Human Tumor Cells1. Molecular Cancer Therapeutics, 2003. 2(7): p. 661-670.
22. Kiyomiya, K.-I., The role of the proteasome in apoptosis induced by anthracycline anticancer agents. International journal of oncology, 2002. 20(6): p. 1205-9.
23. Torti, F.M., et al., Reduced Cardiotoxicity of Doxorubicin Delivered on a Weekly Schedule. Annals of Internal Medicine, 1983. 99(6): p. 745.
24. Weijl, N.I., F.J. Cleton, and S. Osanto, Free radicals and antioxidants in chemotherapyinduced toxicity. Cancer Treatment Reviews, 1997. 23(4): p. 209-240. 25. Wallace, K.B., Adriamycin-induced interference with cardiac mitochondrial calcium
homeostasis. Cardiovascular Toxicology, 2007. 7(2): p. 101-7.
26. Simůnek, T., Anthracycline-induced cardiotoxicity: overview of studies examining the roles of oxidative stress and free cellular iron. Pharmacological reports, 2009. 61(1): p. 154-71.
27. Löwenberg, B., et al., High-Dose Daunorubicin in Older Patients with Acute Myeloid Leukemia. New England Journal of Medicine, 2009. 361(13): p. 1235-1248.
28. Johnson_and_Johnson, J&J Annual Report, 2008, Johnson and Johnson.
29. Robert, J., Epirubicin: Clinical Pharmacology and Dose-Effect Relationship. Drugs, 1993.
38
30. Eiermann, W., et al., Dose-intensified epirubicin versus standard-dose epirubicin/cyclophosphamide followed by CMF in breast cancer patients with 10 or more positive lymph nodes: Results of a randomised trial (GABG-IV E-93) – The German Adjuvant Breast Cancer Group. European journal of cancer (Oxford, England : 1990), 2010. 46(1): p. 84-94.
31. Parsons, A.B., et al., Exploring the Mode-of-Action of Bioactive Compounds by Chemical-Genetic Profiling in Yeast. Cell, 2006. 126(3): p. 611-625.
32. Whitehurst, A.W., et al., Synthetic lethal screen identification of chemosensitizer loci in cancer cells. Nature, 2007. 446(7137): p. 815-819.
33. Watson, V.G., et al., Identification and Replication of Loci Involved in Camptothecin-Induced Cytotoxicity Using CEPH Pedigrees. PLoS ONE, 2011. 6(5): p. e17561.
34. Auman, J.T. and H.L. McLeod, Cancer Pharmacogenomics: DNA Genotyping and Gene Expression Profiling to Identify Molecular Determinants of Chemosensitivity. Drug Metabolism Reviews, 2008. 40(2): p. 303-315.
35. Simon, J.A., et al., Phenotypic Predictors of Response to Simvastatin Therapy Among African-Americans and Caucasians: The Cholesterol and Pharmacogenetics (CAP) Study. The American Journal of Cardiology, 2006. 97(6): p. 843-850.
36. Peters, E.J., et al., Pharmacogenomic characterization of US FDA-approved cytotoxic drugs. Pharmacogenomics, 2011. 12(10): p. 1407-1415.
37. Johnson, A.D., et al., SNAP: a web-based tool for identification and annotation of proxy SNPs using HapMap. Bioinformatics, 2008. 24(24): p. 2938-2939.
38. Brown, C., et al., A comparison of association methods for cytotoxicity mapping in pharmacogenomics. Frontiers in Genetics, 2011. 2.
39. Liu, P., et al., Identification of Somatic Mutations in Non-Small Cell Lung Carcinomas Using Whole-Exome Sequencing. Carcinogenesis, 2012.
40. Yu, K.-Y., et al., Cutting Edge: Mouse Pellino-2 Modulates IL-1 and Lipopolysaccharide Signaling. The Journal of Immunology, 2002. 169(8): p. 4075-4078.
41. Schauvliege, R., S. Janssens, and R. Beyaert, Pellino proteins are more than scaffold proteins in TLR/IL-1R signalling: A role as novel RING E3–ubiquitin-ligases. FEBS Letters, 2006. 580(19): p. 4697-4702.
42. Jensen, L.E. and A.S. Whitehead, Pellino2 activates the mitogen activated protein kinase pathway. FEBS Letters, 2003. 545(2–3): p. 199-202.
39
44. Montagut, C., et al., Activation of nuclear factor-κ B is linked to resistance to
neoadjuvant chemotherapy in breast cancer patients. Endocrine-Related Cancer, 2006.
13(2): p. 607-616.
45. Bednarski, B.K., et al., Active roles for inhibitory κB kinases α and β in nuclear factor-κB– mediated chemoresistance to doxorubicin. Molecular Cancer Therapeutics, 2008. 7(7): p. 1827-1835.
46. Bednarski, B.K., A.S. Baldwin, Jr., and H.J. Kim, Addressing Reported Pro-Apoptotic Functions of NF-κB: Targeted Inhibition of Canonical NF-κB Enhances the Apoptotic
Effects of Doxorubicin. PLoS ONE, 2009. 4(9): p. e6992.
47. Li, S., M. E, and B. Yu, Adriamycin induces myocardium apoptosis through activation of
nuclear factor κB in rat. Molecular Biology Reports, 2008. 35(4): p. 489-494.
48. Bignold, L.P., Embryonic reversions and lineage infidelities in tumour cells: genome-based models and role of genetic instability. International Journal of Experimental Pathology, 2005. 86(2): p. 67-79.
49. Pekarsky, Y., et al., FHIT: from gene discovery to cancer treatment and prevention. The Lancet Oncology, 2002. 3(12): p. 748-754.


![1 (4 Bromophenyl) 2 {5 [(3,5 dimethyl 1H pyrazol 1 yl)methyl] 4 phenyl 4H 1,2,4 triazol 3 ylsulfanyl}ethanone](data:image/gif;base64,R0lGODlhAQABAIAAAP///wAAACH5BAEAAAAALAAAAAABAAEAAAICRAEAOw==)