Exposure assessment of the radon in residential tap
water in Kastamonu
INTRODUCTION
Human beings are exposed to natural radiation constantly everywhere. The exposure of human body from natural radiation sources is external and internal. Internal exposures originate from the intake of naturally occurring radioactive materials (NORM) by inhalation and ingestion. The major contribution to this human exposure comes from Radon (222Rn). Radon and its short-lived decay products constitute about 53% of the total dose originating from natural sources (1). Radon is the heaviest, colorless, odorless and tasteless and only radioactive member of noble gas group with a half-life of 3.82 days. It belongs to the 238U decay series. Radon is present in soil, rocks, building materials and waters. Radon can get into the
and ingestion radon in drinking water. Radon and its daughter emit ionizing alpha and beta radiations that may cause cancers in human organs (2, 3).
Radon is soluble gas in the water, thus the radon gas generated of the decay of uranium in the rocks and soil underground can easily pass underground water sources. Radon is similar to carbon dioxide in a soda bottle that is dissolved and then released when soda bottle is opened. Some radon may be left in the water and also, soil, building materials and underground water are the main sources of radon gas emanation (4). Therefore, domestic water can make variable contributions to indoor radon level (5). Radon concentrations can be highly signi0icant for health risk especially at certain regions which drinking water comes from underground
A. Kurnaz
*and M. Atıf Çetiner
Department of Physics, Faculty of Arts and Sciences, Kastamonu University, 37100 Kastamonu, Turkey
ABSTRACT
Background: It is considered that if radon gas is inhaled and ingested, it is the primary health risks for lung and stomach cancers. This paper presents the measurement results of radon ac vity concentra ons both residen al tap water and dam water for Kastamonu city Centre-Turkey. Materials and Methods: The radon ac vity concentra ons of water samples collected from 60 tap waters at four loca ons and 12 dam water of study area were determined. Radon concentra ons were measured using the professional radon monitor AlphaGUARD PQ2000 PRO (Genitron Instruments).
Results: The mean value for all residen al tap water samples and dam water samples were ascertained as 0.050 Bq l-1 and 0.741 Bq l-1, respec vely. The annual effec ve doses were calculated for the inhala on of radon released to air when water is used and the inges on of drinking water. The mean values for inhala on and inges on were found to be 0.1266 μSv y-1 and 0.0105 μSv y-1, respec vely. For the radon exposure from inges on, the annual effec ve doses were calculated for infants, children, and adults, separately. Conclusion: When the results compared with the interna onally recommended safe limits, the tap waters of Kastamonu city Centre is safe for drinking purposes in terms of radon ac vity concentra ons.
Keywords: Radon exposure, tap water, effective dose, Kastamonu. Revised: Oct. 2015
Accepted: Nov. 2015 *Corresponding author: Dr. Asil Kurnaz,
Fax: + 90 366 215 49 69 E-mail:
akurnaz@kastamonu.edu.tr
Int. J. Radiat. Res., July 2016; 14(3): 245-250
► Short report
DOI: 10.18869/acadpub.ijrr.14.3.245
According to USEPA (2010), the primary health risks from radon in drinking water are lung cancer, from inhaling radon discharged from water used in the home, and stomach cancer, from ingesting radon in drinking water (6). When radon is inhaled or ingested, the alpha particles from its radioactive decay can interact with the biological tissues leading to DNA damage (7). Because of all these reasons, the evaluation studies of the radiation dose from radon ingestion and inhalation in drinking water are conducted continuously all over the World. All of these studies are improving the understanding of the environmental processes that effect radon exposure.
The aim of this study is to describe the 0indings from 222Rn activity concentrations of residential tap water samples for drinking purposes and to determine the annual effective dose due to waterborne radon in Kastamonu city Centre. Also, this region is the 1st degree earthquake zone (8). The results obtained from this study will contribute to a database of environmental radioactivity measurements and will be useful for assessing of safety of the drinking water.
MATERIALS
AND METHODS
Study area
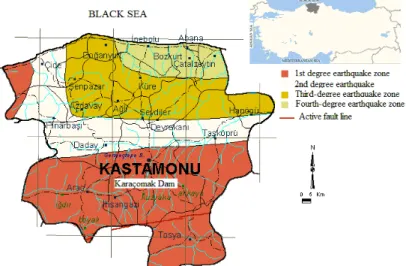
Kastamonu is a city on the western Black sea region of Turkey and this region is an
earthquake zone (0igure 1).
The province has a total area of 13,108 km2 and it is bordered by the provinces of Bartın, Karabük, Çankırı Çorum and Sinop. In accordance with statistics in Republic of Turkey, Kastamonu Governorship, the total area is 74.6% mountains and forests, 21.6% plateaus and 3.8% plains. The population of the city is about 368,000. The latitude and longitude of Kastamonu city are 41°21′ N and 33°46′ E, the altitude is 775 m above sea level. The mean annual rainfall is about 461, 6 mm for the area (9). In Kastamonu, the household water is supplied from Karacomak Dam which is 0illed by water from surroundings streams and rainwater.
Radon activity in water
The study area is divided into 4 regions namely as Kuzeykent, City Centre, Esentepe and Olukbaşı, respectively and 15 water samples were taken from each region. Total 60 residential tap water measurements have been performed in city Centre of Kastamonu province.
Sampling was done at random depending on who permitted us to carry out the study in his or her house. Water taps were opened for 5 minutes and water poured down the drain before sampling. Tap water samples were collected in 0.5 l linear polypropylene bottles and these bottles were completely 0illed slowly and immediately closed tightly under the water in order to avoid air bubbles. In addition, the
Figure 1. The loca on of sampling sites and earthquake map of Kastamonu (8).
radon activity concentrations in the 12 water samples collected from Karaçomak Dam which is household water supply were determined. All the water samples measurements were made in the Nuclear physics laboratory at Kastamonu University. Laboratory measurements were performed on the same day after drawing the samples. The results were recorded in units Bq m-3 and converted to Bq l-1. Whole water samples were collected during winterseason in 2014.
Radon concentrations of the water samples were measured using the professional radon monitor AlphaGUARD PQ2000 PRO which is a portable radon monitor with high storage capacity. This is an ionization chamber (0.62 l), designed for measuring radon in air, soil and water. AquaKIT, the additional equipment of AlphaGUARD, was used for the water measurements.
AlphaGUARD has ionization chamber whose was also a part of gas cycle. Radon was expelled from water samples (placed in emanation vessel) using the pump in a close gas cycle. The safety vessel was connected with the emanation vessel. All drops would deposit in it if they had got into the gas cycle during the degassing process. This way the stress of the water vapor was minimized for the radon monitor. After that the water was injected into the emanation vessel, and the AlphaGUARD and AlphaPUMP were switched on. The 0low rate of the pump was 0.3 l min-1. After 10 min the pump was switched off and the AlphaGUARD remained switched on for another 20 min, so the radon measurement was continued. The AlphaGUARD monitor worked in a ‘0low’ mode in a 1 minute. Before every water sample measurement, for a few minutes, the background of empty set-up was measured. Calibration of the measuring system has been carried out by Saphymo (Genitron Instruments, Germany), with a guaranteed stability and accuracy for 5 y. Brie0ly, this measuring system is portable, offers faster reading and accurate measurements. The following equation was used to determined radon concentrations in the water samples (10);
where Awater is radon concentration in water sample (Bqm-3), Aair is radon concentration in the set-up after expelling radon from water (Bqm-3), A0 is background (Bqm-3), Vsystem is interior volume of the measurement set-up (mL), Vsample is volume of the water sample (mL), and k is radon distribution coef0icient.
RESULTS
The radon activity concentrations in the residential tap water samples were analyzed for 60 samples in Kastamonu city Centre. In the study area, residential tap water is obtained from surface water. The results for 60 samples categorized into four locations. Table 1 reports the results for the mean radon activity concentrations in residential tap water samples collected from each region of the study area. In dam water the radon activity concentrations were found to range from 2.28±0.113 Bq l-1 to
0.034±0.007 Bq l-1, with a mean222Rn activity concentration of 0.741±0.046 Bq l-1.
As shown in table 1, the radon activity concentrations of the residential tap water samples were found to range from 0.025±0.006 Bq l-1to 0.128±0.025 Bq l-1, with a mean222Rn activity concentration of 0.050±0.003 Bq l-1.
As related with radiation dose which people
are exposed to, waterborne radon may be a
higher risk than all other contaminants in water (13). In tap water, radon may cause to exposures from the inhalation of radon released to air when the water is used and from the ingestion of drinking water. The annual effective dose equivalent AEDE (µSv y-1) for inhalation is calculated using equation 1:
AEDE (µSv y-1) = A(Bq l-1) × AWCx O × EF × DCF × 1000 (l/m3) (1)
where, A is the 222Rn activity concentration in water (Bq l-1), AWC is the is air water concentration ratio (10-4), O is indoor occupancy of 7,000 hours per year, EF is the equilibrium factor (0.4) between radon and its decay products and DCF is the is the dose conversion factor for radon exposure 9 (nSv/Bqm-3h) (14).
The annual effective dose equivalent AEDE (µSv y-1) for ingestion is calculated using equation 2:
AEDE (µSv y-1) = A (Bq l-1) × 60 (l/y) × 3.5 (nSv Bq-1) (2)
where 60 (l y-1) is weighted estimate of water
consumption and 3.5 (nSv Bq-1) is the effective dose coef0icient for ingestion (14).
According to UNSCEAR (2000) report, the ingestion of tap water was estimated in the UNSCEAR (1993) Report to be 100, 75, and 50 l y-1 by infants, children, and adults, respectively. Assuming the proportion of these groups in the population to be 0.05, 0.3, and 0.65, the weighted estimate of consumption was determined as 60 l y-1(14).
By using the information given above, the annual effective dose equivalent AEDE (µSv y-1) for inhalation, ingestion and total were calculated for the study area (table 1).
The annual effective dose equivalent values for 0irst, second, third and fourth regions varied from 0.0630 to 0.3226 μSv y-1, 0.0756 to 0.1739 μSv y-1, 0.0882 to 0.1814 μSv y-1 and 0.0882 to 0.1588 μSv y-1 for inhalation; 0.0053 to 0.0269 μSv y-1, 0.0063 to 0.0145 μSv y-1, 0.0074 to 0.0151 μSv y-1 and 0.0074 to 0.0132 μSv y-1 for ingestion, respectively. The mean values for 0irst, second, third and fourth regions were found to
be 0.1534, 0.1243, 0.1186 and 0.1100 μSv y-1 for inhalation and 0.0128, 0.0104, 0.0099 and 0.0092 μSv y-1 for ingestion, respectively (table 1). In addition, for the radon exposure from ingestion, the annual effective dose equivalents were calculated separately for infants, children, and adults (table 2).
DISCUSSION
The results (table 1) show that, for Kastamonu city Centre, the mean 222Rn activity concentration of the residential tap waters is relatively low. Also, both the measured radon activity concentrations in all the residential water samples and the mean value of all the
samples were below the internationally
recommended safe limit of 4-40 Bg l-1 (11), the
maximum contaminant level (MCL) (300 pCi l-1= 11.1 Bq l-1) of the US Environmental Protection
Agency (3) and the European Union
recommended level of 100 Bql-1(11), hence the
tap waters of Kastamonu city Centre safe for drinking purposes in terms of radon activity concentrations.
The results from this research indicate that the annual effective dose equivalents due to radon in drinking water are below the WHO Table 1. 222Rn ac vity concentra ons in the residen al tap water and the annual effec ve doses.
Table 2. The annual effec ve dose equivalent from inges on for infants, children, and adults. Region Sample
No
222
Rn Concentra ons (Bq l-1) Annual Effec ve Dose Equivalent (μSv y-1) min
(±uncertainty)
max (±uncertainty)
mean
(±SD) Inhala on Inges on Total
First 15 0.025±0.006 0.128 ±0.025 0.061±0.004 0.1534 0.0128 0.1662
Second 15 0.030±0.004 0.069±0.008 0.049±0.003 0.1243 0.0104 0.1347
Third 15 0.035±0.007 0.072±0.011 0.047±0.001 0.1186 0.0099 0.1285
Fourth 15 0.035±0.005 0.063±0.009 0.044±0.001 0.1100 0.0092 0.1192
Mean 0.050±0.003 0.1266 0.0105 0.1371
Region
Number of Samples
Annual Effec ve Dose Equivalent μSv y-1 (inges on)
infants children adults
min max mean min max mean min max mean
First 15 0.0088 0.0448 0.0213 0.0066 0.0336 0.0160 0.0044 0.0224 0.0107 Second 15 0.0105 0.0242 0.0173 0.0079 0.0181 0.0130 0.0053 0.0121 0.0086 Third 15 0.0123 0.0252 0.0165 0.0092 0.0189 0.0124 0.0061 0.0126 0.0082 Fourth 15 0.0123 0.0221 0.0153 0.0092 0.0165 0.0115 0.0061 0.0110 0.0076
mean 0.0176 0.0132 0.0088
recommended reference level of 0.1 mSv y-1 for water samples (15). Thus, the tap water can be used as drinking water without any radioactive contaminants. A comparison with the radon activity concentrations of tap waters from different studies conducted around the globe is given in table 3.
A comparison of the concentrations obtained in this research with other parts of world indicates that 222Rn activity concentration of the tap water samples is very low except Istanbul (24). The low radon concentrations in water of Kastamonu may be due to a number of factors, e.g. the geological structure, porosity of the soil, meteorological parameters, providing surface reservoirs, etc. On the other hand, the radon values in this study are lower than the action levels recommended by different monitoring agencies of the world, e.g. US EPA, UNSCEAR, EU. Therefore, radon poses comes from waterborne radon no threat to the lives of the people in this locality.
CONCLUSION
The 222Rn activity concentrations were determined by AlphaGuard PQ 2000 Pro in 60
different residential tap water and 12 dam water samples collected from Kastamonu province. The mean activity concentrations of 222Rn was found for all residential tap water samples and dam water samples. The mean annual effective dose equivalents were calculated. The results may be useful in assessment of exposures and 222Rn doses from tap water using drinking purposes. Also, the results obtained from this research is baseline which can be used to evaluate possible future changes and will be provide a good baseline for setting standards for water quality.
Con lict of interest: DeclaredNone
REFERENCES
1. Ojo TJ and Ajayi IR (2014) A Review on Environmental Radon and Its Poten al Health Risk on Humans. IOSR J Environ Sci Tox Food Techno, 8: 1-8.
2. Lee J and Kim G (2006) A simple and rapid method for analyzing radon in coastal and ground waters using a radon-in-air monitor. J Environ Radioact, 89: 219-228. 3. United States Environmental Protec on Agency (USEPA)
(1994) Report to the United States Congress on Radon in Drinking Water, Mul media Risk and Cost Assessment of Radon. United States Environmental Protec#on Agency, Table 3. 222Rn ac vity concentra ons in tap waters from different parts of world, compared with those of the present study.
Country Radon Ac vity (Bq l-1) References Jordan 2.5-4.7 Al-Bataina et al. (16) Venezuela 0-2 Horvath et al. (17) Brazil 0.39-0.47 Marques et al. (18)
Kenya 0.80–4.70 Otwoma and Mustapha (19) Algeria 0.26–2.28 Amrani and Cheroua (20) Cyprus 0.1–2.00 Sarrou and Pashalidis(21) Egypt 0.007-2.33 Abbady et al. (22) India 0.084-0.83 Kant et al. (23) Ci es of Turkey
İstanbul 0.019-0.048 Karahan et al. (24) Denizli 0.67-25.90 Ereeş et al. (25)
Afyonkarahisar 0.7-31.7 Yalım et al. (26) İzmir-Dikili 0.029-3.08 Yarar et al. (27)
Bursa 0.91-53.64 Tarım et al. (28) Amasya 0.28-2.4 Öner et al. (29)
Tokat 0.09-1.30 Yiğitoğlu et al. (30) Kütahya 0.1-48.6 Şahin et al. (31)
Konya 1.44-27.45 Erdoğan et al. (32) Zonguldak 0.32-88.22 Koray et al. (33)
Yalova 0.21-5.82 Tabar and Yakut (34) Kastamonu/Turkey 0.025-0.128 Present Study
Office of Water, 4601, EPA 811-R-94-001.
4. Pirsaheb M, Najafi F, Khosravi T, Hema L, (2013) A
Systema c Review of Radon Inves ga ons Related to
Public Exposure in Iran. Iranian Red Cres Med J, 15(11):
e10204.
5. Binesh A, Mohammadi S, Mowlavi AA, Parvaresh P (2010) Evalua on of the radia on dose from radon inges on and
inhala on in drinking water. Int J Water Res Environ Eng,
2: 174-178.
6. United States Environmental Protec on Agency (USEPA)
(2010) Risk Assessment of Radon in Drinking Water,Ini al
EPA Perspec ves on NAS Report: Risk Assessment of Radon in Drinking Water.
7. World Health Organiza#on (WHO) (2009) WHO handbook
on indoor radon a public health perspec ve, 1: 4.
8. MTA, General Directorate of Mineral Research and
Explora on (2012) Seismic zona on map. hSp://
www.mta.gov.tr/v2.0/deprem/index.php? id=dep_bol_harita.
9. Republic of Turkey Governorship of Kastamonu. hSp:// www.kastamonu.gov.tr/cografi-yapi.asp, 2014.
10. Correa JN, Paschuk SA, Schelin HR, Barbosa L, Sadula T,
Matsuzaki CA (2009) Measurements of radon
concentra on level in drinking water at urban area of Cri ba (Brazil). Interna onal Nuclear Atlan c Conference-INAC 2009, September 27 to October 2, Rio de Janeiro, Brazil, ISBN:978-85-99141-03-8.
11. United Na ons Scien fic CommiSee on the Effects of Atomic Radia on (UNSCEAR) (1993) 1993 Report to the General Assembly, with scien fic annexes. United Na ons sales publica on E.94.IX.2. United Na ons, New York.
12. European Union (EU) (2001) Commission
Recommenda on of 20 December 2001 on the Protec on of the Public Against Exposure to Radon in Drinking Water
Supplies. Official Journal of the European Communi#es, L
344: 85-88.
13. Vitz E (1991) Towards a standard method for determining
waterborne radon. Health Phys, 60: 817–829.
14. United Na ons Scien fic CommiSee on the Effects of Atomic Radia on (UNSCEAR) (2000) UNSCEAR 2000 Report to the General Assembly, with scien fic annexes, Vol. 1, Sources, Annex B, Exposures from natural radia on sources, United Na ons, New York.
15. World Health Organiza#on (WHO) (2011) Guidelines for
Drinking Water Quality, Recommenda ons, Fourth Edi on, Geneva, Switzerland.
16. Al-Bataina BA, Ismail AM, Kullab MK, Abmurad KM, Mustafa H (1997) Radon measurements in different types
of natural waters in Jordan. Radiat Meas, 28: 591–594.
17. Horvath A, Bohus LO, Urbani F, Marx G, Piroth A, Greaves ED (2000) Radon concentra ons in hot spring waters in
northern Venezuela. J Environ Radioact, 47: 127–133.
18. Marques AL, Santos W, Geraldo LP (2004) Direct measurements of radon ac vity in water from various
natural sources using nuclear track detectors. Appl Radiat
Isot, 60: 801–804.
19. Otwoma D, Mustapha AO (1998) Measurement of 222Rn
Concentra on in Kenyan Groundwater. Health Phys, 74:
91.
20. Amrani D and Cheroua DE (1999) Health effects from
radon-222 in drinking water in Algiers. J Radiol Prot, 19:
275.
21. Sarrou I and Pashalidis I (2003) Radon Levels in Cyprus. J
Environ Radioact, 68: 269.
22. Abbady A, Ahmed NK, Saied MH, El-Kamel AH, Ramadan S
(1995) Varia on of 222Rn concentra on in drinking water
in Qena. Bull Fac Sci, 24: 101–106.
23. Kant K, Upadhyay SB, Chakarvar SK (2005) Alpha ac vity
in Indian thermal springs. Iran J Radiat Res, 2 (4):197-204.
24. Karahan G, Öztürk N, Bayülken A (2000) Natural Radioac vity in Various Surface Waters in Istanbul, Turkey.
Wat Res, 34 (18): 4367-4370.
25. Erees FS, Aytas S, Sac MM, Yener G, Salk M (2007) Radon concentra ons in thermalwaters related to seismic events
along faults in the Denizli Basin,Western Turkey. Radiat
Meas, 42: 80- 86.
26. Yalım HA, Sandıkcıoğlu A, Unal R, Orhun O (2007) Measurements of radon concentra ons in wellwaters near
the Aksehir fault zone in Afyonkarahisar, Turkey. Radiat
Meas, 42: 505- 508.
27. Yarar Y, Günaydi T, Çelebi N (2006) Determina on of Radon Concentra ons of The Dikili Geothermal Area in
Western Turkey. Radiat Prot Dosim, 118 (1): 78-81.
28. Tarim UA, Gurler O, Akkaya G, Kilic N, Yalcin S, Kaynak G, Gundogdu O (2012) Evalua on of radon concentra on in well and tap waters in Bursa, Turkey. Radiat Prot Dosim, 150 (2): 207-212.
29. Öner F, Yalim HA, Akkurt A, Orbay M (2009) The Measurements of radon concentra ons in drinking water and The Yesilırmak river water in the area of Amasya in Turkey, Radiat Prot Dosim, 133(4): 223-226.
30. Yiğitoğlu I, Öner F, Yalim HA, Akkurt A, Okur A, Özkan A (2010) Radon concentra ons in water in the region of Tokat city in Turkey. Radiat Prot Dosim, 142 (2-4):358–362.
31. Şahin L, Çe nkaya H, Saç MM, Içhedef M (2013) Determina on of radon and radium concentra ons in
drinking water samples around the city of Kütahya. Radiat
Prot Dosim, 155 (4): 474–482.
32. Erdoğan M, Eren N, Demirel S, Zedef V (2013) Determina on of radon concentra on levels in well water
in Konya, Turkey. Radiat Prot Dosim, 156 (4): 489-494.
33. Koray A, Akkaya G, Kahraman A, Kaynak G (2014) Measurements of radon concentra ons in waters and soil
gas of Zonguldak, Turkey. Radiat Prot Dosim, 162 (3):375–
381.
34. Tabar E and Yakut H (2014) Radon measurements in water samples from the thermal springs of Yalova basin, Turkey.
J Radioanal Nucl Chem, 299: 311-319.