102
Multi-objective optimization of time-cost-quality-carbon dioxide
emission-plan robustness in construction projects
Nahid Farazmand
1, Mohammad Ali Beheshtinia
1*
1Industrial Engineering Department, Semnan University, Semnan, Iran [email protected] , [email protected]
Abstract
Today, the construction industry is facing intense competition and success in this competition depends on several factors. Project managers try to minimize project time and cost, carbon dioxide emission and at the same time maximizing the quality of project and its plan robustness. In this paper, study construction project scheduling considering a discrete trade-off between time, cost, quality, carbon dioxide emission and the plan robustness. After presenting the mathematical model of the problem, a genetic algorithm inspired from the role model concept in sociology named Reference Group Genetic Algorithm (RGGA) is used to solve the problem. The “reference group” concept is introduced by a sociologist named Robert K. Merton. He believed that some people in each society such as heroes or entertainment artists affect other people. To evaluate the impact of “reference group” concept in genetic algorithm, RRGA is compared with a similar genetic algorithm that do not use this concept. The originality of this paper is introducing a new multi-objective project scheduling problem, presenting its mathematical model and adapting RGGA to solve it. The computational experiments show that using this concept improves the result.
Keywords: Genetic algorithm, project scheduling, project quality, green project, plan robustness
1- Introduction
Time-cost trade-off is considered as one of the most important aspects of planning and controlling the construction projects and so far, several different techniques have been used to solve this problem (Mokhtari and Hasani, 2017).It should be noted that the time-cost trade-off problems can be divided into two categories: continuous time-cost trade-offproblems and discrete time-cost trade-off problems, which discrete time-cost trade-off problems are considered as NP-Hard problems (Liu et al., 1995). On the other hand, with the progress of the investigation and increase of the need to solve the problems in practice, researchers have focused on development of methods to solve the discrete time-cost trade-off problems (Tavana et al., 2014).
*Corresponding author
ISSN: 1735-8272, Copyright c 2018 JISE. All rights reserved
Journal of Industrial and Systems Engineering
Vol. 11, No. 3, pp.
102-
125103
In the present study, the desired problem is defined as discrete, anda meta-heuristic algorithm based on genetic algorithm is presented to solve the time-cost trade-off problem.It should be noted that, in recent years, in addition to time and cost, other factors were also important for project managers. For example, nowadays with the advent of new types of contracts, which led to increasing pressure to maximize the quality of the project, researchers have stated that, in addition to time and cost, they must also consider the quality of projects (Iranmanesh et al., 2008). In present study, along with the time and cost,qualityis evaluated as an objective function.On the other hand, in recent years, the construction industryhas been accused to create a wide range of environmental problems, such as high consumption of world resources and polluting the environment and greenhouse gas emission, among them, carbon dioxide is the most important gas produced in construction materials production process (Liu et al., 2013).In this study, to evaluate the environmental impacts of construction projects, inspired by the method presented in the paper (Liu et al., 2013), the amount of carbon dioxidehas been investigated in the construction industry. In present study, along with four objectives presented, the plan robustness is considered as the fifth objective function. The less critical activities and paths the schedule develops for the project, the higher the ability to interrupt the activities without causing delays in the completion of the project, and it should be noted that, being critical or non-critical activity is determined due to its slack. In present study, this criterion is used as the fifth objective function.
This paper studies construction project scheduling with minimizing cost, time and carbon dioxide emission and maximizing quality of project and its plan robustness. This universality does not appear in any of the previous researches in this area.
After presenting the mathematical model of the problem, a genetic algorithm named Reference Group Genetic Algorithm (RGGA) is used to solve the problem. RGGA is introduced by Beheshtinia et al. (2017) and uses the concept of reference groups in society. Robert K. Merton is a sociologist who presented the concept of reference groups in society. He believed that some people in each society such as heroes, entertainment artists, etc. affect other people as role models. RGGA employs this concept in the search procedure of genetic algorithm.
The paper continues as follows: In the second section, theoretical and practical background of studies in this field is presented. Research method and problem assumptions are given in section 3.The result of applying the research steps are mentioned in Section 4, and conclusions of the study are presented in section 5.
2- Literature review
In general, since 60s, the CPM algorithm is used for the planning and controlling the construction projects, and since then, various techniques have been developed to improve it.Among these algorithms and techniques, time – cost trade-off is considered as one of the most important techniques to improve the CPM to plan and control projects (Liu et al., 1995).
So far, many exact or estimated methodshave been developed for trade off problems with small size. In general, the methods for solving discrete cost-time problems are divided into three categories: 1. The exact algorithms, such as linear programming, integer programming, dynamic programming, branch and cut algorithms (Pollack-Johnson and Liberatore, 2006); 2. Heuristic algorithms (Vanhoucke and Debels, 2007); 3. Meta-heuristic algorithms (Ke, 2014).
In present study, the desired problem has been defined as discrete and Reference Group Genetic Algorithm has been used to solve it, which is one of the meta-heuristic algorithms. In recent years, researchers have stated that, in addition to time and cost, they must also consider the quality of projects (Iranmanesh et al., 2008). For instance, in recent years, government agencies, have adopted new innovative contracts which based on them incentives are considered to improve the quality of construction projects (Mungle et al., 2013). In present study, quality along with the time and cost is evaluated as an objective function.In most construction projects, key factors for success are determined based on factors such as time, cost and quality, and decision-makers rarely consider environmental issues in their projects (Liu et al., 2013).According to Acquaye and Duffy (2010), in 2005, in Ireland, 13.81 million tons CO2eq was produced in the construction sector, and this is equivalent to 11.7 percent of total Carbon dioxide
104
emissions in the country, including 2.37 million tones direct emissions on the project site (17%), 5.69 million tones indirect emissions resulting from the production of building materials in Ireland (41%) and 5.75 million Tons of indirect emissions has been resulting from the production of building materials in other countries. Environmental impact of buildings construction and energy consumption is very significant in the production process and transportation of building materials and the construction of buildings and as a result, greenhouse gas emissions (Yan et al., 2010). It should be noted that, although many studies have been conducted on calculating the amount of carbon dioxide emissions in the construction industry and its environmental impact, but still there is not an efficient and effective decision support system to help decision-makers to choose the optimal solution to deal with the environmental impact and reduce carbon emissions and in few researches, attention to environmental impacts has been taken into account along with factors such as the cost and duration of projects.This study uses research conducted by Liu et al. (2013), with the objectives of cost, time and quality and adds the carbon dioxide emissions of the construction processes and materials used in these processes. In addition to what was stated above, in the present study, in addition to four objective functions introduced, theplan robustness is also intended as a fifth objective function. Whatever the schedule developed for the project has fewer directions or critical activities, the ability to preemption and avoiding delays in the completion of the project will be higher, and it should be noted that, being critical or non-critical activity is determined due to its slack.Here, the weighted slack measure has been used to maximize robustness.To investigate the effect of project uncertainties on time and cost of activities Pathak and Srivastava (2014) proposed a new method based on the fuzzy logic and hybrid meta-heuristics (HMH). Input uncertainties considered being fuzzy and HMH were used to find Pareto front. Computational results show that the proposed method works efficiently for real world problems.
To recognize the most effective parameters for project scheduling Gálvez and Capuz-Rizo (2016) applied several global sensitivity analysis methods and found that the proper techniques were standardized regression coefficients, the Morris and Sobol'-Jansen. A multi-objective model was proposed by Mohammadipour and Sadjadi (2016) to minimize three objectives “total extra cost”, “total quality reduction” and “total risk increase” with time constraint. They used goal attainment technique to solve this mixed integer linear programming.
For scheduling repetitive projects Tran et al. (2017) introduced a novel method called “opposition multiple objective symbiotic organisms search” (OMOSOS) which used an opposition-based learning technique for generation jumping and population initialization. Moreover, to determine the project objectives containing time, quality, cost and interruption, they integrated a scheduling module. Oztemel and Selam (2017) proposed a Bee-based model to identify the minimum completion time for mold scheduling with multi-mode, single-resource and resource constraints. Tritschler et al. (2017) presented a Hybrid Metaheuristic (HM) for the resource-constrained project scheduling problem that has flexible resource profiles. To create feasible schedules, the HM used the Flexible Resource Profile Parallel Schedule Generation Scheme (FSGS) which utilized the concepts of non-greedy resource allocation and delayed scheduling. Wood (2017) proposed a model to optimize the total-project cost, duration and quality in Stochastic time-cost-quality tradeoff problem (STCQTP) with uncertainties by applying fuzzy analysis of quality item and a memetic algorithm including ten metaheuristics to combine the local and global duration-cost feasible solution space.
A multi-objective two-archive memetic algorithm was proposed by Shen et al. (2018) based on Q-learning (MOTAMAQ) for adjusting to changing environments of the dynamic software project scheduling. Main objectives were defined as employee’s satisfaction as well as project cost, robustness, stability, and duration. Their multi-objective dynamic software project scheduling problem model lacked the ability to extract all uncertainties, factors and dynamic events that could influence scheduling environments. In table 1, the history of research done to solve the trade-off problem is given. As seen in the table, some of the articles studied in this table, in addition to time and cost, have considered the quality of projects, as well, and meantime, only two papers have discussed reduction of the environmental impacts of construction projects in their modeling, and despite the fact that none of the investigated references have modeledthe quality of the project and the environmental effects of the implementation of
105
the project at the same time. In addition, the problem could be divided in two discrete and continuous problems.
The literature shows that no research considers the project scheduling problem with a trade-off between time, cost, quality,carbon dioxide emission and the plan robustness. Also, looking at table 1, the genetic algorithm is the most used algorithm to solve the problem, and this explains the popularity of the aforementioned algorithm for solving trade-off problems.In this study, also a new genetic algorithm is proposed to solve the mathematical model.
The innovations of this study can be stated as follows:
1) Study a new project scheduling problem with 5 different objective functions; 2) Presenting the mathematical model of the considered problems;
106
Table1. Review of related researches
Discrete problem
Continuous problem
Single Objective
Multi objective
With quality objective
With environmental
objective
Use of Genetic algorithm
Reference
* * * (Pollack-Johnson and
Liberatore, 2006)
* * (Nikoomaram et al., 2010)
* * (Klerides and
Hadjiconstantinou, 2010)
* * * (Zhang and Xing, 2010)
* * * * (Pour et al., 2010)
* * (Chen and Tsai, 2011)
* * (Kalhor et al., 2011)
* * (Mokhtari et al., 2011)
* * (Klanšek and Pšunder, 2012)
* * * (Sonmez and Bettemir,
2012)
* * * * (Xu et al., 2012)
* * (El-kholy, 2013)
* * * * (Mungle et al., 2013)
* * * (Nabipoor Afruzi et al.,
2013)
* * * (Liu et al., 2013)
* * * (Ke, 2014)
* * * (Pathak and Srivastava,
2014)
* * * * (Tavana et al., 2014)
* * * * (Monghasemi et al., 2015)
* * (Said and Haouari, 2015)
* * * (Pathak and Srivastava,
2014)
* * (Gálvez and Capuz-Rizo,
2016)
* * * (Mohammadipour and
Sadjadi, 2016)
* * * * (Tran et al., 2017)
* * (Oztemel and Selam, 2017)
* * * (Tritschler et al., 2017)
* * * * (Wood, 2017)
107
3- Research method
In this section after presenting the problem statement, the research steps are described.
3-1- Problem definition
Assuming the trade-off problem to be discrete, on one hand, because of the proximity to what is done in practice, and on the other hand, due to the ability to define the problem and communicate among the dimensions and different objectives, has attracted much attention in recent years; thus, at the present study, the problem is defined as discrete. Accordingly, each of the project activities can be done in different ways, each of these methods has different cost, time and carbon dioxide emission, quality and total slack, and the target is to find an optimal set of procedures that optimize all these indicators in project execution, and meantime, time and cost of the project must not be more than the upper limit considered, and the quality of implementation of project must not be less than the lower limit considered. The considered project includes n + 2 number of activities that are numbered from 0 to n + 1, which activities 0 and n + 1 are the dummy activities, respectively, indicate the beginning and end of the project. In addition, each project can be indicated with a network G = (V, E), where, V represents the nodes of project activities and E, indicates vectors, or the link between their activities (Assuming the network is indicated as an AON network). In addition, as mentioned before, any activity can be done in different methods as r(i)∈k, that each method k has different time (dik), cost (cik), quality (qik) and emission of carbon dioxide (eik).Assumptions and constraints taken into account in the study are listed below:
1. The problem is defined as discrete; 2. The problem is considered as definitive; 3. AON network of project activities is determined; 4. The activities have FS relationship; 5. Each activity begins after the end of all of its predecessors; 6. All activities of project can be crashed; 7. The objective functions considered in this study are: minimizing project duration, minimizing the cost of the project, maximizing project quality, minimizing dioxide emissions from the project and maximizing the plan robustness;
8. The project budget is limited; 9. Total time to implement the project has the upper limit; 10. For the quality of projects, the minimum amount is determined; 11. Activities are not allowed to preempt;
12. There are r (i) different methods to carry out any activity; 13. Choosing a method to carry out any activity, there is no possibility of changing the way to do it; 14. To carry out any activity, more than one source can be used; 15. For simplicity, the activity duration is intended as an integer; 16. Weight of the quality of all activities of the project - to calculate the total quality - is taken into accountequally;
17. Dioxide Carbon emissions, including direct emissions (due to electricity and diesel consumption of equipment during construction) and indirect emissions (from production and transportation of materials, consumable materials of the Project); 18. The quality of each procedure is selected a number between 1 and 5 based on expert judgment; 19. On how to perform an activity, the method with more time has less cost, but the quality may be lower or higher.
3-2-Research steps
In this research the following steps are used to solve the problem:
Step1: Presenting the mathematical model of the problem.
Step 2: Giving a developed version of genetic algorithm called Reference Group Genetic
Algorithm (RGGA) to solve the problem.
Step 3: Generating a set of test problems to evaluate the performance of RGGA.
Step 4: Comparing the obtained result by RGGA and a Classical Genetic Algorithm (CGA).
In the next section the obtained results by implementing the research steps are mentioned.
4-Results
108
4-1- Presenting the mathematical model
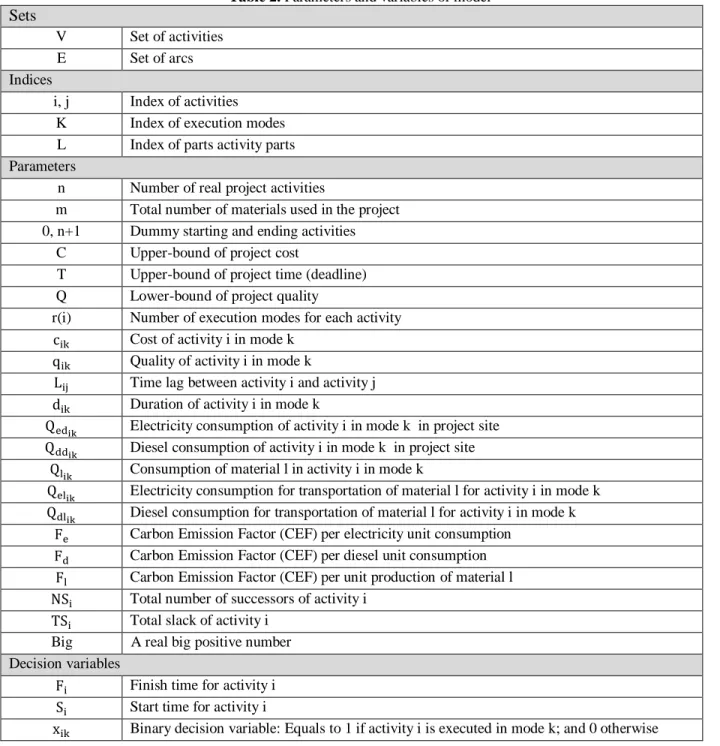
Before expressing the mathematical model, parameters and variables for the decision are presented as the following.
Table 2. Parameters and variables of model
Sets
V Set of activities E Set of arcs Indices
i, j Index of activities K Index of execution modes L Index of parts activity parts Parameters
n Number of real project activities
m Total number of materials used in the project 0, n+1 Dummy starting and ending activities
C Upper-bound of project cost
T Upper-bound of project time (deadline) Q Lower-bound of project quality
r(i) Number of execution modes for each activity cik Cost of activity i in mode k
qik Quality of activity i in mode k
Lij Time lag between activity i and activity j
dik Duration of activity i in mode k
Qedik Electricity consumption of activity i in mode k in project site
Qddik Diesel consumption of activity i in mode k in project site
Qlik Consumption of material l in activity i in mode k
Qelik Electricity consumption for transportation of material l for activity i in mode k
Qdlik Diesel consumption for transportation of material l for activity i in mode k
Fe Carbon Emission Factor (CEF) per electricity unit consumption
Fd Carbon Emission Factor (CEF) per diesel unit consumption
Fl Carbon Emission Factor (CEF) per unit production of material l
NSi Total number of successors of activity i
TSi Total slack of activity i
Big A real big positive number Decision variables
Fi Finish time for activity i
Si Start time for activity i
xik Binary decision variable: Equals to 1 if activity i is executed in mode k; and 0 otherwise
With regard to the assumptions and constraints taken into account, the model will be as follows:
109
Min Cost = ∑ ∑ x
ikc
ikr(i)
k=1 n
i=1
(2)
Max Quality = ∑ ∑ x
ikq
ikr(i)
k=1 n
i=1
(3)
Min CO
2Emission = ∑ ∑ x
ik(e
dik+ e
inik)
r(i)
k=1 n
i=1
(4)
Max Robustness = ∑ NS
i× TS
in
i=1
(5)
S.T.
∑ x
ik= 1
r(i)
k=1
(6)
∑ ∑ x
ikc
ik≤ C
r(i)
k=1 n
i=1
(7)
∑ ∑ x
ikq
ik≥ Q
r(i)
k=1 n
i=1
(8)
S
n+1≤ T
(9)F
i+ L
ij≤ S
j∀i, j| j is successor of i
(10)S
0, 𝐹
0= 0
(11)e
dik= Q
edik× F
e+ Q
ddik× F
d (12)e
inik= ∑(Q
lik× F
l+ Q
elik× F
e+ Q
dlik× F
d)
m
l=1
(13)
S
i+ d
ik≤ F
i+ 𝐵𝑖𝑔(1 + x
ik)
∀i, j
(14)TSi
≤ S
j− L
ij− F
i∀i, j| j is successor of i
(15)110
x
ik∈ {0,1} ∀i, k
In this model, formulas 1 to 5, respectively, represent the objective functions of time, cost, quality, and dioxide emissions and the increase of plan robustness.The constraint 6 ensures that any activity is done only in one way. The constraints 7, 8 and 9, respectively, indicate budget constraints, minimum quality anddeadline of the project.constraint 10 shows the relationship between the activities, and indicates that the project activities have FS relationship.Constraint 11 ensures that none of the activities of the project begin earlier than zero. Constraints 12 and 13 are used to calculate the direct and indirect dioxide each of activity methods.Constraint 14 links finish time and start time of each activity. Constraint 15 determines the total slack of each activity. Constraint 16 determines the type and sign of each variable.
Thus, as can be observed in the mathematical model, in this study, with a comprehensive view, the control of the important factors is discussed that should be considered by all project managers. This integrity can't be seen in any of the previous research in this area.It should be noted that, regardless of the quality of the project, can't enter the today's competition arena, and on the other hand, environmental problems and the contribution of construction projects in the creation of pollutants, has led project managers to pay more attention to environmental impacts of their projects in many developed countries, on the other hand, it should be noted that, without the development of robust and practical program, there will not be possible to accomplish the desired goals, and the project will not be prosperous; so, in this study, quality, the dioxide emission and also the robustness of plan is considered along with the time and cost of the project. In the next section, the solution for a modeled problem is presented. As mentioned above, the problem defined in this study is a multi-objective trade-off discrete problem and the decision variable in the model is way of doing activities.This problem is an NP-hard problem because increasing the number of different methods of activity, solution space of the problem, will increase exponentially.To solve such problems, the meta-heuristic algorithms are used.To solve the mathematical model defined, a new genetic algorithm is presented as RGGA. In which the role model theory in sociology on genetic algorithm has been implemented.More details about this algorithm are presented in the next section.
4-2- Reference Group Genetic Algorithm (RGGA)
Genetic algorithm already has been widely used in different fields, including optimization problems, scheduling, transportation, and artificial intelligence and so on. Looking at the trade-off problems defined in the field of control of construction projects, it can also be clearly seen that this algorithm is the most widely used algorithm (Nabipoor Afruzi et al., 2013).
4-2-1- Structure of algorithm
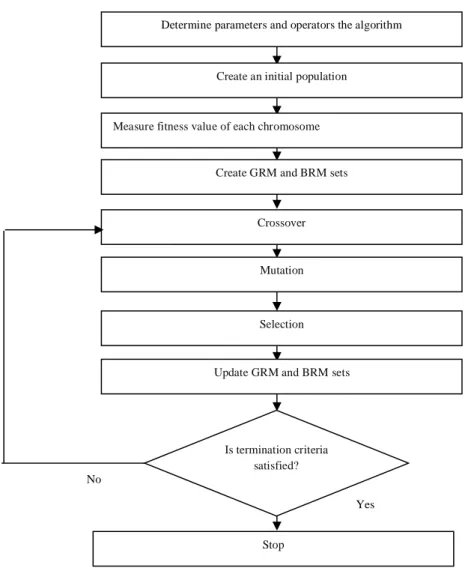
The proposed algorithm in the present study has a flowchart similar to that of the genetic algorithm, with the difference that, crossover and mutation operators in this algorithm are different from the normal genetic operators.In fact, the proposed algorithm is a genetic algorithm, which is improved inspired by the idea of an American sociologist, Robert King Merton. Merton believed that, individuals compare themselves with individual or group that has a position which they want or are interested in acquiring it (Holton, 2004).
A
n example of these imitations is the imitation of people (especially young people) from artists, athletes, etc. So, this concept has been used for designing crossover and mutation operators in the proposed algorithm.In this algorithm, a set of k chromosome that has the best objective function value is considered in a set, as a set of good role models (RM) of society, and a list of k chromosome with the worst objective function value is considered as a set of bad role models of society.Chromosomes in the community are trying to make themselves look like good RM, and they are trying to be different from the bad RM. In the following sections, operators of mutation and crossover of RGGA algorithm are explained.Before explaining the crossover and mutation operators, similarity and dissimilarity procedures of chromosomes are described.Flowchart of RGGA is shown in figure 1.111
Fig 1. RGGA flowchart
Moreover, it should be noted that the structure of the chromosomes to solve the mathematical model proposed is like strings that the number of their genes is equal to the number of project activities the value of gene is equal to a method to perform each activity.An example of chromosome is shown in Figure 2. In this chromosome, it is assumed that there is a project with 10 activities, and there are 6 ways to perform each activity.
3 5 4 1 6 2 2 5 3 1
Fig 2. Chromosome (10 activities and 6 methods per activity)
4-2-2- Crossover and mutation
Before expression crossover and mutation operators in the RGGA, two processes known as similarity and dissimilarity procedures are expressed.
4-2-3- Similarity procedure
Similarity procedure is a process that occurs between two chromosomes.During this process one of the chromosomes plays as a role model and the other one plays as a receptor role. And with the implementation of this process, some properties of model are transmitted to acceptor chromosome.In this
Create an initial population
Measure fitness value of each chromosome
Stop
Update GRM and BRM sets
Determine parameters and operators the algorithm
Is termination criteria satisfied?
Crossover
Mutation
Selection Create GRM and BRM sets
Yes No
112
process, a gene (The method of Activity) of receptor chromosome is randomly selected. If the amount allocated to the receptor gene is different from the amount allocated to such gene on role model chromosome, the amount of receptor chromosome gene changes into the amount of gene on pattern chromosome.However, if the gene value on receptor chromosome is equal to the amount of such gene on RM chromosome, no change will be needed. The influence of the receptor chromosome may be different from RM chromosome.For this regard, a random number between zero and one is chosen for every time implementation of the simulation process and it will multiply the number of genes in the chromosome. The integer part of the resulting number is the number of times the simulation process must be repeated between selected chromosomes.
4-2-4- Dissimilarity procedure
This process, like the similarity process, occurs between two chromosomes.During this process one of the chromosomes plays as a role model and the other one plays as a receptor. And with the implementation of this process, some properties of model are transmitted to acceptor effect chromosome. In this process, a gene (The method of Activity) of receptor chromosome is randomly selected. If the value of the selected gene on receptor chromosome is equal to the gene value on pattern chromosome, then the gene value on receptor chromosome randomly changes to another authorized amount, but if the selected chromosome is different from its unique gene on role model chromosome, any changes will be needed. The effectiveness of receptor chromosome of RM chromosome, according to the simulation method is determined by a random number between zero and one. In the proposed algorithm in present study, similarity and dissimilarity processes have been used for the design and integration of mutation operators. These two operators are explained below.
4.2.5. Mutation operator
In every society, bad and good RMs can always be found and people are always trying to access the features of good RMs, and get away from the characteristics of bad RMs. Accordingly, the mutation operator is performed in two phases in the algorithm RGGA. In the first phase, a chromosome is selected randomly from the population as receptor chromosome and one chromosome is randomly selected from good RM set as pattern chromosome, and then the similarity process is performed for them (Figure 3). The number of mutation operator repetition is one of the RGGA algorithmparameters that are shown as Mute rate.
4.2.6. Crossover operator
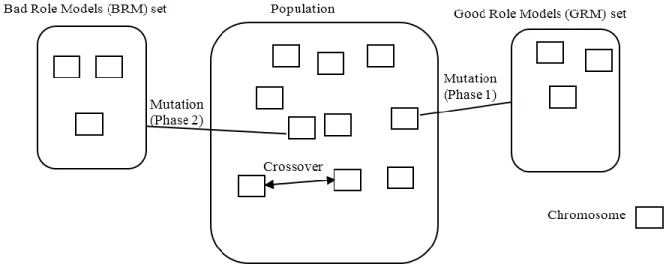
Apart from models, people in a community may affect each other. This concept is used in crossover operator design of RGGA algorithm. Thus, the two chromosomes from the population are selected randomly (the roulette wheel is used for this regard), and one of them as a template and another to be considered as receptor chromosome, and similarity and dissimilarity processes are done for them (Figure 3). In this study, only the similarity process is used for applying the crossover operator.The number of crossover operator repetition is one of the RGGA algorithm parameters, and is shown as Cross-rate.
113
Fig 3. Structure of RGGA
4-2-7- Fitness function
Evaluation of chromosomes in generations takes place with the help of fitness function. Chromosome competence is measured based on their performance in the realization of the objective functions, so the fitness function, should be defined in relation to the objective functions. In this study, for providing the fitness function, the method provided by the Zhang and Xing (2010) , is used. According to the presented method, the fitness function is defined as follows.
(16)
𝐹𝑖𝑡𝑛𝑒𝑠𝑠 = ∑ 𝑤
𝑜𝑢
𝑜𝐹 ∈ [0,1], 𝑢
𝑜∈ [0,1]
𝑂
𝑜=1
In this formula, O represents the number of objective functions, wo, the weight of objective function and uo represents the normalized objective function, where ∑𝑂𝑜=1𝑤𝑜 = 1.In this equation, the uo for each of the objective functions considered is calculated as follows:
𝑢
𝑇=
𝑇
+
− 𝑇
𝑇
+− 𝑇
− (17)𝑢
𝑐=
𝐶
+− 𝐶
𝐶
+− 𝐶
− (18)𝑢
𝐶𝑂2 𝐸𝑚𝑖𝑠𝑠𝑖𝑜𝑛=
𝐸
+− 𝐸
𝐸
+− 𝐸
− (19)𝑢
𝑄=
𝑄
+
− 𝑄
𝑄
+− 𝑄
− (20)𝑢
𝑅=
𝑅
+
− 𝑅
114
In the above equations,𝑇+,𝐶+,𝐸+, 𝑄+and 𝑅+, respectively, represents the maximum time, maximum cost, the maximum amount of dioxide emissions, maximum quality and maximum robustness of plan. And the values of 𝑇−, 𝐶−, 𝐸−, 𝑄−and 𝑅−, are minimum of the objective functions mentioned. If, however, the importance of each function to other functions is shown by assigning weights to each of the functions, the fitness function will be equal to the following formula:
𝐹𝑖𝑡𝑛𝑒𝑠𝑠 = 𝑤
𝑇𝑢
𝑇+ 𝑤
𝐶𝑢
𝐶+ 𝑤
𝐸𝑢
𝐸+ 𝑤
𝑄𝑢
𝑄+ 𝑤
𝑅𝑢
𝑅 (22)As observed in the mathematical model provided for this problem, in this model, 5 objective functions should be optimized simultaneously, and whereas, the scale of the functions is different, with the help of the equations above, the value of objective functions are normalized, and all numbers have changed to numbers in the range between 0 and 1.Thus, the fitness function is a maximize function and is as follows:
𝑀𝑎𝑥 𝑓𝑖𝑡𝑛𝑒𝑠𝑠 = 𝑊
1(1 − 𝐶𝑜𝑠𝑡
𝑛𝑜𝑟𝑚𝑎𝑙𝑖𝑧𝑒𝑑) + 𝑊
2(1 − 𝑑𝑢𝑟𝑎𝑡𝑖𝑜𝑛
𝑛𝑜𝑟𝑚𝑎𝑙𝑖𝑧𝑒𝑑)
+ 𝑊
3(1 − 𝐸𝑚𝑖𝑠𝑠𝑖𝑜𝑛
𝑛𝑜𝑟𝑚𝑎𝑙𝑖𝑧𝑒𝑑) + 𝑊
4𝑄𝑢𝑎𝑙𝑖𝑡𝑦
𝑛𝑜𝑟𝑚𝑎𝑙𝑖𝑧𝑒𝑑+ 𝑊
5𝑅𝑜𝑏𝑢𝑠𝑡𝑛𝑒𝑠𝑠
𝑛𝑜𝑟𝑚𝑎𝑙𝑖𝑧𝑒𝑑(23)
Thus, total time, total cost, total carbon dioxide emissions, total quality and plan robustness for each chromosome is calculated and the resulting numbers, with the help of 17, 18, 19, 20 and 21 are normalized, and are used in relation to fitness function. To get the maximum and minimum values for each objective function in each problem, and put them in equations from 17 to 21, minimum and maximum values have been calculated by taking the worst and the best method for each of the parameters of time, cost, and quality dioxide emissions, to calculate the maximum and minimum weighted slack values, at first 1000 chromosomes randomly are chosen, and maximum slack is calculated for them, and the maximum and minimum of the objective is extracted of the 1000 solutions, and after each iteration of the algorithm, if the value obtained is greater than maximum or less than the minimum, it will be replaced by the previous value.
4-2-8- Selection operator
Selection of some chromosomes for next generation is done based on elitism, and accordingly, a fraction of the population with the highest fitness function directly is transferred to the next generation (it is shown by best and is one of the genetic algorithm parameters). Other chromosomes are selected using a roulette wheel, and crossover and mutation operators are applied on them.
4-2-9- Stop criteria
If the best fitness function of chromosomes in several successive generations does not improve, the algorithm ends.The number of consecutive iterations is defined by a parameter called termination. After numerous implementations and experimentally, it was found that levels of 60% and 30%, respectively, for cross rate and mute rate in the proposed algorithm leads to achieve better results.Also, the population of each generation (Pop size) and the elitism (best), respectively, was determined 100 chromosomes and 10%.The termination criterion for large and medium problems, 20 and for small issues, 10 was detected. Also, the number of members of each group of good and bad models, 5 members was determined.In the next section, the algorithm RGGA is used to solve problems, and to validate the proposed algorithm, the results of its application are compared with results from classical genetic algorithm.
115
4-3- Generating test problems
To evaluate the performance of RGGA, 81 problems with different sizes are created and these problems have been solved using a Classical Genetic Algorithm (CGA) and RGGA, and the results were compared with each other using them. All operators and parameters in CGA and RGGA is similar, except that GGA conventional swap mutation operator.
The problem studied has various parameters such as the number of activities, methods of doing each activity and the cost of the project activities.In order to create a diverse range of issues for each of these parameters, the levels of low, medium and high are considered. For number of active parameter, the values of 10, 30 and 50 are considered. For parameter of the number of methods performed for each activity, three values of 2, 4 and 6 modes, are considered.On the other hand, for parameter of the duration of doing any activity, three different modes are defined. In the first case, times randomly are selected from interval [1, 10].In the second and third modes, respectively, they are selected from the time interval [10.40] and [40,100]. Similarly, for the costs of the activity, the three different ranges of [30,200], [300.2000] and [2000.7000] are used and the formula α* P is used for the parameter of upper limit for total time of implementation of the project.The P is obtained by the total processing time activities (in a way that has the most time for doing). 0.9 is also intended for α. Therefore, taking into account the different states for the number of project activities, the number of methods for doing activities, different intervals for the time of doing activities, as well as the cost of doing activities (3 * 3 * 3 * 3) 81 problems can be defined. For other parameters, only one mode has been considered. Value of direct emissions of carbon dioxide of activities is selected from the uniform distribution of 90,000 to 500,000 and the value of indirect carbon dioxide emissions is chosen from the Uniform distribution 200,000 to 700,000 (The expert judgment is used to determine these ranges). All coding using SQL Server 2012 T-SQL language is written in software, and with the help of a computer, Intel Core i7-4702MQ CPU @ 2.20 GHz is running.
4-4-Comparison of RGGA and CGA
In this section, the results of algorithms are examined. Comparisons have been carried out in six states. In the first case, all of the coefficients of 0.2 were considered. To create 5 other cases, one of the coefficients 0.4 and others 0.15 are considered.And 81 problems generated with the help of the 6 fitness functions, using classical genetic and RGGA algorithms have been solved, and the results are compared with each other.In the tables below, the average amount of competency, cost, time, quality, filtrating and CO2 emissions related to the ultimate solution of both algorithms is presented.Also, the number of times that RGGA had a greater solution than CGA (NBR), the number of times that both algorithms have presented the same solution (NER), and the number of times that RGGA was worse than CGA (NWR), is displayed. As shown in these tables, the results of the two algorithms, based on the number of project activities, and the number of procedures performed each activity have been partitioned to do a more accurate analysis of performance of the algorithms used.
116
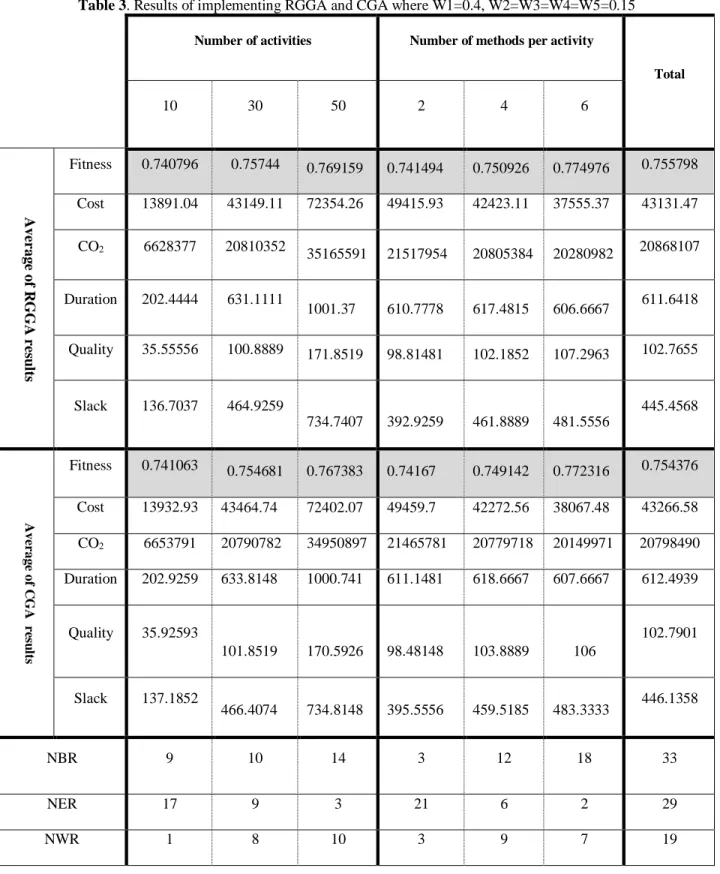
Table 3. Results of implementing RGGA and CGA where W1=0.4, W2=W3=W4=W5=0.15
Number of activities Number of methods per activity
Total
10 30 50 2 4 6
A
ve
r
ag
e
of
R
G
G
A
r
e
su
lts
Fitness 0.740796 0.75744 0.769159 0.741494 0.750926 0.774976 0.755798 Cost 13891.04 43149.11 72354.26 49415.93 42423.11 37555.37 43131.47
2
CO 6628377 20810352
35165591 21517954 20805384 20280982 20868107 Duration 202.4444 631.1111
1001.37 610.7778 617.4815 606.6667 611.6418 Quality 35.55556 100.8889 171.8519 98.81481 102.1852 107.2963 102.7655
Slack 136.7037 464.9259
734.7407 392.9259 461.8889 481.5556
445.4568
A
ve
rag
e
of
C
G
A
r
es
u
lt
s
Fitness 0.741063 0.754681 0.767383 0.74167 0.749142 0.772316 0.754376 Cost 13932.93 43464.74 72402.07 49459.7 42272.56 38067.48 43266.58
2
CO 6653791 20790782 34950897 21465781 20779718 20149971 20798490 Duration 202.9259 633.8148 1000.741 611.1481 618.6667 607.6667 612.4939
Quality 35.92593
101.8519 170.5926 98.48148 103.8889 106
102.7901
Slack 137.1852
466.4074 734.8148 395.5556 459.5185 483.3333 446.1358
NBR 9 10 14 3 12 18 33
NER 17 9 3 21 6 2 29
117
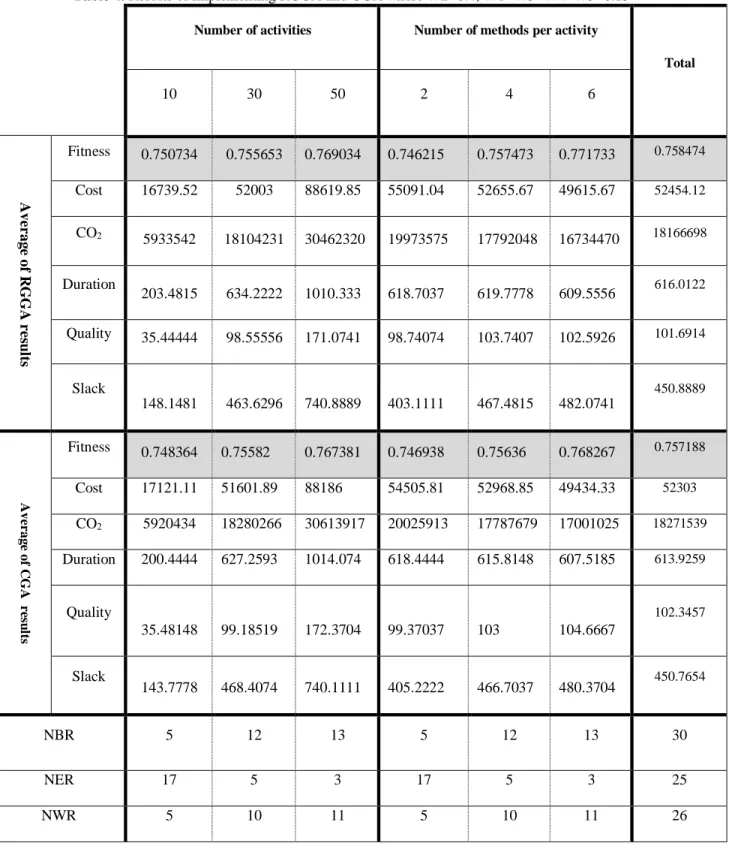
Table 4. Results of implementing RGGA and CGA where W2=0.4, W1=W3=W4=W5=0.15
Number of activities Number of methods per activity
Total
10 30 50 2 4 6
A
ve
r
ag
e
of
R
G
G
A
r
e
su
lts
Fitness 0.750734 0.755653 0.769034 0.746215 0.757473 0.771733 0.758474
Cost 16739.52 52003 88619.85 55091.04 52655.67 49615.67 52454.12
2
CO 5933542 18104231 30462320 19973575 17792048 16734470 18166698
Duration
203.4815 634.2222 1010.333 618.7037 619.7778 609.5556 616.0122 Quality 35.44444 98.55556 171.0741 98.74074 103.7407 102.5926 101.6914
Slack
148.1481 463.6296 740.8889 403.1111 467.4815 482.0741
450.8889
A
ve
rag
e
of
C
G
A
r
es
u
lt
s
Fitness 0.748364 0.75582 0.767381 0.746938 0.75636 0.768267 0.757188
Cost 17121.11 51601.89 88186 54505.81 52968.85 49434.33 52303
2
CO 5920434 18280266 30613917 20025913 17787679 17001025 18271539
Duration 200.4444 627.2593 1014.074 618.4444 615.8148 607.5185 613.9259
Quality
35.48148 99.18519 172.3704 99.37037 103 104.6667
102.3457
Slack
143.7778 468.4074 740.1111 405.2222 466.7037 480.3704 450.7654
NBR 5 12 13 5 12 13 30
NER 17 5 3 17 5 3 25
118
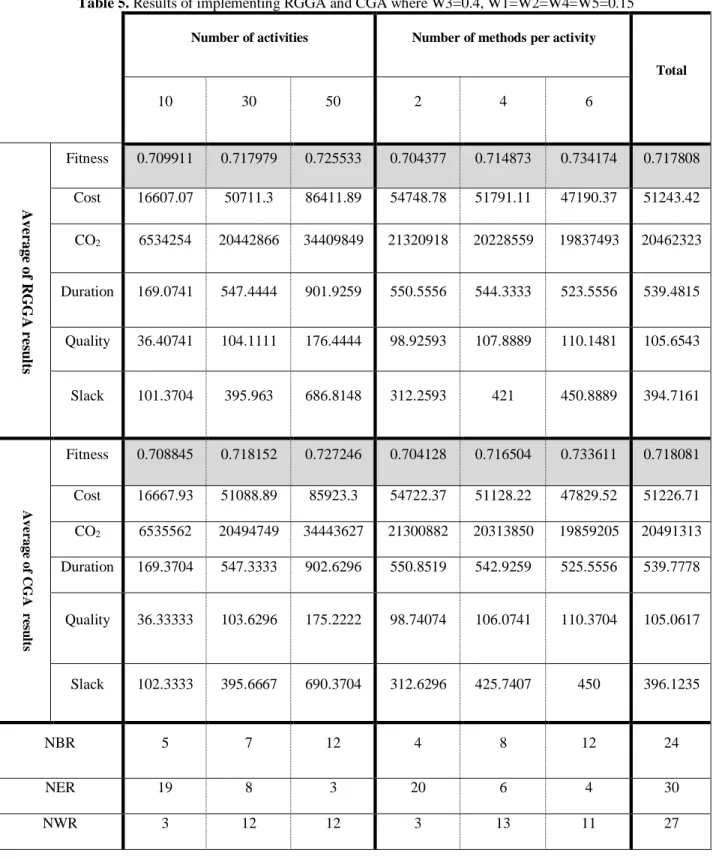
Table 5. Results of implementing RGGA and CGA where W3=0.4, W1=W2=W4=W5=0.15
Number of activities Number of methods per activity
Total
10 30 50 2 4 6
A
ve
r
ag
e
of
R
G
G
A
r
e
su
lts
Fitness 0.709911 0.717979 0.725533 0.704377 0.714873 0.734174 0.717808 Cost 16607.07 50711.3 86411.89 54748.78 51791.11 47190.37 51243.42
2
CO 6534254 20442866 34409849 21320918 20228559 19837493 20462323
Duration 169.0741 547.4444 901.9259 550.5556 544.3333 523.5556 539.4815
Quality 36.40741 104.1111 176.4444 98.92593 107.8889 110.1481 105.6543
Slack 101.3704 395.963 686.8148 312.2593 421 450.8889 394.7161
A
ve
rag
e
of
C
G
A
r
es
u
lt
s
Fitness 0.708845 0.718152 0.727246 0.704128 0.716504 0.733611 0.718081 Cost 16667.93 51088.89 85923.3 54722.37 51128.22 47829.52 51226.71
2
CO 6535562 20494749 34443627 21300882 20313850 19859205 20491313
Duration 169.3704 547.3333 902.6296 550.8519 542.9259 525.5556 539.7778
Quality 36.33333 103.6296 175.2222 98.74074 106.0741 110.3704 105.0617
Slack 102.3333 395.6667 690.3704 312.6296 425.7407 450 396.1235
NBR 5 7 12 4 8 12 24
NER 19 8 3 20 6 4 30
119
Table 6. Results of implementing RGGA and CGA where W4=0.4, W1=W2=W3=W5=0.15
Number of activities Number of methods per activity
Total
10 30 50 2 4 6
A
ve
ra
ge
o
f R
G
G
A
res
u
lts
Fitness 0.745977 0.765313 0.772826 0.743516 0.763026 0.777574 0.761372 Cost 17145.85 52515.78 87338.52 54203.7 53383.63 49412.81 52333.38
2
CO 6743144 20872627 35139158 21526980 20759908 20468041 20918310
Duration
201.5926 628.963 1018.481 622.7407 621.1111 605.1852 616.3455 Quality 42.03704 121.2593 204.5926 111.037 125.9259 130.9259 122.6296
Slack
133.6667 466.2963 738.7037 400.0741 465.4815 473.1111 446.2222
A
ve
rag
e
of
C
G
A
r
es
u
lt
s
Fitness 0.741373 0.764378 0.774767 0.744756 0.763158 0.772605 0.760173 Cost 17127.96 52264.07 87683.33 54489.04 53133.74 49452.59 52358.45
2
CO 6804751 20995015 35064641 21507432 20905051 20451923 20954802
Duration 202.8148 632.1111 1013.704 621.7037 617.5556 609.3704 616.21
Quality
42 122.037 205.1852 111.3704 127.1481 130.7037 123.0741
Slack
135.2222 464.1481 738.037 400.2222 461.1111 476.0741 445.8024
NBR 8 11 12 3 12 16 31
NER 18 7 4 20 6 3 29
120
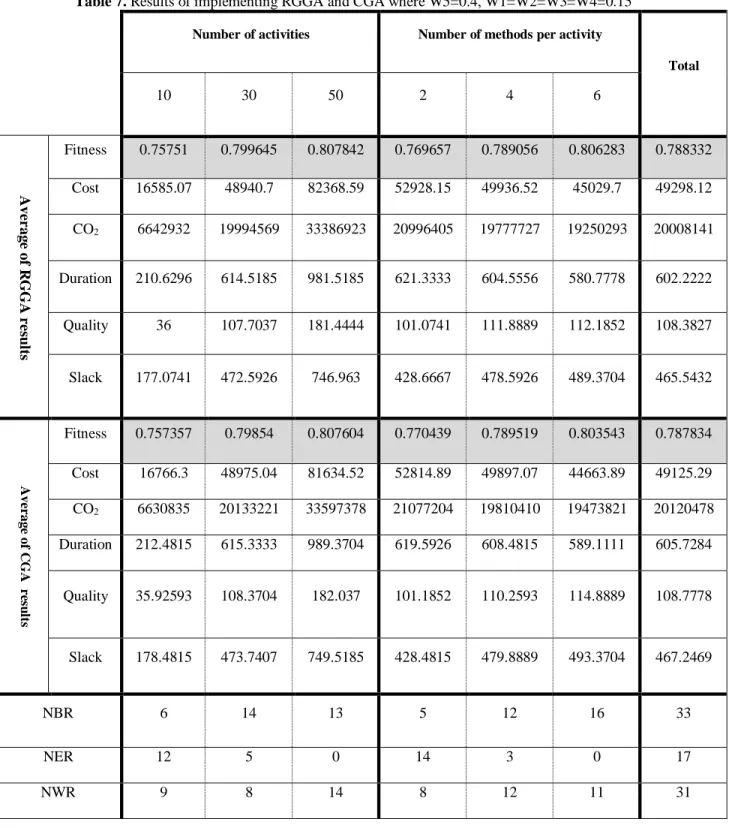
Table 7. Results of implementing RGGA and CGA where W5=0.4, W1=W2=W3=W4=0.15 Number of activities Number of methods per activity
Total
10 30 50 2 4 6
A
ve
r
ag
e
of
R
G
G
A
r
e
su
lts
Fitness 0.75751 0.799645 0.807842 0.769657 0.789056 0.806283 0.788332
Cost 16585.07 48940.7 82368.59 52928.15 49936.52 45029.7 49298.12
2
CO 6642932 19994569 33386923 20996405 19777727 19250293 20008141
Duration 210.6296 614.5185 981.5185 621.3333 604.5556 580.7778 602.2222
Quality 36 107.7037 181.4444 101.0741 111.8889 112.1852 108.3827
Slack 177.0741 472.5926 746.963 428.6667 478.5926 489.3704 465.5432
A
ve
rag
e
of
C
G
A
r
es
u
lt
s
Fitness 0.757357 0.79854 0.807604 0.770439 0.789519 0.803543 0.787834 Cost 16766.3 48975.04 81634.52 52814.89 49897.07 44663.89 49125.29
2
CO 6630835 20133221 33597378 21077204 19810410 19473821 20120478
Duration 212.4815 615.3333 989.3704 619.5926 608.4815 589.1111 605.7284
Quality 35.92593 108.3704 182.037 101.1852 110.2593 114.8889 108.7778
Slack 178.4815 473.7407 749.5185 428.4815 479.8889 493.3704 467.2469
NBR 6 14 13 5 12 16 33
NER 12 5 0 14 3 0 17
121
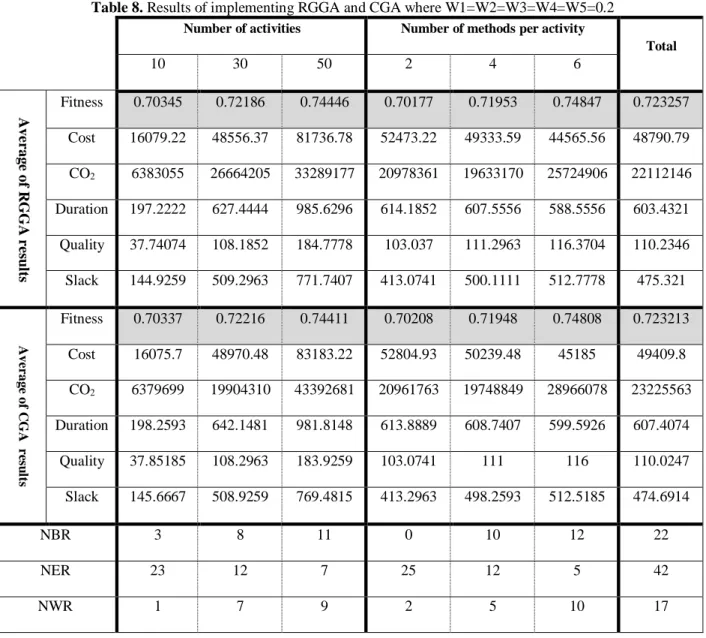
Table 8. Results of implementing RGGA and CGA where W1=W2=W3=W4=W5=0.2 Number of activities Number of methods per activity
Total
10 30 50 2 4 6
A
ve
r
ag
e
of
R
G
G
A
r
e
su
lts
Fitness 0.70345 0.72186 0.74446 0.70177 0.71953 0.74847 0.723257
Cost 16079.22 48556.37 81736.78 52473.22 49333.59 44565.56 48790.79 2
CO 6383055 26664205 33289177 20978361 19633170 25724906 22112146 Duration 197.2222 627.4444 985.6296 614.1852 607.5556 588.5556 603.4321 Quality 37.74074 108.1852 184.7778 103.037 111.2963 116.3704 110.2346 Slack 144.9259 509.2963 771.7407 413.0741 500.1111 512.7778 475.321
A
ve
rag
e
of
C
G
A
r
es
u
lt
s
Fitness 0.70337 0.72216 0.74411 0.70208 0.71948 0.74808 0.723213
Cost 16075.7 48970.48 83183.22 52804.93 50239.48 45185 49409.8
2
CO 6379699 19904310 43392681 20961763 19748849 28966078 23225563 Duration 198.2593 642.1481 981.8148 613.8889 608.7407 599.5926 607.4074
Quality 37.85185 108.2963 183.9259 103.0741 111 116 110.0247
Slack 145.6667 508.9259 769.4815 413.2963 498.2593 512.5185 474.6914
NBR 3 8 11 0 10 12 22
NER 23 12 7 25 12 5 42
NWR 1 7 9 2 5 10 17
As shown in tables 3 - 8, the solutions obtained by using the proposed algorithm for the big and small problems is better than medium. The NER indicator is declined by increasing the size of the problem. NBR and NWR indicators, by increasing the size of the problem has increased, and in most tables, with increasing the size of the problems, differences between NBR and NER has increased (NBR index is more in often partitions.). By analyzing all the results in Tables, it is concluded that in 35% of the problems, the solutions obtained are equal and in 36% of cases, the algorithm RGGA has achieved better solutions; however, meanwhile, the results obtained using the algorithm GA, in 29% of cases have been better. The average best solutions obtained for each 5 objective function average of 81 problems examined using two algorithms is given in the table.The results show that the algorithm proposed in this study, in total, compared to CGA had better performance.
5- Conclusion
In recent years, researchers have stated that, in addition to time and cost, the quality of projects must also be considered, and studies conducted on earlier studies indicate that the number of studies that examine the increase of the quality while reducing the time and cost of the project is increasing, in this study, in addition to time and cost, the quality is evaluated as an objective function.But it should be noted
122
that, decision-makers, as well as are unaware of or ignore the environmental impacts of their projects. But, in recent years, the construction industry has been charged to create a wide range of environmental problems, including excessive use of the world's resources, and polluting the environment, and the production of greenhouse gases, and in the meantime, carbon dioxide is the main gas generated in the production of building materials.Thus, according to the adverse effects of the project on environmental degradation, and given the need to reduce greenhouse gases and combat global warming, this research is focused on the production of carbon dioxide in the construction industry.Thus, in this study, in addition to the time, cost and quality, reducing carbon dioxide emissions from the project is also considered and is examined as a fourth function. The preemption in project implementation is inevitable (in practice).There are many factors that can lead to temporary preemption of the project. It should be noted that, lack of attention to the possibility of termination during implementation of a project can lead to a delay in its completion and tardiness. So, for development of an actual plan, the possible preemption in the early stages of planning must be addressed, and on the other hand, the greater slack of project activities is associated with the greater possibility of preemption (without affection on total project duration).Thus, in present study, in addition to four objective functions presented, as well as the robustness of plan is considered as fifth objective function. Whatever the schedule developed for the project has less directions or critical activities, the ability to preemption and avoid delays in the completion of the project will be higher, and it should be noted that, being critical or non-critical activity is determined due to its slack. Accordingly, a measure of the plan robustness developed is the weighted slack, which is the weighted sum of the total slack of all project activities; the weight considered in this manner for each activity is equal to the total number of all successors of the desired activity. So in present research, by studying published papers in the field of trade-off to control construction projects and other related issues, with a comprehensive view, the control of important factors that all project managers must consider them is discussed.To solve the problem defined in the study, a new approach, known as RGGA is presented. And to evaluate the performance of the proposed algorithm, 81 examples of problems, using classic genetic algorithm and proposed algorithm is solved and the results are compared with each other.Looking at the trade-off problems defined in the field of construction projects control, shows that genetic algorithm is the most widely used algorithms that have been used. The proposed algorithm in present study has a flowchart similar to the genetic algorithm flowchart, with the difference that, crossover and mutation operators in it are different from the normal genetic operators.In fact, the proposed algorithm is a genetic algorithm, which is improved inspired by the sociology theory of an American sociologist, Robert King Merton. By analyzing all the results for all 81 problems studied, the results show that the algorithm presented in this study, overall, compared to conventional genetic algorithm has better performance. In this study, on the one hand, a comprehensive model for solving trade-off problems is provided, and on the other hand, using a sociological theory, a new approach is presented to solving this problem.In this study, the problem conditions are considered as definitive, and on the other hand, only the value of weighted slack is intended as strengthening program developed.So, as field of research in the future, the following cases can be offered: Study of the problem in uncertain conditions, considering the possibility of preemption in the activities and prediction of more accurately the effect of preemption at different times, finding new algorithms to improve solutions for trade-off problems, comparing the two algorithms used in this study for other optimization problems.
References
Acquaye, A. A., &Duffy, A. P. (2010). Input–output analysis of Irish construction sector greenhouse gas emissions. Building and Environment, 45(3), 784-791.
Beheshtinia, M. A., ghasemi, a., &farokhnia, m. (2017). Supply chain scheduling and routing in multi-site manufacturing system (case study: a drug manufacturing company). Journal of Modelling in Management, just-accepted), 00-00.
123
Chen, S.-P., &Tsai, M.-J. (2011). Time–cost trade-off analysis of project networks in fuzzy environments.
European Journal of Operational Research, 212(2), 386-397.
El-kholy, A. M. (2013). Time–cost tradeoff analysis considering funding variability and time uncertainty.
Alexandria Engineering Journal, 52(1), 113-121.
Gálvez, E. D., &Capuz-Rizo, S. F. (2016). Assessment of global sensitivity analysis methods for project scheduling. Computers & Industrial Engineering, 93(110-120.
Holton, G. (2004). Robert K. Merton. Proceedings of the American Philosophical Society, 148(4), 505. Iranmanesh, H., Skandari, M., &Allahverdiloo, M. (2008). Finding Pareto optimal front for the multi-mode time, cost quality trade-off in project scheduling. World Academy of Science, Engineering and Technology, 40(346-350.
Kalhor, E., Khanzadi, M., Eshtehardian, E., &Afshar, A. (2011). Stochastic time–cost optimization using non-dominated archiving ant colony approach. Automation in Construction, 20(8), 1193-1203. Ke, H. (2014). A genetic algorithm-based optimizing approach for project time-cost trade-off with uncertain measure. Journal of Uncertainty Analysis and Applications, 2(1), 8.
Klanšek, U., &Pšunder, M. (2012). MINLP optimization model for the nonlinear discrete time–cost trade-off problem. Advances in Engineering Software, 48(6-16.
Klerides, E., &Hadjiconstantinou, E. (2010). A decomposition-based stochastic programming approach for the project scheduling problem under time/cost trade-off settings and uncertain durations. Computers & Operations Research, 37(12), 2131-2140.
Liu, L., Burns, S. A., &Feng, C.-W. (1995). Construction time-cost trade-off analysis using LP/IP hybrid method. Journal of construction engineering and management, 121(4), 446-454.
Liu, S., Tao, R., &Tam, C. M. (2013). Optimizing cost and CO2 emission for construction projects using particle swarm optimization. Habitat International, 37(155-162.
Mohammadipour, F., &Sadjadi, S. J. (2016). Project cost–quality–risk tradeoff analysis in a time-constrained problem. Computers & Industrial Engineering, 95(111-121.
Mokhtari, H., &Hasani, A. (2017). An energy-efficient multi-objective optimization for flexible job-shop scheduling problem. Computers & Chemical Engineering, 104(339-352.
Mokhtari, H., Kazemzadeh, R. B., &Salmasnia, A. (2011). Time-cost tradeoff analysis in project management: An ant system approach. IEEE Transactions on engineering management, 58(1), 36-43. Monghasemi, S., Nikoo, M. R., Fasaee, M. A. K., &Adamowski, J. (2015). A novel multi criteria decision making model for optimizing time–cost–quality trade-off problems in construction projects.
Expert systems with applications, 42(6), 3089-3104.
Mungle, S., Benyoucef, L., Son, Y.-J., &Tiwari, M. (2013). A fuzzy clustering-based genetic algorithm approach for time–cost–quality trade-off problems: A case study of highway construction project.
124
Nabipoor Afruzi, E., Roghanian, E., Najafi, A. A., &Mazinani, M. (2013). A multi-mode resource-constrained discrete time–cost tradeoff problem solving using an adjusted fuzzy dominance genetic algorithm. Scientia Iranica, 20(3), 931-944.
Nikoomaram, H., Lotfi, F. H., Jassbi, J., &Shahriari, M. R. (2010). A new mathematical model for time cost trade-off problem with budget limitation based on time value of money. Applied Mathematical Sciences, 4(63), 3107-3119.
Oztemel, E., &Selam, A. A. (2017). Bees Algorithm for multi-mode, resource-constrained project scheduling in molding industry. Computers & Industrial Engineering, 112(187-196.
Pathak, B. K., &Srivastava, S. (2014). Integrated Fuzzy–HMH for project uncertainties in time–cost tradeoff problem. Applied Soft Computing, 21(320-329.
Pollack-Johnson, B., &Liberatore, M. J. (2006). Incorporating quality considerations into project time/cost tradeoff analysis and decision making. IEEE Transactions on Engineering Management, 53(4),
534-542.
Pour, N. S., Modarres, M., Aryanejad, M., &Moghadam, R. T. (2010). The discrete time-cost-quality trade-off problem using a novel hybrid genetic algorithm. Applied Mathematical Sciences, 4(42), 2081-2094.
Said, S. S., &Haouari, M. (2015). A hybrid simulation-optimization approach for the robust Discrete Time/Cost Trade-off Problem. Applied Mathematics and Computation, 259(628-636.
Shen, X.-N., Minku, L. L., Marturi, N., Guo, Y.-N., &Han, Y. (2018). A Q-learning-based memetic algorithm for multi-objective dynamic software project scheduling. Information Sciences, 428(1-29. Sonmez, R., &Bettemir, Ö. H. (2012). A hybrid genetic algorithm for the discrete time–cost trade-off problem. Expert Systems with Applications, 39(13), 11428-11434.
Tavana, M., Abtahi, A.-R., &Khalili-Damghani, K. (2014). A new multi-objective multi-mode model for solving preemptive time–cost–quality trade-off project scheduling problems. Expert Systems with Applications, 41(4), 1830-1846.
Tran, D.-H., Luong, D.-L., Duong, M.-T., Le, T.-N., &Pham, A.-D. (2017). Opposition Multiple Objective Symbiotic Organisms Search (OMOSOS) for Time, Cost, Quality and Work Continuity Tradeoff in Repetitive Projects. Journal of Computational Design and Engineering.
Tritschler, M., Naber, A., &Kolisch, R. (2017). A hybrid metaheuristic for resource-constrained project scheduling with flexible resource profiles. European Journal of Operational Research, 262(1), 262-273. Vanhoucke, M., &Debels, D. (2007). The discrete time/cost trade-off problem: extensions and heuristic procedures. Journal of Scheduling, 10(4-5), 311-326.
Wood, D. A. (2017). Gas and oil project time-cost-quality tradeoff: Integrated stochastic and fuzzy multi-objective optimization applying a memetic, nondominated, sorting algorithm. Journal of Natural Gas Science and Engineering, 45(143-164.
Xu, J., Zheng, H., Zeng, Z., Wu, S., &Shen, M. (2012). Discrete time–cost–environment trade-off problem for large-scale construction systems with multiple modes under fuzzy uncertainty and its
125
application to Jinping-II Hydroelectric Project. International Journal of Project Management, 30(8), 950-966.
Yan, H., Shen, Q., Fan, L. C. H., Wang, Y., &Zhang, L. (2010). Greenhouse gas emissions in building construction: A case study of One Peking in Hong Kong. Building and Environment, 45(4), 949-955. Zhang, H., &Xing, F. (2010). Fuzzy-multi-objective particle swarm optimization for time–cost–quality tradeoff in construction. Automation in Construction, 19(8), 1067-1075.