Sharif University of Technology
Scientia IranicaTransactions E: Industrial Engineering http://scientiairanica.sharif.edu
Immune-based evolutionary algorithm for determining
the optimal sequence of multiple disinfection operations
Y.-C. Hsieh
a, P.-J. Lee
b, and P.-S. You
c;a. Department of Industrial Management, National Formosa University, Huwei, Yunlin 632, Taiwan. b. Department of Information Management, National Chung Cheng University, Chia-Yi 621, Taiwan. c. Department of Business Administration, National ChiaYi University, Chia-Yi 600, Taiwan. Received 19 October 2016; received in revised form 16 December 2017; accepted 16 April 2018
KEYWORDS Disinfection operation;
Immune algorithm; Optimization.
Abstract.This paper presents a new Multiple Disinfection Operation Problem (MDOP) according to which several buildings have to be sprayed with various disinfectants. The MDOP seeks to minimize the total cost of disinfection operations for all buildings. The problem is dierent from the typical vehicle routing problem since (a) each building has to receive multiple spray applications of disinfectants; (b) the nal spray application of disinfectant in each building is xed; (c) for safety, the time interval between two consecutive spray applications of disinfectants for each building must meet or exceed a specied minimum. The MDOP problem is NP-hard and dicult to solve directly. In this paper, rst, an ecient encoding of spray operations is developed to simultaneously determine the optimal sequence of buildings and their respective treatments with spray disinfectants. Second, immune algorithm is adopted to solve the presented MDOP. Finally, as a demonstration of our method, the problem for a campus case is solved to determine the optimal disinfection strategy and routes, assuming both single and multiple vehicle scenarios. Numerical results of immune algorithm are discussed and compared with those of genetic algorithm and PSO to show the eectiveness of the adopted algorithm.
© 2019 Sharif University of Technology. All rights reserved.
1. Introduction
Taiwan is located in a subtropical zone with a long hot and humid season; thus, preventing pests (e.g., ies, eas, cockroaches, ants, mosquitoes, mice, gnats, etc.) from infesting buildings is an important environmental sanitation and disinfection issue. There are four main disinfection methods for buildings:
1. Spray method: Using high-pressure approach to spray liquid disinfectants on the area or path of pests;
*. Corresponding author. Fax: + 886-5-2732934 E-mail address: [email protected] (P.-S. You) doi: 10.24200/sci.2018.20324
2. Fumigation method: Heating the disinfectants to generate smoke in the area or path of pests;
3. Enticement method: Putting baits in the area or path of pests;
4. Decomposition method: Tossing disinfectants for decomposition in the area or path of pests.
For simplicity, throughout this paper, the term \spray" is used to represent all of the above disinfection methods.
In this paper, the new Multiple Disinfection Operation Problem (MDOP) is investigated, in which we assume that: (a) Each building has to receive multiple sprays of disinfectants in a specic sequence to be eective in preventing infestation by various insects and bacteria; (b) The nal disinfectant of spray in some buildings is xed; (c) For safety, the minimum time
interval between two consecutive sprays of disinfectants for each building must be met. The MDOP seeks to minimize the total cost of disinfection operations for all buildings, where the total cost consists of the routing cost of vehicles and both the working and idle costs of workers. Note that:
1. The MDOP generalizes the typical Traveling Sales-man Problem (TSP). In a TSP, one has to visit every node of a network once with the objective of minimizing the total travel time [1-3]. Hence, the considered MDOP generalizes the typical TSP if there is only one disinfection operation required for each building, and only the nish time of the disinfection operation for all buildings is considered in the objective;
2. The MDOP generalizes the typical Vehicle Routing Problem (VRP).
In a VRP, one has to deliver products once to some specied nodes of a network using multiple vehicles with the aim of minimizing the total vehicle routing time [4-6]. Hence, the considered MDOP generalizes the typical VRP if the buildings of the MDOP have to receive only one application of disinfectant spray, and only the total nish time of the disinfection operation is considered;
3. The MDOP generalizes the typical Periodic Vehicle Routing Problem (PVRP).
In a PVRP, one has to deliver products pe-riodically to some specied nodes for many times with multiple vehicles with the aim of minimizing the total vehicle routing time [7-9]. Hence, the considered MDOP generalizes the typical PVRP if:
(i) The time interval between two consecutive sprays of disinfectants for each building is set to zero;
(ii) There is no nal spray of disinfectants for any building;
(iii) Only the total completion time of the disinfec-tion operadisinfec-tion for all buildings is considered.
4. The MDOP diers from the typical PVRP with Time Windows (PVRP-TW). In a PVRP-TW, the vehicle has to deliver a product periodically to the specied nodes within the given time windows [10-12]. However, in the considered MDOP, one has to spray various disinfectants for buildings, and the time interval between two consecutive spray applications of disinfectants for each building must meet or exceed a specied minimum rather than time windows. Additionally, nal spray application of the disinfectant in each building is xed for the MDOP;
5. The MDOP diers from the typical hole-making problem in manufacturing. In a hole-making prob-lem, a hole requires various tools to drill, and
each tool is used to drill for some of holes [13-16]. Moreover, the sequence of tools used for a hole is xed; however, no constraint on the time interval of using tools for a hole is considered. In the considered MDOP, the time interval between two consecutive spray applications of disinfectants for each building must meet or exceed a specied minimum, and there is no priority for the spray application of disinfectant except for the nal spray.
Since the newly presented MDOP generalizes TSP, VRP, and PVRP, it is more dicult to handle than these three specic routing problems. TSP, VRP, and PVRP are all NP-hard problems [17]; hence, the considered MDOP is also NP-hard. Note that, for the MDOP, one has to determine the sequence of disinfection operations and disinfectants for the build-ings with the following constraints: (i) each building's nal disinfectant should be used last for that building; (ii) the time interval between two consecutive spray applications of disinfectants for a given building must meet or exceed a given time minimum; (iii) the total cost (including routing, working, and idle costs) is minimized.
The purposes of this paper are manifold:
1. A new MDOP is presented, and an ecient spray operations encoding is also presented to simultane-ously determine both the sequence of buildings and the order of spray disinfectants for each building;
2. An ecient spray operations encoding is proposed and embedded in Immune Algorithm (IA) to solve the considered MDOP;
3. A campus case is solved for the optimal disinfection strategy assuming both single and multiple vehicle routes. Numerical results of IA are reported and compared with those of Genetic Algorithm (GA) and Particle Swarm Optimization (PSO) to show the eectiveness of the adopted IA.
This paper is organized as follows. In Section 2, related notations and assumptions of the MDOP are presented. Section 3 presents the new ecient spray operations encoding to simultaneously determine both the sequence of buildings to spray and the order of spray operations for each building. Two simple exam-ples are illustrated in this section. In Section 4, the main steps of the three adopted heuristic algorithms (IA, GA, and PSO) are described. Section 5 shows and discusses the numerical results of a campus case study. Finally, conclusions and future research are summarized in Section 6.
2. The new Multiple Disinfection Operations Problem (MDOP)
Next, the notations and assumptions for the MDOP are presented.
2.1. Notations
I Number of buildings requiring multiple disinfection operations;
i Index for buildings, i = 0; 1; 2; :::; I, where i = 0 denotes the depot; J Number of types of disinfectants; j Index for the types of disinfectants,
j = 1; 2; :::; J;
ni Number of types of disinfectant used
for building i, ni 1, i = 1; 2; :::; I;
N = n1+ n2+ ::: + nI is the total
number of disinfection operations for all buildings;
tij Spray time of disinfectant j in building
i;
qij Required quantity of disinfectant j for
building i;
dii0 Traveling time from building i to
building i0, i 6= i0, i, i0= 0; 1; 2; :::; I;
Q Disinfectant carrying capacity of each vehicle;
w Number of workers in a vehicle; L Minimum time interval between two
consecutive sprays of disinfectants for the same building;
Unit cost of traveling a unit distance (meter) for a vehicle;
Cost of hiring a worker for an hour; Penalty parameter of idle time for a
worker. 2.2. Assumptions
1. There are I buildings requiring multiple spray applications of disinfectants, and there are J types of disinfectants used to spray;
2. Assume that building i requires ni disinfection
operations with disinfectants of types ji;1; ji;2; :::; ji;ni 2 J, i = 1; 2; :::; I, and the
spray time of disinfectant type ji;k is tik,
k = 1; 2; :::; ni. N = n1+ n2+ ::: + nI is the total
number of disinfectant treatments for all buildings;
3. The types and quantities of disinfectants for each building are given in advance, and the quantity of disinfectants for a building is proportional to its area. Assume that qij is the required quantity of
disinfectant j for building i, and dii0 is the travel
time from building i to building i0, i 6= i0, i, i0; 2
f1; 2; :::; Ig;
4. For some buildings, a designated nal disinfectant must be used in the nal spray application;
5. For safety, the time interval between two consecu-tive sprays of disinfectants for each building has to meet or exceed a given minimum period of time L;
6. There are multiple identical vehicles available to carry disinfectants and workers, and each vehicle's capacity for disinfectants, Q, is limited. Each vehicle carries various disinfectants to buildings to spray and returns back to the depot to rell when the disinfectants are of insucient quantity for the next spray operation;
7. Each vehicle can carry w workers, where w 1, and work eciency is identical for all workers. The cost of an hour of labor is ;
8. Two policies of workplace are considered here:
- Policy 1: Worker(s) can be idle (i.e., wait) in front of a building as required until the constraint of maintaining a minimum time interval between two consecutive disinfectant sprays is satised;
- Policy 2: Worker(s) cannot be idle (i.e., no wait) in front of a building if the constraint of maintaining a minimum time interval between two consecutive sprays of disinfectants is not satised. For Policy 2, the penalty of idle time of workers is added to the objective function. Moreover, we assume that the total idle cost = total idle time (hr) of workers, where is the
penalty parameter.
9. The objective of the MDOP is to minimize the total cost of the disinfection operation, including: (i) the total routing cost of vehicles, (ii) the total working cost of workers, and (iii) the total idle cost of workers. Note that:
Total routing cost = the total routing length,
where = the unit cost of one unit of length (m) for a vehicle;
Total working cost = w total working time
(hr) = wftotal routing time + total idle time
+ total working timeg, where total routing time = total routing length (m)0.002. Of note, we
assume 0.002 (hr/m) for each vehicle;
Total idle cost = total idle time (hr) of
workers, where is the penalty parameter of one hour for each worker.
2.3. An example
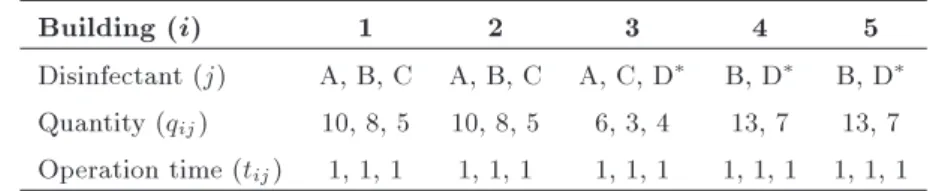
Consider an MDOP example with ve buildings and four disinfectants, i.e., I = 5 and J = 4. The corresponding required disinfectants and quantities for each building are shown in Table 1. For example, Building 3 requires three disinfectants, namely, A, C, and D, where D is the nal disinfectant used in the
Table 1. The corresponding disinfection data of the ve buildings in the example.
Building (i) 1 2 3 4 5
Disinfectant (j) A, B, C A, B, C A, C, D B, D B, D
Quantity (qij) 10, 8, 5 10, 8, 5 6, 3, 4 13, 7 13, 7
Operation time (tij) 1, 1, 1 1, 1, 1 1, 1, 1 1, 1, 1 1, 1, 1 : The nal disinfectant should be used in the disinfection operation.
Disinfection Operation 1 (infeasible):
Index: 1 2 3 4 5 6 7 8 9 10 11 12 13
Building (i): 2 1 3 2 2 3 1 5 4 5 1 4 3
Disinfectant (j): A C C B C D B D D B A B A
Quantity qij 10 5 3 8 5 4 8 7 7 13 10 13 6
Disinfection Operation 2 (feasible):
Index: 1 2 3 4 5 6 7 8 9 10 11 12 13
Building (i): 2 1 3 2 2 3 1 5 4 5 1 4 3
Disinfectant (j): A C C B C A B D B B A D D
Quantity qij 10 5 3 8 5 6 8 7 13 13 10 7 4
Accumulated qij (10 15 18) (8 13 19) (8 15) (13) (13) (10 17) (4)
Box I
disinfection operation for this building. Thus, in this example, the total number of disinfection operations for all buildings is N = 3 + 3 + 3 + 2 + 2 = 13. Suppose that one vehicle is available and Q = 20, tij = 1:0, dii0 = 0:5, L = 2 for all i, j, i0. The following
information details two disinfection operations, where Disinfection Operation 1 shown in Box I is infeasible (since the nal disinfectant for Buildings 3 and 4 should be D), and Disinfection Operation 2 shown in Box I is feasible.
Disinfection Operation 2 also indicates that the vehicle has to rell its disinfectant supply six separate times. The total routing time = 0:5+(0:5+0:5+0:5)+ 0:5+(0:5+0:5+0:5)+0:5+(0:5+0:5)+0:5+(0:5)+0:5+ (0:5) + 0:5 + (0:5 + 0:5) + 0:5 + (0:5) + 0:5 = 10:5, and the total working time of the worker = total routing time + total working time + total idle time = (10:5) + (13) + (2) = 27:5. A total idle time of 2 hours occurs between Disinfection 4 (Building 2 and Disinfectant B) and Disinfection 5 (Building 2 and Disinfectant C).
3. The new encoding scheme for MDOP In this section, an ecient encoding is presented to convert any permutation of 1 N, where N is the total number of disinfection operations for buildings, into a feasible one. Thus, this novel encoding scheme can
enhance the eectiveness and eciency of the adopted algorithm (i.e., IA) for solving MDOP.
3.1. Encoding example for a single vehicle The following encoding scheme will convert any infea-sible sequence of disinfection operations into a feainfea-sible one. Its main steps for cases involving a single vehicle are as follows:
Step 1. Generate a 4 N matrix M, where Row 1 = (1; 2; :::; N) is an index row, Row 2 is a random permutation of f1; 2; :::; Ng, and Rows 3 and 4 are the index of buildings and their required disinfectants, respectively;
Step 2. Find a given nal disinfectant for each building in Rows 3 and 4. If the nal disinfectant violates the order (i.e., it is not used as the nal disinfectant), then swap it with the current nal disinfectant in matrix M. Repeat this step until all nal disinfectants of all buildings are used as the nal disinfectants;
Step 3. Based on the nal matrix M in Step 2, nd the rell points of the vehicle with vehicle capacity, Q;
Step 4. Compute the idle time of worker(s) for each disinfection operation based on L, the time interval
between two consecutive disinfection operations for the same building.
Consider the example in Table 1 again. In this example, Building 3 requires three disinfectants, namely A, C, and D, where Disinfectant D is the nal disinfectant for this building. Suppose that one vehicle is available and Q = 20, tij = 1:0, dii0 = 0:5, and L = 2
for all i, j, i0.
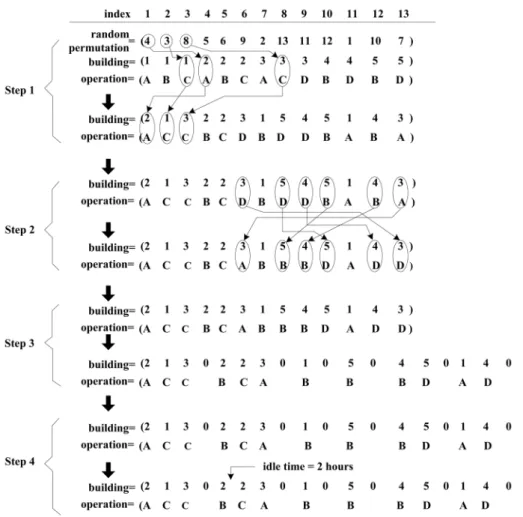
Next, we show the swap process in Step 2 to convert any infeasible sequence of disinfection opera-tions into a feasible one for a single vehicle. The swap process of this example is also illustrated step by step in Figure 1. Since the total number of disinfection operations in Table 1 is N = 3 + 3 + 3 + 2 + 2 = 13, any permutation of f1; 2; :::; 13g can be converted to represent a feasible disinfection operation for the MDOP. Following the main steps of the new encoding in Section 3.1 and Figure 1, we have:
Step 1. Generate a 4 13 matrix M, where Row 1 is the index row (1; 2; :::; 13), Row 2 is a random permutation of f1; 2; :::; 13g, Row 3 is the index of building, and Row 4 is the index of the disinfectant for each building. Suppose that the random permutation
of 1 to 13 in Row 2 is: P = 4 3 8 5 6 9 2 13 11 12 1 10 7. Since P (1) = 4, it is indicated that the rst disinfection operation is Disinfectant A in Building 2 (i.e., nd the column of index = 4). Next, P (2) = 3, indicating that the second disinfection operation is Disinfectant C in Building 1 (i.e., nd the column of index = 3). Then, matrix M is populated as shown in Step 1 of Figure 1;
Step 2. There are three nal disinfectants which are not used as the nal disinfection operations for buildings of matrix M, namely Building 3 (using Disinfectant A now), Building 4 (using Disinfectant B now), and Building 5 (using Disinfectant B now). Thus, these three pairs are swapped with those of their given nal disinfectants, that is, swap (Building 3, Disinfectant D) with (Building 3, Disinfectant A), (Building 5, Disinfectant D) with (Building 5, Disinfectant B), and (Building 4, Disinfectant D) with (Building 4, Disinfectant B). These swaps are shown in Step 2 of Figure 1;
Step 3. Insert 0 to indicate when a disinfectant product rell is required for the vehicle. For example,
the total quantity for the rst three disinfection operations is 10 + 5 + 3 = 18. Since the next quantity is 8 (Building 2, Disinfectant B) and adding this disinfection operation will violate the capacity of vehicle (Q = 20), we insert 0 after the rst three disinfection operations. Similarly, we insert 0 for all rells throughout the matrix;
Step 4. In this step, we check the constraint of two hours (L = 2) for the minimum time interval between two consecutive spray operations for a given building. As shown in Step 4 of Figure 1, there is an idle time of 2 hours for workers while applying Disinfectants B and C in Building 2.
From Figure 1, an infeasible sequence of disinfec-tion operadisinfec-tions (in Step 1) is converted into a feasible one (in Step 4). Using this feasible sequence, we can compute the total routing time of the vehicle and the total working and idle times of the workers to determine the objective value of MDOP. More clearly, we may obtain the assignment of the disinfection operation for the vehicle in Step 2. In Step 3, based on the assignment and the constraint of carrying capacity for the vehicle, we can decide whether to go to the next building or go to rell (i.e., insert 0 between buildings in Figure 1). Finally, based on the constraint of minimal time interval between two consecutive spray applications of disinfectants for each building, we can obtain the entering time of worker to a building. Therefore, the idle time of the worker for each vehicle can be computed as in Step 4 of Figure 1.
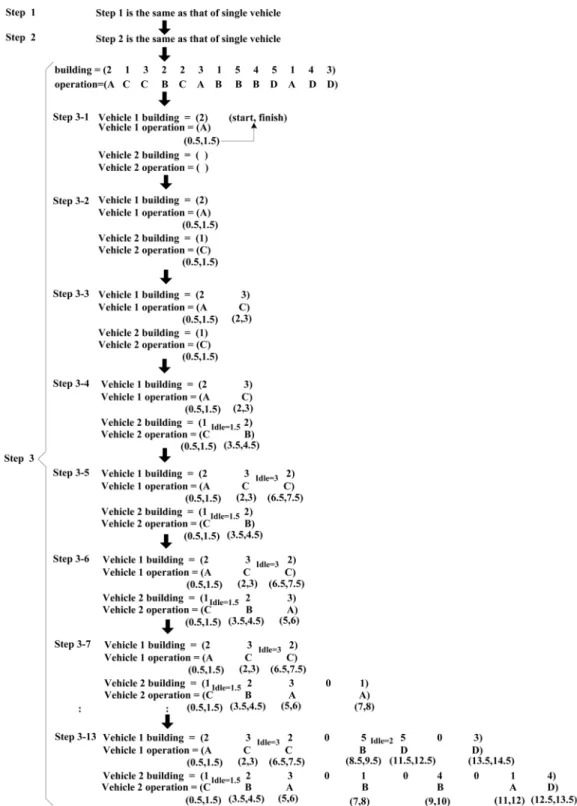
3.2. Encoding example for multiple vehicles The main steps of encoding scheme for multiple vehicles are as follows:
Step 1. The same as that for a single vehicle as described in Section 3.1;
Step 2. The same as that for a single vehicle as described in Section 3.1;
Step 3. Assign the disinfection operation following Rows 3 and 4 to the vehicle with the earliest current nish time. If multiple vehicles have the same current nish time, then arbitrarily assign the disinfection operation to one of those vehicles. Repeat this step until all disinfection operations are assigned to vehicles;
Step 4. Compute the idle time of the worker(s) for the vehicles based on L.
Consider the example in Table 1 again with Q = 20, tij = 1:0, dii0 = 0:5, and L = 2 for all i, j,
i0. For convenience, we suppose that there are two
vehicles available for this example. Our main procedure for converting an infeasible random permutation of disinfection operations into a feasible one is illustrated
step by step in Figure 2. Suppose that the random permutation of 1 to 13 is P = 4 3 8 5 6 9 2 13 11 12 1 10 7. In Figure 2, Steps 1 and 2 are the same as those in Figure 1. Following the steps of the scheme shown in Figure 2, we have the followings:
Step 3-1. The initial nish time for Vehicles 1 and 2 is zero; thus, we arbitrarily assign the 1st operation to Vehicle 1 and compute its start and nish times as V 1 = (0:5; 1:5). Note that we assume dii0 = 0:5 and
tij = 1:0;
Step 3-2. Assign the 2nd operation to the vehicle with the earlier nish time. That is, we assign the 2nd operation (Building 1, Disinfectant C) to Vehicle 2 and compute its start and nish times as V 2 = (0:5; 1:5);
Step 3-3. Assign the 3rd operation to the vehicle with the earlier nish time. Since min fV 1(2); V 2(2)g = minf1:5; 1:5g = 1:5, the nish time is identical for Vehicles 1 and 2, and we may arbitrarily select one, say Vehicle 1. Thus, we assign the 3rd operation (Building 3, Disinfectant C) to Vehicle 1 and compute its corresponding start and nish times as V 1 = (2:0; 3:0);
Step 3-4. Assign the 4th operation to the vehicle with the earlier nish time. Since min fV 1(2); V 2(2)g = minf3:0; 1:5g = 1:5, Vehicle 2 has the earlier nish time, and we assign the 4th operation (Building 2, Disinfectant B) to Vehicle 2 and compute its start and nish times as V 2 = (3:5; 4:5). Note that V 2(1) = 1:5 + 2 = 3:5, since the previous nish time is 1.5 for Building 2 (see Disinfectant A, Step 3-1). For safety reasons, we have to add 2 hours (= L = minimum time interval for two consecutive operations in the same building) to compute the start time. Thus, the nish time of the 4th operation in Vehicle 2 is V 2(2) = V 2(1) + 1:0 = 4:5;
Step 3-5. Assign the 5th operation to the vehi-cle with the earlier nish time. Since minfV 1(2); V 2(2)g = minf3:0; 4:5g = 3:0, Vehicle 1 has the earlier nish time; we assign the 5th operation (Building 2, Disinfectant C) to Vehicle 1 and compute its start and nish times as V 1 = (6:5; 7:5). Note that the previous nish time of Building 2 (Disinfectant B in Step 3-4) is V 1(2) = 4:5; thus, the 5th operation can start at 4:5 + 2(= L) = 6:5, which implies that the idle time of the worker(s) is 6:5 (3:0+0:5) = 3:0. Thus, the nish time of the 5th operation in Vehicle 1 is V 1(2) = V 1(1) + 1:0 = 7:5;
Step 3-6. Assign the 6th operation to the vehi-cle with the earlier nish time. Since minfV 1(1); V 2(1)g = minf7:5; 4:5g = 4:5, Vehicle 2 has the earlier nish time; we assign the 6th operation (Building 3, Disinfectant A) to Vehicle 2 and compute
Figure 2. The example of the encoding procedure for disinfection operation with two vehicles.
its start and nish times as V 2 = (5; 6). Note that the previous nish time of Building 3 (Disinfectant C in Step 3-3) is V 1(2) = 3:0; thus, the 6th operation can start at maxf3:0 + 2(= L); 4:5 + 0:5g = 5:0, implying no idle time for the worker(s). Thus, the nish time of the 5th operation in Vehicle 2 is V 2(2) = V 2(1) + 1:0 = 6:0;
Step 3-7. Assign the 7th operation to the vehi-cle with the earlier nish time. Since minfV 1(2); V 2(2)g = minf7:5; 6:0g = 6:0, Vehicle 2 has the earlier nish time; we assign the 7th operation (Building 1, Disinfectant B) to Vehicle 2 and compute its start and nish times as V 2 = (7; 8). Note that Vehicle 2 has to rell the disinfectant due to the
capacity limit of vehicle (Q = 20) before inserting the 7th operation, and we insert 0 into Vehicle 2. The start time of the 7th operation is V 2(1) = nish time of the 6th operation + the travel time from Building A to depot + the travel time from depot to Building B = 6:0 + 0:5 + 0:5 = 7:0. The previous nish time of Building 1 (Disinfectant C in Step 3-2) is 1.5; therefore, the 7th operation can start at maxf1:5 + 2(= L); 7:0g = 7:0, implying no idle time for the worker(s). Thus, the nish time of the 7th operation in Vehicle 2 is V 2(2) = V 2(1) + 1:0 = 8:0.
By repeating this process until all buildings are treated, the steps shown in Figure 2 are created. Note that, in Figure 2, the handling of constraints, i.e., (i) carrying capacity of each vehicle and (ii) the time interval between two consecutive spray applications of disinfectants for each building must meet or exceed a specied minimum, is similar to handling of those of a single vehicle in Section 3.1.
4. Immune algorithm, genetic algorithm, and particle swarm optimization
As mentioned in Section 1, MDOP is an NP-hard opti-mization problem. In the past decades, several evolu-tionary articial intelligence algorithms have been pro-posed to solve various types of optimization problems, including Genetic Algorithm (GA), Particle Swarm Optimization (PSO), Tabu Search (TS), Simulated Annealing Algorithm (SA), Ant Colony Optimization (ACO), Articial Bee Colony Algorithm (ABC), Im-mune Algorithm (IA), etc. Additionally, several new algorithms inspired by animals, nature, and society have also been proposed to solve various optimiza-tion problems, e.g., Whale Optimizaoptimiza-tion Algorithm (WOA), Grey Wolf Optimizer Algorithm (GWO), Virus Colony Search Algorithm (VCS), Heat Transfer Search Algorithm (HTS), Electromagnetic Field Opti-mization Algorithm (EFO), Teaching-Learning-Based Optimization Algorithm (TLBO), etc. Readers are referenced to [18] for a brief survey of various new evolutionary articial intelligence algorithms.
Though there are several new evolutionary arti-cial intelligence algorithms proposed, GA and PSO might be the most popular algorithms in the literature due to their numerous successful applications, e.g., using GA to solve the multi-objective reliability growth planning problem [19] and using PSO and GA to solve the multi-objective control chart problem [20]. Note that, in [19,20], new versions of GA and PSO have been developed to solve dierent multi-objective optimiza-tion problems. Addioptimiza-tionally, IA, which is similar to GA, has attracted much attention because its memory mechanisms can provide more varieties in population and its several successful applications, e.g., using IA to
solve a multi-objective ergonomic product classication problem [21]. Since the encoding of chromosome of IA and GA is based on 0 and 1, both algorithms are more suitable for discrete optimization problems. The original encoding of PSO is based on a real number, which is suitable for continuous optimization problems. However, the real number encoding of PSO can be easily converted into binary encoding (BPSO, binary particle swarm optimization), implying that it is also suitable for discrete optimization problems.
In this paper, we focus on the main purpose of presenting a new MDOP and solving it by IA practically rather than comparing its eectiveness with several developed algorithms. Therefore, in this paper, IA is adopted to solve the new presented MDOP and compare its numerical results with those of GA and PSO to analyze the eectiveness of IA. Next, the main steps of IA, GA, and PSO are briey described. 4.1. Immune Algorithm (IA)
IA is very similar to GA. The main dierence is that IA has to update the so-called memory set of solutions. We refer to the referenced papers in [22-25] for the introduction of the immune system. Next, the main steps of IA are described briey as follows:
Step 1. Randomly generate a population of strings as the initial solutions;
Step 2. Compute the objective value, i.e., total cost, for each individual in the population;
Step 3. Based on the objective value, choose the best g individuals from the population;
Step 4. Clone these g individuals chosen in Step 3 using the genetic operators of crossover and muta-tion [26];
Step 5. Compute the new objective values for the individuals in Step 4. Update the memory set of strings, that is, replace the inferior individuals with the superior individuals in the memory set. Note that, in this step, individuals will be deleted if their structures are too similar to those in the memory set; Step 6. Check the stopping criterion. If stop, then go to the next step, otherwise go to Step 2;
Step 7. Stop the algorithm and report the optimal or near-optimal solution(s) from the memory set. 4.2. Genetic Algorithm (GA)
GA is a well-known evolutionary method proposed by John Holland in 1975. GA randomly generates a population of strings, and the best string in the population will achieve an optimal solution with the use of evolutionary operators, e.g., crossover, mutation, and reproduction. Readers are referenced to [26] for the introduction of GA and its mechanisms. The main steps of GA are summarized as follows:
Step 1. Randomly generate a population of strings as the initial solutions;
Step 2. Compute the objective value, i.e., total cost, for each individual in the population;
Step 3. Based on the objective value, choose the best g individuals from the population;
Step 4. Clone these g individuals chosen in Step 3 using the genetic operators of crossover and mutation. Compute the objective values of the new individuals; Step 5. Check the stopping criterion. If it stops, then go to the next step, otherwise go to Step 2; Step 6. Stop the algorithm and report the optimal or near-optimal solution(s) from the memory set. 4.3. Particle Swarm Optimization (PSO) PSO is a well-known optimization method proposed by Kennedy and Eberhart in 1995 [27]. PSO randomly generates a population of particles, and the particles in the population will achieve an optimal solution with the update of pbest (particle best) and, gbest (global best) through the so-called velocity and position of particles. Readers are referenced to [28-29] for the introduction of PSO and its mechanisms. The main steps of PSO are summarized as follows:
Step 1. Initialize population, velocity, and position of particles;
Step 2. Evaluate the objective values for particles; Step 3. Find the pbest (particle best) for each particle;
Step 4. Find the gbest (global best) for all particles in populations;
Step 5. Update the velocity and position of each particle using Eqs. (1) and (2) [28-29]:
Vt+1
i =wVit+ C1 rand1() (Xipbest Xit)
+ C2 rand2() (Xgbest Xit); (1)
Xt+1
i = Xit+ Vit+1: (2)
Step 6. If stopping criterion is indicated, then proceed to Step 7;
Step 7. Stop the algorithm and report the optimal or near-optimal solution(s).
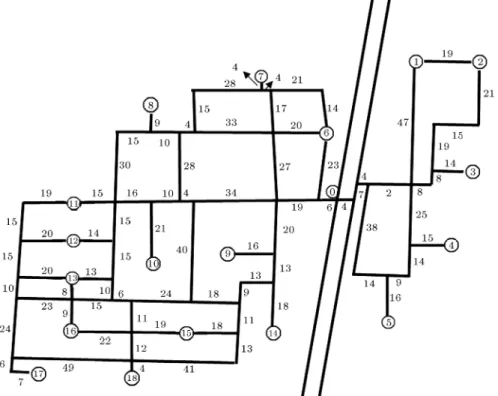
5. Numerical results and discussion 5.1. The instance of NFU
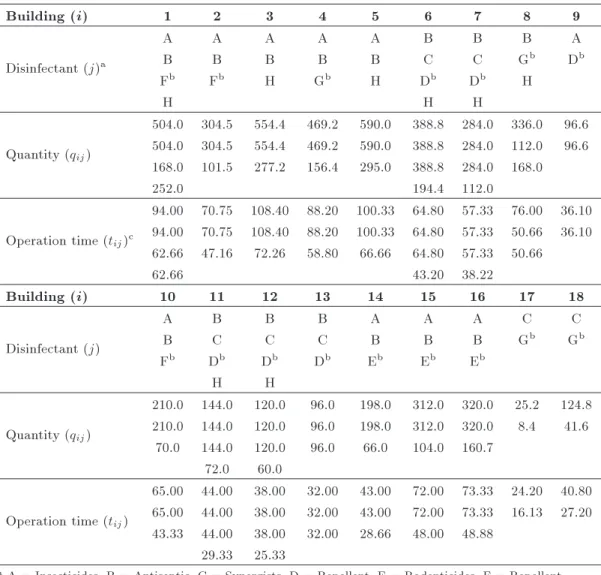
In this section, the campus case of MDOP at National Formosa University (NFU), Taiwan is taken into con-sideration. Figure 3 illustrates the network of NFU main campus in Yunlin, Taiwan, and there are eighteen major buildings (Node 1 to Node 18) requiring multiple disinfection operations. The depot of rell is located at Node 0, and the corresponding distances of buildings are shown in Figure 3.
Since these buildings are dierent in purpose of usage, e.g., class rooms, oces, restaurant, lab-oratories, etc., they require dierent disinfectants in
Table 2. The data of required disinfectants for Buildings 1-18.
Building (i) 1 2 3 4 5 6 7 8 9
Disinfectant (j)a
A A A A A B B B A
B B B B B C C Gb Db
Fb Fb H Gb H Db Db H
H H H
Quantity (qij)
504.0 304.5 554.4 469.2 590.0 388.8 284.0 336.0 96.6 504.0 304.5 554.4 469.2 590.0 388.8 284.0 112.0 96.6 168.0 101.5 277.2 156.4 295.0 388.8 284.0 168.0
252.0 194.4 112.0
Operation time (tij)c
94.00 70.75 108.40 88.20 100.33 64.80 57.33 76.00 36.10 94.00 70.75 108.40 88.20 100.33 64.80 57.33 50.66 36.10 62.66 47.16 72.26 58.80 66.66 64.80 57.33 50.66
62.66 43.20 38.22
Building (i) 10 11 12 13 14 15 16 17 18
Disinfectant (j)
A B B B A A A C C
B C C C B B B Gb Gb
Fb Db Db Db Eb Eb Eb
H H
Quantity (qij)
210.0 144.0 120.0 96.0 198.0 312.0 320.0 25.2 124.8 210.0 144.0 120.0 96.0 198.0 312.0 320.0 8.4 41.6
70.0 144.0 120.0 96.0 66.0 104.0 160.7 72.0 60.0
Operation time (tij)
65.00 44.00 38.00 32.00 43.00 72.00 73.33 24.20 40.80 65.00 44.00 38.00 32.00 43.00 72.00 73.33 16.13 27.20 43.33 44.00 38.00 32.00 28.66 48.00 48.88
29.33 25.33
a A = Insecticides, B = Antiseptic, C = Synergists, D = Repellent, E = Rodenticides, F = Repellent,
G = Insect Growth Regulator, H = Rodenticides.
bThe nal disinfectant for the building. cOperation time is for a worker.
disinfection operations. For example, the mechanical engineering building needs to prevent the biting of electric wires by mouse; the classrooms require the disinfection operations to prevent the mosquito, etc., while the restaurant requires multiple disinfection op-erations to prevent the mouse, mosquito, bacterium, etc. The required types, quantities, and spray time of various disinfectants for each building are estimated and listed in Table 2. Note that, for some buildings, the nal disinfectants are required. For example, the nal disinfectant for Building 1 is Disinfectant F, and the nal disinfectant for Building 13 is Disinfectant D. Therefore, there are six possible sequences of disinfec-tion operadisinfec-tion of disinfectants for Building 1, namely (A, B, H, F), (A, H, B, F), (B, A, H, F), (B, H, A, F), (H, A, B, F), and (H, B, A, F), respectively; in addition, there are two possible sequences of disinfection opera-tion of disinfectants for Building 13, namely (B, C, D)
and (C, B, D), respectively. In this test instance, we set the capacity of vehicle to Q = 1000, and the minimal interval time of two consecutive disinfection operations is L = 2 (hours).
5.2. The parameters and strategies
In this paper, three algorithms, namely IA, GA, and PSO, are adopted to solve the campus case of MDOP. To nd an appropriate crossover rate and mutation rate for IA and GA, 100 experiments were executed for various combinations of crossover and mutation rates, namely (0.32, 0.02), (0.32, 0.05), (0.32, 0.08), (0.48, 0.02), (0.48, 0.05), (0.48, 0.08), (0.96, 0.02), (0.96, 0.05), and (0.96, 0.08). Our preliminary numerical results show that crossover rate = 0.96 and mutation rate = 0.05 are appropriate for our experiments. In addition, to nd the appropriate parameter values of C1 and C2 in PSO, 100 experiments for various
combinations of C1and C2, namely (1.49449, 1.49449),
(2.0, 2.0), (3.1417, 3.1417), (5.1417, 5.1417), and (5.1417, 3.1417) which were suggested in the literature, were carried out. Our preliminary numerical results of the tests show that (C1; C2) = (2:0; 2:0) are
appro-priate for our experiments. Moreover, based on our preliminary tests, the parameters for IA and GA are set as population = 200, anity = 0.25, crossover = 0.96, mutation = 0.05, maximum generations = 500, and maximum no. of reproduction of each chromosome = 7. For PSO, parameters are set as population = 500, maximum generations = 1000, and inertia weight (w) = 0:2. Our programs are coded in MATLAB R2008b, and all results are computed by Intel-Pentium IV 4 CPU 3.0 GHz PC.
In this paper, various strategies are tested for the MDOP, namely:
Strategy 1: 1 vehicle with 1 worker; Strategy 2: 1 vehicle with 2 workers; Strategy 3: 1 vehicle with 3 workers;
Strategy 1-1: 2 vehicles with 2 workers, i.e., one worker for each vehicle;
Strategy 1-2: 2 vehicles with 3 workers, i.e., one worker in a vehicle and two workers in another vehicle;
Strategy 2-2: 2 vehicles with 4 workers, i.e., two workers for each vehicle;
Strategy 2-3: 2 vehicles with 5 workers, i.e., two workers in a vehicle and three workers in another vehicle;
Strategy 3-3: 2 vehicles with 6 workers, i.e., three workers for each vehicle.
Of note, we assume that the work eciency is identical for all workers. Therefore, if a disinfection operation requires 90 minutes for a building with Strategy 1, then it reduces to 30 minutes when Strategy 3 is adopted. In addition, to test more experiments, we set = 1, 5, and 10 for a unit distance (m), respectively. For all cases, we set = 500 and = 0, 10000/60 (min) = 166.67 (hr).
5.3. Numerical results and discussions
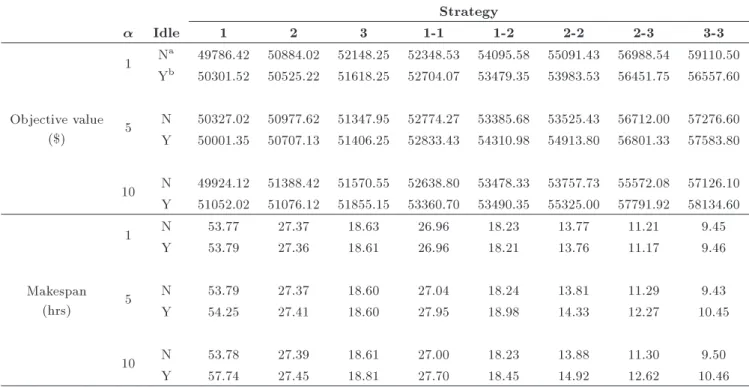
For each strategy, we experiment 100 times for IA, GA, and PSO and report the best solutions. Numerical results are summarized in Tables 3 to 6 and Figure 4. Note that there are 48 sub-instances solved for each algorithm in the experiments ( = 1, 5, 10, eight strategies, idle/no idle for worker(s)). From Tables 3 to 6 and Figure 4, we observe that:
1. For IA approach, the best strategy for = 1, 5, and 10 is Strategy 1 with objective values of 49786.42, 50327.02, and 49924.12 when idle time of workers is not allowed, and those of 50301.52, 50001.35, 51052.02 when idle time of workers is allowed. That is, Strategy 1 (one vehicle with one worker) is the
Table 3. Numerical results of IA for various strategies. Strategy
Idle 1 2 3 1-1 1-2 2-2 2-3 3-3
Objective value ($)
1 Na 49786.42 50884.02 52148.25 52348.53 54095.58 55091.43 56988.54 59110.50 Yb 50301.52 50525.22 51618.25 52704.07 53479.35 53983.53 56451.75 56557.60
5 N 50327.02 50977.62 51347.95 52774.27 53385.68 53525.43 56712.00 57276.60 Y 50001.35 50707.13 51406.25 52833.43 54310.98 54913.80 56801.33 57583.80
10 N 49924.12 51388.42 51570.55 52638.80 53478.33 53757.73 55572.08 57126.10 Y 51052.02 51076.12 51855.15 53360.70 53490.35 55325.00 57791.92 58134.60
Makespan (hrs)
1 N 53.77 27.37 18.63 26.96 18.23 13.77 11.21 9.45
Y 53.79 27.36 18.61 26.96 18.21 13.76 11.17 9.46
5 N 53.79 27.37 18.60 27.04 18.24 13.81 11.29 9.43
Y 54.25 27.41 18.60 27.95 18.98 14.33 12.27 10.45
10 N 53.78 27.39 18.61 27.00 18.23 13.88 11.30 9.50
Y 57.74 27.45 18.81 27.70 18.45 14.92 12.62 10.46
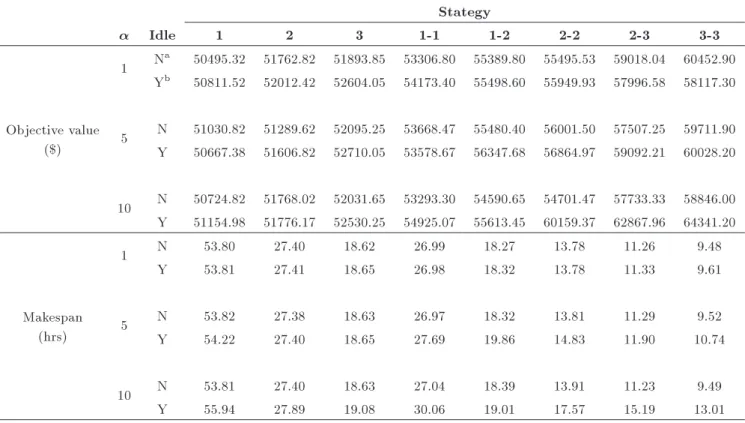
Table 4. Numerical results of GA for various strategies. Stategy
Idle 1 2 3 1-1 1-2 2-2 2-3 3-3
Objective value ($)
1 Na 50495.32 51762.82 51893.85 53306.80 55389.80 55495.53 59018.04 60452.90 Yb 50811.52 52012.42 52604.05 54173.40 55498.60 55949.93 57996.58 58117.30
5 N 51030.82 51289.62 52095.25 53668.47 55480.40 56001.50 57507.25 59711.90 Y 50667.38 51606.82 52710.05 53578.67 56347.68 56864.97 59092.21 60028.20
10 N 50724.82 51768.02 52031.65 53293.30 54590.65 54701.47 57733.33 58846.00 Y 51154.98 51776.17 52530.25 54925.07 55613.45 60159.37 62867.96 64341.20
Makespan (hrs)
1 N 53.80 27.40 18.62 26.99 18.27 13.78 11.26 9.48
Y 53.81 27.41 18.65 26.98 18.32 13.78 11.33 9.61
5 N 53.82 27.38 18.63 26.97 18.32 13.81 11.29 9.52
Y 54.22 27.40 18.65 27.69 19.86 14.83 11.90 10.74
10 N 53.81 27.40 18.63 27.04 18.39 13.91 11.23 9.49
Y 55.94 27.89 19.08 30.06 19.01 17.57 15.19 13.01
aN indicates that idle time of workers is not allowed;bY indicates that idle time of workers is allowed.
Table 5. Numerical results of PSO for various strategies. Stategy
Idle 1 2 3 1-1 1-2 2-2 2-3 3-3
Objective value ($)
1 Na 56192.02 58496.82 62170.55 59362.03 63238.90 64550.67 70002.00 75730.80 Yb 54376.42 58678.82 61184.65 57364.57 61551.70 62493.63 64257.25 66891.10
5 N 55784.02 58496.82 62170.55 59339.07 61413.40 63882.17 67906.92 75706.50 Y 52977.43 54794.42 57798.05 55816.10 59990.70 60435.50 62794.00 64490.00
10 N 56375.62 60566.42 61205.95 60344.53 61720.30 64830.50 67817.33 72676.50 Y 52937.65 54720.12 56353.85 56919.87 61194.10 63485.80 64927.42 66948.40
Makespan (hrs)
1 N 54.02 27.66 19.01 27.35 18.42 14.05 11.50 10.22 Y 53.95 27.67 18.99 27.19 18.42 13.97 11.72 10.17
5 N 54.01 27.66 19.01 27.25 18.51 14.09 11.44 10.15 Y 54.32 27.52 18.85 27.26 19.27 15.80 11.98 11.22
10 N 54.03 27.74 18.97 27.24 18.36 14.08 11.44 10.05 Y 58.72 28.38 19.06 30.74 21.85 17.94 14.25 12.21
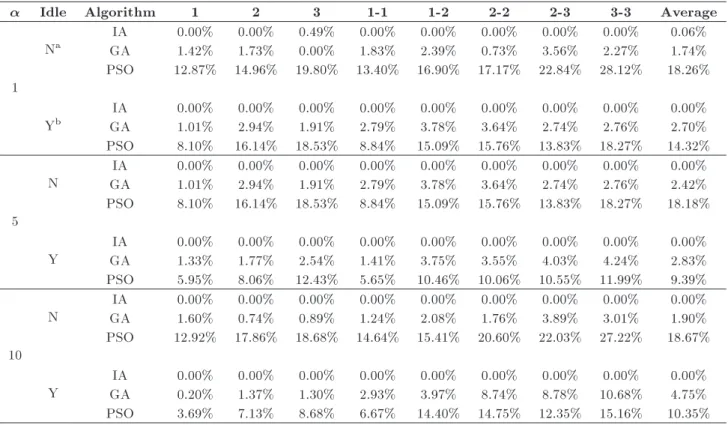
Table 6. Comparison of objective values for three algorithms for various strategies.
Idle Algorithm 1 2 3 1-1 1-2 2-2 2-3 3-3 Average
1
Na GAIA 0.00%1.42% 0.00%1.73% 0.49%0.00% 1.83%0.00% 0.00%2.39% 0.00%0.73% 3.56%0.00% 2.27%0.00% 0.06%1.74%
PSO 12.87% 14.96% 19.80% 13.40% 16.90% 17.17% 22.84% 28.12% 18.26%
Yb GAIA 0.00%1.01% 0.00%2.94% 0.00%1.91% 2.79%0.00% 0.00%3.78% 0.00%3.64% 2.74%0.00% 2.76%0.00% 0.00%2.70%
PSO 8.10% 16.14% 18.53% 8.84% 15.09% 15.76% 13.83% 18.27% 14.32%
5 N
IA 0.00% 0.00% 0.00% 0.00% 0.00% 0.00% 0.00% 0.00% 0.00%
GA 1.01% 2.94% 1.91% 2.79% 3.78% 3.64% 2.74% 2.76% 2.42%
PSO 8.10% 16.14% 18.53% 8.84% 15.09% 15.76% 13.83% 18.27% 18.18%
Y
IA 0.00% 0.00% 0.00% 0.00% 0.00% 0.00% 0.00% 0.00% 0.00%
GA 1.33% 1.77% 2.54% 1.41% 3.75% 3.55% 4.03% 4.24% 2.83%
PSO 5.95% 8.06% 12.43% 5.65% 10.46% 10.06% 10.55% 11.99% 9.39%
10 N
IA 0.00% 0.00% 0.00% 0.00% 0.00% 0.00% 0.00% 0.00% 0.00%
GA 1.60% 0.74% 0.89% 1.24% 2.08% 1.76% 3.89% 3.01% 1.90%
PSO 12.92% 17.86% 18.68% 14.64% 15.41% 20.60% 22.03% 27.22% 18.67%
Y
IA 0.00% 0.00% 0.00% 0.00% 0.00% 0.00% 0.00% 0.00% 0.00%
GA 0.20% 1.37% 1.30% 2.93% 3.97% 8.74% 8.78% 10.68% 4.75% PSO 3.69% 7.13% 8.68% 6.67% 14.40% 14.75% 12.35% 15.16% 10.35%
aN indicates that idle time of workers is not allowed;bY indicates that idle time of workers is allowed.
Note: (A-B)/B%, A = objective value of A, A = IA, GA, PSO, B = the best objective value among IA, GA, and PSO.
Figure 4. Numerical results of strategies versus total cost and makespan for various approaches.
best one. For GA and PSO, a similar result is obtained;
2. IA is superior to GA, except for the case of Strat-egy 3 (one vehicle with 3 workers) when = 1 and there is no idle time of workers. For example, for the case of Strategy 3 with = 1 and no idle time
of workers, the objective value of GA is 51893.85 which is better than 52148.25 obtained by GA;
3. IA is superior to PSO, and GA is superior to PSO for all cases of test problems. For example, for Strategy 1-1 with = 1 and no idle time of workers, the objective value of PSO is 59362.03, while it is 53306.80 for GA and 52348.53 for IA. Similar results for the other cases are obtained;
4. Figure 4 summarizes the numerical results of Ta-bles 3 to 5, and it can be used to select the best strategy for universities and disinfection companies according to their budget or makespan (completion time). For example:
(i) If the budget of disinfection is 55000, idle time is not allowed, and = 1, then there are 5 feasible strategies, namely:
Strategy 1: Budget used = 49786.42 and makespan = 53.77 (hrs);
Strategy 2: Budget used = 50884.02 and makespan = 27.37 (hrs);
Strategy 3: Budget used = 51893.85 and makespan = 18.62 (hrs);
Strategy 1-1: budget used = 52348.53 and makespan = 26.96 (hrs);
Strategy 1-2: Budget used = 54095.58 and makespan = 18.23 (hrs).
This further indicates that Strategy 1-2 is the best one with minimal makespan 18.23 (hrs) if budget is 55000.
(ii) If the makespan of disinfection is set to 15 (hrs), idle time is not allowed, and = 1, then there are 3 feasible strategies, namely:
Strategy 2-2: Budget used = 55091.43 and makespan = 13.77 (hrs);
Strategy 2-3: Budget used = 56988.54 and makespan = 11.21 (hrs);
Strategy 3-3: Budget used = 59110.50 and makespan = 9.45 (hrs).
This further indicates that Strategy 2-2 is the best one with minimal budget 55091.43 if the makespan of disinfection is limited to 15 (hrs).
5. Table 6 reports the comparison of results among IA, GA, and PSO. It shows that, in the objective value, IA outperforms GA from 1.74% to 4.75% and outperforms PSO from 9.39% to 18.67% for various combinations of and idle/no idle for worker(s). To further analyze the performance of IA, GA, and PSO algorithms, based on the 100 experiments, the following statistical hypothesis is used to test whether or not there is a signicant dierence among these three algorithms:
H0: V (A) = V (B);
H1: V (A) 6= V (B);
where V (A) denotes the average objective value by using algorithm A, A = IA, GA, or PSO. The p-values of the statistical hypothesis show that:
(i) Except for one sub-instance (no idle, = 1, Strategy 3-3) with p-value of 0.082, IA outperforms GA for the other sub-instances;
(ii) IA outperforms PSO for all 48 sub-instances (with p-value < 0.05);
(iii) GA outperforms PSO for all 48 sub-instances (with p-value < 0.05).
These results of statistical hypothesis imply that IA outperforms GA, and GA outperforms PSO for solving the MDOP.
The above numerical results are based on a prac-tical instance at NFU (Taiwan). Currently, Strategy 1 is adopted at NFU, i.e., one vehicle with one worker. In the past, the worker scheduled all spray operations according to the order of Disinfectants A, B, C, H, D, E, F, G, respectively. Additionally, for the same disinfectant, the nearest rule was used to schedule the order of buildings. For example, there are ten buildings requiring the spray operation of Disinfectants A, and the spray order of these buildings adopted is: 9 ! 14 ! 15 ! 16 ! 10 ! 3 ! 2 ! 1 ! 4 ! 5, since
Building 9 is closest to the depot (Node 0 in Figure 3); then, Building 14 is closest to Building 9, Building 15 is closest to Building 14, and so on. The objective value for this typical schedule is $58628.75 ( = 10, no idle), which further implies that there is an improvement of 17.44% by IA (objective value = $49924.12), 15.58% by GA (objective value = 50724.82), and 4.00% by PSO (objective value = $56375.62).
6. Conclusions In this paper:
1. We proposed and investigated the MDOP, in which several buildings were sprayed with multiple disin-fectants. In addition, there were some disinfectants designated for use as the nal disinfectants;
2. We developed an ecient encoding scheme of spray operations to convert any infeasible sequence of disinfection operations into a feasible one, and it can simultaneously determine the sequence of buildings and their disinfectant spray operations;
3. We compared the numerical results of IA, GA, and PSO with that of the typical schedule adopted at NFU, and it was shown that there was an improvement of 17.44% by IA, 15.58% by GA, and 10.75% by PSO;
4. We applied IA, GA, and PSO for solving the MDOP using various strategies. Numerical results showed that IA outperformed GA from 1.74% to 4.75% except for one sub-instance of test problem, and IA was superior to PSO from 9.39% to 18.67% for all sub-instances of the test problem;
5. We provided numerical results of strategies using various numbers of vehicles and workers. As shown in the discussion, the best strategy can be easily derived based on the numerical results when the budget or makespan of the disinfection operation is given. Therefore, the numerical results of this paper can be useful for disinfection companies or universities in scheduling their optimal disinfection operations based on their budgets or total comple-tion time (makespan) targets.
In the future, one may use other evolutionary articial intelligence algorithms to solve the presented MDOPs and compare their eectiveness. Additionally, one may consider other variants of MDOP. For exam-ple, there are 5 disinfection operations A, B, C, D, and E for Building 1, and the rst and last disinfection operations of disinfectants for this building must be xed as A and E, respectively.
Acknowledgement
numerical results of experiments. This research was supported by National Science Council, Taiwan, under Grant no. NSC 100-2221-E-150-041-MY3.
References
1. Lawler, E.L., Lenstra, J.K., Rinnooy Kan, A.H.G., and Shmoys, D.B., The Traveling Salesman Problem: A Guided Tour of Combinatorial Optimization, John Wiley & Sons (1985).
2. Gutin, G. and Punnen, A.P., The Traveling Salesman Problem and Its Variations, Springer (2006).
3. Cook, W., In Pursuit of the Traveling Salesman:
Mathematics at the Limits of Computation, Princeton University Press (2011).
4. Toth, P. and Vigo, D., The Vehicle Routing Problem, Philadelphia: SIAM (2001).
5. Oliveira, H.C.B. and Vasconcelos, G.C. \A
hy-brid search method for the vehicle routing problem with time windows", Annals of Operations Research, 180(1), pp. 125-144 (2008).
6. Pillac, V., Gendreau, M., Gueret, C., and Medaglia, A.L. \A review of dynamic vehicle routing problems", European Journal of Operational Research, 225(1), pp. 1-11 (2013).
7. Beltrami, E.J. and Bodin, L.D. \Networks and vehicle routing for municipal waste collection", Networks, 4(1), pp. 65-94 (1974).
8. Francis, P.M., Smilowitz, K.R., and Tzur, M. \The period vehicle routing problem and its extensions", (book series) Operations Research/Computer Science Interfaces, 43, pp. 73-102 (2008).
9. Mourgaya, M. and Vanderbeck, F. \The periodic
vehicle routing problem: classication and heuristic", RAIRO - Operations Research, 40(2), pp. 169-194 (2006).
10. Nguyen, P.K., Crainic, T.G., and Toulouse, M. \Hy-brid generational genetic algorithm for the periodic vehicle routing problem with time windows", Journal of Heuristics, 20(4), pp. 383-416 (2014).
11. Michallet, J., Prins, C., Amodeo, L., Yalaoui, F., and Vitry, G. \Multi-start iterated local search for the periodic vehicle routing problem with time windows and time spread constraints on services", Computers & Operations Research, 41, pp. 196-207 (2014).
12. Koc, C. \A unied-adaptive large neighborhood search metaheuristic for periodic location-routing problems", Transportation Research Part C, 68, pp. 265-284 (2016).
13. Lim, W.C.E., Kanagaraj, G., and Ponnambalam, S.G. \A hybrid cuckoo search-genetic algorithm for hole-making sequence optimization", Journal of Intelligent Manufacturing, 27(2), pp. 417-429 (2016).
14. Dalavi, A.M., Pawar, P.J., and Singh, T.P. \Tool path planning of hole-making operations in ejector plate of injection mould using modied shued frog leaping algorithm", Journal of Computational Design and Engineering, 3, pp. 266-273 (2016).
15. Dalavi, A.M., Pawar, P.J., Singh, T.P., Warke, A.S., and Paliwal, P.D. \Review on optimization of hole-making operations for injection mould using non-traditional algorithms", International Journal of In-dustrial Engineering and Management, 7(1), pp. 9-14 (2016).
16. Solimanpur, M., Foroughi, A., and Mohammadi,
M. \Optimum route selection in hole-making opera-tions using a dynamic programming-based method", Cogent Engineering, 3, Article 1201991 (2016). http://dx.doi.org/10.1080/23311916.2016 .1201991
17. Garey, M.R. and Johnson, D.S., Computers and
Intractability: A Guide to the Theory of
NP-Completeness, Macmillan (1979).
18. Mirjalili, S. and Lewis, A. \The whale optimization algorithm", Advances in Engineering Software, 95, pp. 51-67 (2016).
19. Li, Z., Mobin, M., and Keyser, T. \Multi-objective and multi-stage reliability growth planning in early product development stage", IEEE Transaction on Reliability, 65, pp. 769-781 (2016).
20. Tavana, M., Li, Z., Mobin, M., Komaki, M., and
Teymurian, E. \Multi-objective design of control chart optimization using NSGA-III and MOPSO enhanced with DEA and TOPSIS", Expert System with Applica-tions, 50, pp. 17-39 (2016).
21. Tavana, M., Kazemi, M.R., Vafadarnikjoo, A., and Mobin, M. \An articial immune algorithm for er-gonomic product classication using anthropometric measurements", Measurement, 94, pp. 621-629 (2016).
22. Weissman, I.L. and Cooper, M.D. \How the immune system develops", Scientic American, 269, pp. 33-40 (1993).
23. Huang, S.J. \Enhancement of thermal unit commit-ment using immune algorithms based optimization approaches", Electrical Power & Energy Systems, 21, pp. 245-252 (1999).
24. Hsieh, Y.C. and You, P.S. \An eective immune
based two-phase approach for the optimal reliability-redundancy allocation problem", Applied Mathematics and Computation, 218, pp. 1297-1307 (2011).
25. Hsieh, Y.C. and You, P.S. \An immune evolutionary approach for the label printing problem", International Journal of Computational Intelligence Systems, 7(3), pp. 515-523 (2014).
26. Michalewicz, Z., Genetic Algorithm + Data Structures = Evolution Programs, Springer-Verlag, New York (1994).
27. Kennedy, J. and Eberhart, R., \Particle swarm opti-mization", Proceedings of IEEE International Confer-ence on Neural Networks, IV, pp. 1942-1948 (1995).
28. Chen, W. and Zhang, J. \A novel set-based particle swarm optimization method for discrete optimization problem", IEEE Transactions on Evolutionary Com-putation, 14(2), pp. 278-300 (2010).
29. Eberhart, R.C., Hu, X., and Shi, Y. \Particle swarm with extended memory for multiobjective optimiza-tion", IEEE International Conference on Swarm In-telligence Symposium, pp. 193-197 (2003).
Biographies
Yi-Chih Hsieh received his PhD degree (1995) in Industrial Engineering from The University of Iowa, USA. His current research interests include optimiza-tion, operations research, and applications of pro-gramming and articial intelligence algorithms. He is now a Professor at the Department of Industrial
Management, National Formosa University, Taiwan. Pei-Ju Lee received a PhD degree (2015) in Infor-mation Science from University of Pittsburgh, USA. Her research interests include data fusion, data min-ing, human-robot interaction, and articial intelligence algorithms. She is now an Assistant Professor at the Department of Information Management, National Chung Cheng University, Taiwan.
Peng-Sheng You received a PhD degree (1997) in Management Science and Engineering from University of Tsukuba, Japan, and his current research interests include inventory management, supply chain man-agement, and articial intelligence algorithms. He is now a Professor at the Department of Business Administration, National Chiayi University, Taiwan.