An Effective Implementation of Internet of Things
for Agile Demand Response
M. Babar
∗†, J. Grela
∗, A. Ozadowicz
∗, P.H. Nguyen
†, Z. Hanzelka
∗and I.G. Kamphuis
†∗Faculty of Electrical Engineering, Automatics, Computer Science and Biomedical Engineering
AGH University of Science and Technology, Krakow, Poland
†Electrical Energy Systems Group, Department of Electrical Engineering,
Eindhoven University of Technology, Eindhoven, The Netherlands Email: [email protected]
Abstract—Transactive based control mechanism (TCM) needs the IoT environment to fully explore flexibility potential from the end-users to offer to involved actors of the smart energy system. On the other hand, many IoT based energy management systems are already available to a market. This paper presents an ap-proach to connect the current demand-driven (top-down) energy management system (EMS) with a market-driven (bottom-up) demand response program. To this end, this paper considers multi-agent system (MAS) to realize the approach and introduces the concept and standardize design of Agilometer. It is described as an elemental agent of the approach. Proposed by authors Agilometer consists of three different functional blocks, which are formulated as an IoT platform according to the LonWorks standard. Moreover, the paper also performs an evaluation study in order to validate the proposed concept and design.
Index Terms—demand response; energy management system; Internet of Things; Transactive based control mechanism ; smart metering;
I. INTRODUCTION
In general, Transactive based control mechanism (TCM) requires the integration of advanced information and com-munication technology to dynamically manage power supply and demand. One of the most popular control methodologies to enable TCM is Multi-agent System (MAS) for integrating demand response and home energy management systems [1]. Multi-agent system comprises two or more intelligent con-trol units (i.e. referred as agents). Agents are capable of interacting with each other in a controlled environment, as well as they can be organized in multiple ways such that a global objective of the system should be distributed among all agents into a set of smaller tasks. In context of energy management system (EMS), every agent has the ability to monitor energy usage, primary process parameters (e.g., occupancy, comfort level), and control signals during an operation [2]. Agent is also equipped with communication module for sharing of data and information with other agents.
During the last decade, MAS has been widely considered in many different power system applications and pilot projects. For example, the PowerMatcher developed by the Netherlands Organization for Applied Scientific Research (TNO) is a demand response that balances demand and supply over local basis. The project present bidding mechanism to manage the loads with more precision and efficiency. The devices inside
the PowerMatcher are represented by agents, where they are organized in co-tree fashion. Each agent talks to upper-stream agent and expresses its willingness to consume or produce energy in the form of a simple bid (a demand or supply relationship). Based on the bids the upstream agent (namely concentrator) decides what any device should produce or consume in order to keep the system balance [3].
The energy department of Flemish Institute for Technologi-cal Research (VITO) also developed a similar product based on the same MAS organization, it was initially referred as Intelligator. Later, VITO focused on the development of a software library contains advanced algorithms, which enhance the intelligence of agents. In particular, the algorithms consider local electronic auction to regulate the system where partici-pants of auction send their requested power in form of bid to an upstream-agent (namely auctioneer). The auctioneer finds a balance between production and consumption by adding all bids from agents. Then it responds to the participants with a demand schedule over day-ahead basis [4].
There are also some technological applications like Po-werRouter by NEDAP or Intelliweb by Mastervolt, which perform an intelligent control of solar energy at home in order to increase power injection to the grid. These applications provides access to data via their data server to acquire and control in real-time [5], [6].
Furthermore, there are projects that use MAS based EMS to improve quality and control of power system, like ForskEL in Denmark [7]. Moreover, an ongoing EU project “Multi-agent systems and secured coupling of Telecom and EnErgy gRIds for Next Generation smart grid services” is aimed at developing IoT platform for the monitoring and optimal management of low-voltage distribution grids by integrating last mile connectivity solutions with distributed optimization technologies, while enhancing the security of increased bi-directional communications [8].
In short, all existing applications and research provide enough study to perform demand in power system. However, current evidence is either anecdotal or insufficient to provide generalize principles. Moreover, different research communi-ties tried to tackle the issue of demand response integration in EMS within their own expertise, at the cost of precision in respective domain. Hence the studies lack representativity,
TRANSACTIONS ON ENVIRONMENT AND ELECTRICAL ENGINEERING ISSN 2450-5730 Vol 2, No 2 (2017) c
IoT Energy Meter
nvoEnergy nvoRegValueEnergy nvoEnergyClearTime nvoPower nvoVoltage nvoCurrent nvoFreq nvoStatus nvoPowerUpHours nviTimeSet
nviEnergyClear
cpEnergySendDelta cpEnergyMaxSendTime cpPowerSendDelta cpPowerMaxSendTime cpVoltageSendDelta cpVoltageMaxSendTime cpCurrentSendDelta cpCurrentMaxSendTime cpFreqSendDelta cpLocation Set time and date Reset nvoEnergy
Total active energy Total active energy, can not be reset Date and time of reseting nvoEnergy Total active power
Phase voltage mean value Phase current mean value Fundamental voltage frequency Device status report/info Operating hours since the last time operating voltage was switched on
Send condition: delta energy
Send condition: max time until transmission of nv Send condition: delta power
Send condition: max time until transmission of nv Send condition: delta voltage
Send condition: max time until transmission of nv Send condition: delta current
Send condition: max time until transmission of nv Send condition: delta frequency
Installation location and meter ID nvoSwitch
nviSwitch Load control input
Load control output
IoT Energy Logger
nvoEnergy nvoRegValueEnergy nvoEnergyHistTime nvoDemand nvoDemandPeak nvoDemandPeakTime nvoMeasurePeriod nvoStatus nviTimeSet
nviResetEnergy
cpLogMinutes cpDemandPerMinutes cpDemandSubinterval cpHighLimit cpBaseValue cpEnergyMaxSendTime cpEnergySendDelta cpRegisterName cpLocation Set time and date Reset nvoEnergy
Total active energyTotal active energy, can not be reset Register historical time output Demand power (average power over demand period) Peak demand power Time and date of peak demand Register measuring period output Device status report/info
Logging interval. Default: 15 min.
Demand period: 5 min. to 1440 min. Default: 15 min. Rolling demand subinterval count: 1-8. Default: 1 Send condition: max time until transmission of nv Definition of the highest normal value of the register Definition of the base value of the register Send condition: delta energy Definition of the register name Installation location and logger ID nviResetDemandPeak
nviPeriodChoice nviTimeSelection nviEndPeriod nviRegisterState nviRegisterValue
Reset peak demand Register historical period selection input Register historical time selection input Measuring period ending input Register state selection input Register value input
IoT Elasticity Learner
nvoExpDemand nvoAbsAction nvoStatus nviTimeSet
nviDemand
cpValueFunction
Set time and date Expected demand value (calculated) Action (price) value (of calculation) Device status report/info
nviParam (start time) nviParam (stop time)
nviParam (etc...) Demand value input
Send condition: maximum reward cpExpRewardInterval
cpStateSpace cpActionSpaceInterval cpLocation Input parameter which may affect demand - Price Input parameter which may affect demand - Occupancy Set of input parameters (complex bid) which may affect demand
Send condition: nvoExpDemand Setting: triggerings actions Setting: Learner value function
Location and learner module ID
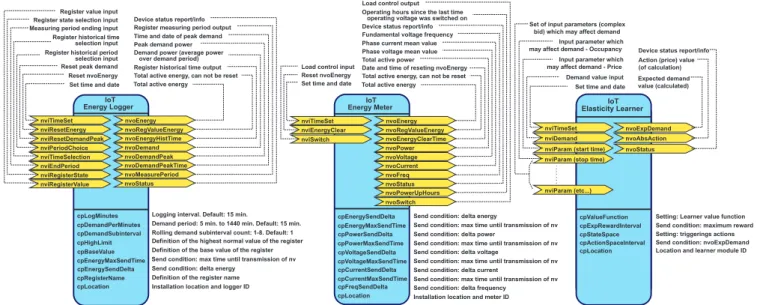
Fig. 1. A developed Agilometer functional blocks.
which is taken into consideration in this paper. The paper proposes “Agilometer” as a key element to achieve the concept of agile demand response, presented in [9], [10].
There are six key features that should be defined in the Flexometer.
• Abstract and standardized design for information sharing
• Availability of data for training
• Ability to work iteratively and deliver incrementally
• Self-adaptability
• Use of communication technology
• Delivery of demand flexibility on demand
This paper addresses mentioned features of the Flexometer as follows. Section II discusses the abstract and standardized design and concept for information sharing. It further explains in detail the features of data availability training, iterative processing and self-adaptability in form of three different functional blocks of Flexometer. Section III presents how Flexometer is implemented in the context of TCM by using simple and low-tech communication methods. Section IV fo-cuses on the evaluation and validation of real-time operation of Flexometer. Finally, some conclusions are drawn in Section V.
II. DESIGN ANDCONCEPT OFFLEXOMETER
In order to implement Flexometer in EMS, the IzoT plat-form, introduced by Echelon Corp., has been selected. It is offered as next generation of the LonWorks standard techno-logy dedicated for Building Automation and Control Systems (BACS), with capability to use IP-all-the-way to the end device. The IzoT platform has already provided a development environment with chips, stacks, communication, application interfaces (API) and management software. Interoperability between IzoT network devices is provided by functional profiles, in accordance with the LonWorks standard.
Based on this platform, a standardized design of the Flexo-meter is proposed in this section. FlexoFlexo-meter supports three
main functions: (1) an Energy Meter, (2) an Energy Logger and (3) an Elasticity Learner, as shown in Fig. 1. In the functional profile there are defined network variables (NVs) and configuration properties (CPs), which are included in functional blocks as per algorithm requirement. Herein, the paper designs the functional blocks in such a fashion that they are collectively able to express all kind of primary process parameters and customer preferences. However, the details explanation of each network variables (NVs) and configuration properties (CPs) within each block are presented in [11], [12].
A. Energy Meter
Changes within the device and its primary process pa-rameters are acquired by energy meter on real-time basis. The energy meter also captures changes that may occur due to customer preferences (e.g. user implicitly controlled or EMS explicitly controlled the device) or may occur naturally due to environmental change (e.g. room temperature). Then energy meter stores the current primary process parameters and customer preferences as a table with columns for all network variable and configuration properties respectively.
B. Energy Logger
Once the energy meter has acquired agent state (i.e.primary process parameters and customer preferences), energy logger then separates it into events. Each event denotes an instance with respect to the state and a control action that was being performed. Then the pair of action and state is logged into the logger.
To apply learning algorithm, the state must be mapped to a Markov decision process (MDP) consisting of a data tuple
(state, action, transition probability, reward). State xk of an
agent includes all possible network variables and configuration
properties. Action uk captures the control action to an agent
describing the transition of a agent from current state to a
new state for a given action. Reward rk herein is simply a
marginal energy cost incurred by an agent for the given state
xk and action uk, as follows:
λk = Γk×(1 +
1
k
) (1)
whereΛ= [. λ1, . . . , λK]represents the vector of marginal cost
which is expected to incurred by Flexometer. Γk represents
price duringkthinterval.
k is a price elasticity of demand.
C. Energy Elasticity Learner
This functional block has an objective to forecast a state of an agent for an expected action by using the concept of price elasticity of demand. It has been found in [13] that price elasticity of demand can be successfully use for estimating
agent’s value-proposition (i.e. bid). IfKrepresents the number
of intervals through out the day, then the price elasticity of demand or demand elasticity is defined as the change in
demand δDk due to the change in the electricity price δλk
during an interval. Moreover, the effect of current price over demand is called self-elasticity and the effect of prices during other intervals over current demand is called cross elasticity. Combing cross-elasticity and self-elasticity in a matrix, as shown in (2) is called price elasticity matrix (PEM).
=
"
p,p f,p
p,f f,f
#
(2)
wherep,f represents the map from past input to future output.
It is usually referred as postponing cross-elasticity which contains all necessary information about the past behavior of the consumer. In particular it contains the information of the past states of an agent that may influence the future states. In the literature, this notion is often called as Markov
property. f,p represents the map of expected future input to
past output. It is usually referred as advancing cross-elasticity which contains the prediction of future behavior of an agent. Network variables (i.e. nvParam) in the functional block of energy elasticity learner are associated with customer prefe-rences. Every nvParam is updated by a customer before the activation of an agent. The most common temporal preferences could be start time and stop time to the agent, which means during a day the agent can start from the given time and must complete its task before the identified time. In this way, it can be inferred that nvParam has a direct influence on PEM.
As the behavior of a reinforcement learning agent is de-termined by its reward function (given in (1)) and algorithm parameters, these must be designed to enable and strengthen the kinds of behaviors desired from the agent. Herein, Q-learning is considered in order to learn the behavior of an agent. The objective of a reinforcement learning agent is determined an optimal actions such that its reward function (given in (1)) is maximized. Learning starts from an arbitrary
initial Q-functionQ0and updates it without requiring a model,
using instead observed state, transitions and rewards, i.e.
(xk, uk, xk+1, rk). After each transition, Q-function is updated
using such a data tuple (xk, uk, xk+1, rk), as follows:
Qk+1(xk, uk) =
(1−αk)Qk(xk, uk) +αk
h
rk+ max
u0 Qk(xk+1, u
0)i (3)
where αk ∈ (0,1] is the learning rate. The term between
square brackets is the temporal difference, i.e., the
diffe-rence between the updated estimate rk + max
u0 Qk(xk+1, u
0)
of the optimal Q-value of (xk, uk), and the current estimate
Qk(xk, uk). As the number of transitions approaches infinity,
Q-learning asymptotically converges to Q provided the state
and action spaces are discrete and finite.
The agent also has to exploit its current knowledge in order to obtain good performance, e.g., by selecting greedy actions in the current Q-function. This is a typical illustration of the exploration-exploitation trade-off in online RL. A classical way to balance exploration with exploitation in Q-learning is
ε-greedy exploration, which selects actions according to:
uk=
(
u∈argmax
u0
Qk(xk, u0) with probability1−εk
a random action with probability εk
(4)
III. PHYSICALIMPLEMENTATION
The proposed functional blocks were implemented in auto-nomic IzoT automation network node. IzoT device stack were based on Raspberry Pi 2 Model B Boards, with 900MHz quad-core ARM processors and 1GB of memory, with an integrated power measurement circuit.
A. Measurement system design
The measurement system was developed by using two analog-to-digital converters (ADC) CS5460 manufactured by CIRRUS LOGIC. It was designed to accurately measure and calculate: Real (True) Energy, Instantaneous Power, current (IRMS), and voltage (VRMS) for single phase 2- or 3-wire power metering applications. In the application it was connected with Raspberry Pi microcontroller by its GPIO (general purpose input/output) pins with SDI, SDO, CLK, GND, CS signals. A schematic diagram of the connections in the mentioned system is presented in Fig. 2. Moreover, authors discussed the details of the measurement design in [14].
B. Finite State Machine
In the phase of logical implementation, a software appli-cation has been developed for the Flexometer, implemented in Raspberry Pi with the IzoT platform stack. The software application provides and supports: (1) communication between CS5460 IC and Raspberry Pi via SPI interface, (2) reading of specific data from the CS5460 , and (3) an application code for control and learning was written in C programming language [11], [12]. Fig. 3 shows finite state machine of the Flexometer, which has 7 states (i.e. configuration parameters and control) and 7 transitions (i.e. network variables). This provides a detail description of an agent in terms of a digital
Fig. 2. A schematic diagram of Flexometer with CS5460 IC and Raspberry Pi microcontroller. 0 1 2 3 4 5 6 c a d g a g f e b b
Fig. 3. Finite state machine of the Flexometer. State 0: customer preference initialization, 1: acquiring data and waiting for control signal, 2: decoding and encoding the received signal, 3: Clearing or overwriting the instant in logger, 4: generating desire control preference (e.g. bid), 5: sending, 6: performs desire action and waits till completion. Transition a: customer preference (i.e. nvParam), b: status, c: received control signal , d: wrong signal, e: decoded signal, f: encoded signal, g: generated control preference (e.g. bid).
logic circuit function at a given instant in time, to which the state circuit or program has access.
C. Knowledge base
The knowledge based ontology of the Flexometer, repre-sents the functional relationship of all blocks within the Flexo-meter, is shown in Fig. 4. It contains descriptions of functional blocks and their actions, as well as reference for calculating state change when a control action (i.e. price signal) is given. Basic customer preferences (i.e. nvParam like start and stop time) are also contained in this ontology. As can be seen in Fig. 4, the logger functional block is associated with customer preference, demand response and learned value proposition.
IV. EVALUATION
In this paper, a hardware-in-loop approach was adapted to conduct an experimentation for the evaluation of the
Flexo-Learner Logger hasPeference Meter Bid Response User nvParam inEnvironment hasPriceSignal affectsVariables containsAppliance forVariables inEnvironment hasAvailibility
Fig. 4. Knowledge based ontology used for representing functional blocks within the Flexometer and their relationships.
meter as an element that supports in the integration of TCM in EMS.
A. Experiment Design
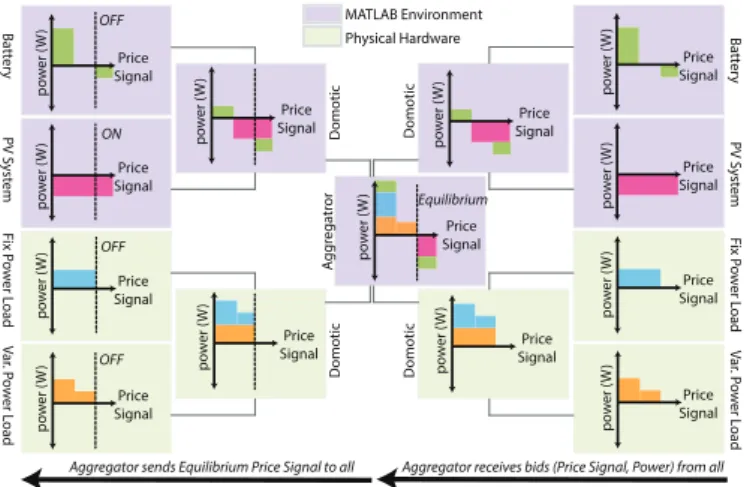
As shown in Fig. 5, the system for the experimentation was designed by implementing multi-agents. In this architectural design, as discussed in [15], multiple agents were responsible to perform their respective tasks. Herein, agents were also organized in triple layers. Agent in most upper layer was called an aggregator agent. The aggregator agent aggregated bids received from domotic agents and then adjusted an equilibrium price signal as per the objective. The most simple objective of the aggregator is to balance supply and demand, which was taken under consideration in this study. As shown in Fig. 5, herein aggregator agent simply broadcasted the price signal corresponding to nearly zero consumption as the equilibrium price signal. po w er ( W ) po w er ( W ) po w er ( W ) po w er ( W ) po w er ( W ) Price Signal Price Signal Price Signal Price Signal Price Signal A g g regatr or po w er ( W ) Price Signal Domotic po w er ( W ) Price Signal Domotic Batt er y PV S y st em F ix P o w er L oad V a r. P o w er L oad Equilibrium MATLAB Environment Physical Hardware po w er ( W ) po w er ( W ) po w er ( W ) po w er ( W ) Price Signal Price Signal Price Signal Price Signal po w er ( W ) Price Signal Domotic po w er ( W ) Price Signal Domotic Batt er y PV S y st em F ix P o w er L oad V a r. P o w er L oad OFF OFF OFF ON
Aggregator receives bids (Price Signal, Power) from all Aggregator sends Equilibrium Price Signal to all
Fig. 5. Three layer multi-agent system for Transactive based control mecha-nism .
On the other hand, domotic agents exist in the middle layer of the organization. Herein, domotic agent worked as a transceiver of bid and price signal between the connected appliance agents and the aggregators.
In this architectural design, appliance agent were representatives of real physical load (like battery, PV system or other loads) to the domotic agent. Therefore, within this framework, “Flexometer” was an appliance agent with digital logic circuit. Therein it provided an opportunity for
the standardized integration of physical load into Transactive based control mechanism.
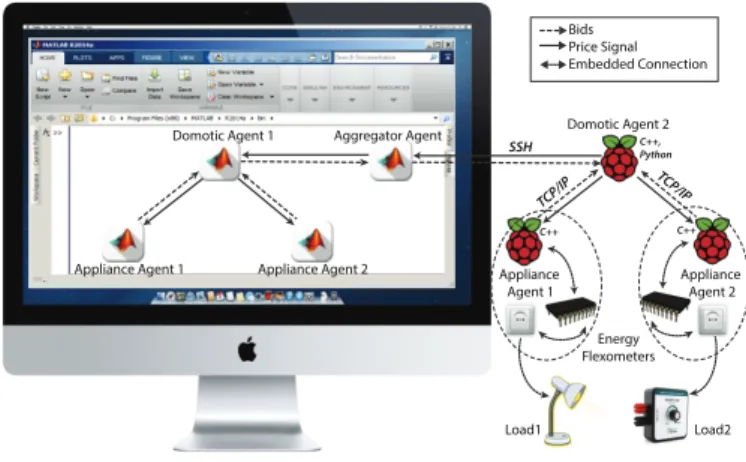
As mentioned, the purpose of this demonstration was to evaluate the Flexometer. So, the demonstration was planned for a time period of a week in the Smart Lab of AGH UST, Krakow - Poland [16]. Moreover, in order to simplify the analysis of data obtained during demonstration, the granularity of an hour was considered. Fig. 6 shows the illustration of lab setup for experimentation. It can be observed from Fig. 6 that an aggregator agent was entirely developed in MATLAB run-time environment. In this experimentation, two domotic agents were designed, one was MATLAB based and other was designed in Raspberry Pi. Python and C++ languages were used to implement the logic of domotic agent in Raspberry Pi.
Domotic Agent 1
Appliance Agent 1 Appliance Agent 2
Aggregator Agent
Appliance Agent 1
Domotic Agent 2
SSH
TCP/IP TCP/IP
C++ C++
C++, Python Bids Price Signal Embedded Connection
Appliance Agent 2
Energy Flexometers
Load1 Load2
Fig. 6. Setup of multi-agent system in Lab.
Moreover, each domotic agent was equipped with two appliance agents. Appliance agents, which were connected to MATLAB based domotic agent, were also modeled in MATLAB, as shown in Fig. 6. Out of two MATLAB based appliance agents; one was modeled as a battery of maximum rated absolute power of 3kW and other was modeled as a PV system of maximum peak power of 2.6 kW. For PV system, local irradiation values of a week in June of 2012 were considered. On the other hand, two Flexometers were imple-mented as per the design presented in Section II. Out of two Flexometers, one was connected to fixed power dummy load of 2kW and other was connected to variable power dummy load (i.e. [min,max] = [0.5kW,4kW]). Variable power dummy load was used to generate variable power profile for a defined time duration (i.e. maximum upto 7 hours). Fig. 7 shows box diagram of the power pattern by variable load for the time period of a week. It also shows the average consumption pattern of the variable load with respect to the time.
Moreover, as two temporal preferences (i.e. nvParam) were introduced as customer preferences, namely start time and stop time. Start time is a time that refers to an hour of a day from when device can be turn on, however stop time is a time that refers an hour of a day till when device must complete its defined task. The mean stop time and start time for fixed load were from 4th hour till 19th hour of the day. On the other
hand, the mean stop time and start variable for fixed load was from 2nd hour till 20th hour of the day. Keeping in mind that the day of the demonstration starts at 9.00AM.
1
2
3
4
5
6
7
0
1
2
3
4
Time (hours)
P
o
w
er (kW
)
Fig. 7. Consumption pattern of variable load verses time i.e. an averaged for a week.
B. Performance Metrics
The performance matrics of Flexometer are training time taken by elasticity learner functional block and response time. When numerically calculating without nvParam for a learning task of elasticity learner programmed in Raspberry Pi 2, the algorithm that runs for 100 episodes should take 8.3s in average. However, table I shows average training time that the elasticity learner of each Flexometer takes in both situations i.e. with nvParams and without nvParams. It can be observed that time taken with nvParam is way lower than without nvParam. It provides an evidence to the fact that nvParam limits the exploration across state space during a training episode, thus allowing agent to converge faster. Moreover, the average response time, i.e. a time duration required to change the status of Flexometer, was found to be 5ms.
TABLE I
AVERAGE TRAINING TIMING WITH AND WITHOUT NVPARAM Without With Flexometer (with variable loading) 13s 7.0s Flexometer (with fixed loading) 4.9s 1.7s
C. Results
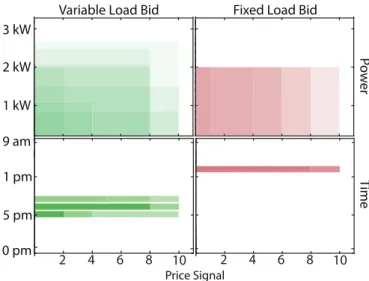
The upper graphs in Fig. 8 and Fig. 9 show bid (i.e. power verses price signal) generated by both Flexometer (variable and fix load) during two different demonstrations i.e. with or with nvParam respectively. Similarly, the lower graphs in Fig. 8 and Fig. 9 show when both Flexometer turn ON verses the respective price signal they received from domotic agent for an action. From Fig. 8, an evident observation is that Flexometers without nvParam turn ON more strictly on time as well as react on high values of price signal. On the other hand, as shown in Fig. 9, Flexometers with nvParam turn ON to relatively lower values of price signal as well as dispersed
more on time. This provides an additional fact that elasticity learner learns more strict bidding in case of without nvParam rather then with nvParam.
2 4 6 8 10
2 4 6 8 10
9 am 1 pm 5 pm 10 pm 3 kW 2 kW 1 kW
P
o
w
e
r
T
ime
Variable Load Bid Fixed Load Bid
Price Signal
Fig. 8. Bid generated without nvParam by Flexometers and their turn ON timings during demonstration with respect to price signals.
2 4 6 8 10
2 4 6 8 10
9 am 1 pm 6 pm 3 kW 2 kW 1 kW
P
o
w
e
r
T
ime
Variable Load Bid Fixed Load Bid
Price Signal
Fig. 9. Bid generated with nvParam by Flexometers and their turn ON timings during demonstration with respect to price signals.
V. CONCLUSION
This paper deploys successfully all six features of an Flexometer in the context of agile demand response. The investigation concludes that the proposed and discussed a logical interface of Flexometer is ready to implement in any IoT platform like multi-agent system for Transactive based control mechanism to materialize agile demand response from elemental level.
Moreover, it also indtroduces different level of data abstraction and information sharing among different agents. For an illustrative purposes, the paper only focuses on a
single parameter, named nvParam. Moreover, two different options of Flexometer were compared (i.e. with and without nvParam). With nvParam in which timings for appliance operation were limited, the energy elasticity functional block learns an optimal schedule of energy and the value of price signal is lower. On the other hand, second option will increase the value of price signal and learn relatively fix time of operation as optimal schedule.
For the future work, we are going to implement the develo-ped solution in a pilot building EMS project with Transactive based control mechanism and monitoring functions. An ap-plication of the Flexometer in prosumers micro-grids EMS is being considered as well.
REFERENCES
[1] K. Kok, “The powermatcher: Smart coordination for the smart electricity grid,”TNO, The Netherlands, pp. 241–250, 2013.
[2] K. Park, Y. Kim, S. Kim, K. Kim, W. Lee, and H. Park, “Building energy management system based on smart grid,” inTelecommunications
Energy Conference (INTELEC), 2011 IEEE 33rd International. IEEE,
2011, pp. 1–4.
[3] E. Klaassen, C. Kobus, J. Frunt, and J. Slootweg, “Responsiveness of residential electricity demand to dynamic tariffs: Experiences from a large field test in the netherlands,”Applied Energy, vol. 183, pp. 1065– 1074, 2016.
[4] J. Mahieu, “Active demand side management,” PhD Dissertation
-published by Hogeschool West-Vlaanderen, 2012.
[5] A. Haytema, “The solution to managing energy supply and demand,”
White Paper by Nedap Energy Systems.
[6] Mastervolt, “Mastervolt, innovative power systems for autonomous use,” http://www.mastervolt.com/IntelliWeb/, 2017, [Online; accessed 10-April-2017].
[7] B. Biegel, P. Andersen, J. Stoustrup, M. B. Madsen, L. H. Hansen, and L. H. Rasmussen, “Aggregation and control of flexible consumers–a real life demonstration,”IFAC Proceedings Volumes, vol. 47, no. 3, pp. 9950–9955, 2014.
[8] C. Yilmaz, S. Albayrak, and M. L¨utzenberger, “Smart grid architectures and the multi-agent system paradigm,”ENERGY, pp. 90–95, 2014. [9] M. Babar, P. Nguyen, V. Cuk, I. Kamphuis, M. Bongaerts, and
Z. Hanzelka, “The evaluation of agile demand response: An applied methodology,”IEEE Transactions on Smart Grid, 2017.
[10] M. Babar, P. Nyugen, V. Cuk, I. R. Kamphuis, M. Bongaerts, and Z. Han-zelka, “The rise of agile demand response: Enabler and foundation for change,”Renewable and Sustainable Energy Reviews, vol. 56, pp. 686– 693, 2016.
[11] A. O˙zadowicz, J. Grela, and M. Babar, “Implementation of a demand elasticity model in the building energy management system,” in Event-based Control, Communication, and Signal Processing (EBCCSP), 2016
Second International Conference on. IEEE, 2016, pp. 1–4.
[12] A. Ozadowicz and J. Grela, “An event-driven building energy mana-gement system enabling active demand side manamana-gement,” in 2016 International Conference on Event-based Control, Communication, and
Signal Processing (EBCCSP), 2016, pp. 1–8.
[13] M. Babar, P. Nguyen, V. Cuk, and I. Kamphuis, “The development of demand elasticity model for demand response in the retail market environment,” inPowerTech, 2015 IEEE Eindhoven. IEEE, 2015, pp. 1–6.
[14] A. O˙zadowicz and J. Grela, “Control application for internet of things energy metera key part of integrated building energy management system,” inEmerging Technologies & Factory Automation (ETFA), 2015
IEEE 20th Conference on. IEEE, 2015, pp. 1–4.
[15] M. Babar, P. Nguyen, V. Cuk, I. Kamphuis, and W. Kling, “Complex bid model and strategy for dispatchable loads in real time market-based demand response,” inIEEE PES Innovative Smart Grid Technologies,
Europe. IEEE, 2014, pp. 1–5.
[16] M. Noga, A. O˙zadowicz, and J. Grela, “Modern, certified building auto-mation laboratories autbudnet–put learning by doingidea into practice,”