ROBERT HTTZIG. An Evaluation of Leaf spot Advisory and Integrated Pest
Management Adoption Among Peanut Farmers in Northampton County, North Carolina
(Under the direction of MORRIS SHIFFMAN and JACK BAILEY).
Leafspot advisory (LSA) is an integrated pest management (IPM) strategy designed
to reduce the number of sprays necessary to control the spread of the peanut leafspotting
pathogen, Cercospora arachidicola. It is in use in nine North Carolina counties and has
been used in Northampton County since 1983. Thirty-one peanut farmers were
11
Contents
Abstract ...i
Contents ...ii
List of Figures ...iu
Introduction... 1
Background Information ...1
Goals and Objectives ...5
Literature Review ...6
Materials and Methods ...11
Results ...13
Discussion...18
Sources of Error ... 18
Associations of Farmer Characteristics with LSA Use . 20
Data Analysis ...31
General Recommendations ...34
Recommendations for Further Study... 37
Conclusions ... 39
References... 42
Appendix ...44
Data Tables ... 44
Farmers Combined ...44
LSA Non-users ... 46
LSA Users ...47
Ill
JAst of Figures
1) Graph to Determine Infection Rate Index for Each 24-Hour Period
2) Farmer and Farm Characteristics
LSA Users vs. Non-users
3) Source of LSA Information
Entire Population
4) Source of LSA Information
For Users and Non-users
5) Rate of LSA Acceptance
in percent of county farmers
6) Level of Pesticide Concems
Users and Non-users
Introduction
Background Information:
Peanut leafspot is the common name for a foliar diseases caused by two species of
fungi (Cercospora arachidicola and Cerosporidium personatum) which occur wherever
peanuts are grown extensively (Jensen and Boyle 1965). It is a major disease that can affect
peanut yields dramatically and reduction in yields may occur despite efforts to control the
disease by spraying with fungicides (Jensen and Boyle 1966). Farmers had known for
years that the occurance of leafspot varied in severity from year to year, in some years there
would be a need to spray six to eight times, in other years no sprays would be needed to prevent the loss of yield. Because of these inconsistencies in leafspot proliferation, the
traditional recommendation was to start spraying the last week in June and every two
weeks thereafter (Bailey 1987). Some fungicides used for protection from leafspot,
however, have become ineffective as the fungus has become resistant to them. This
resistance is common with certain pesticides; as of 1983, there were 98 plant pathogens
resistant to chemical controls (Georghiou and Mellon 1983). In the 1950's copper sulfur
was used as the first commercial fungicide for peanut leafspot control. It was replaced in the late 1960's by the much more effective Benlate, the first systemic fungicide on the market; resistance developed, however, by the early 1970's, leaving Chlorothalonil (marketed as Bravo) as the top selling fungicide in North Carolina (Bailey 1987). The length of time before resistance to it sets in is not known, and may not occur.
Jensen and Boyle (1965), were more forward looking than many of their
contemporaries. They believed that a greater need existed to understand the epidemiology
of the disease. Toward this end, they researched and reported on the relationship of
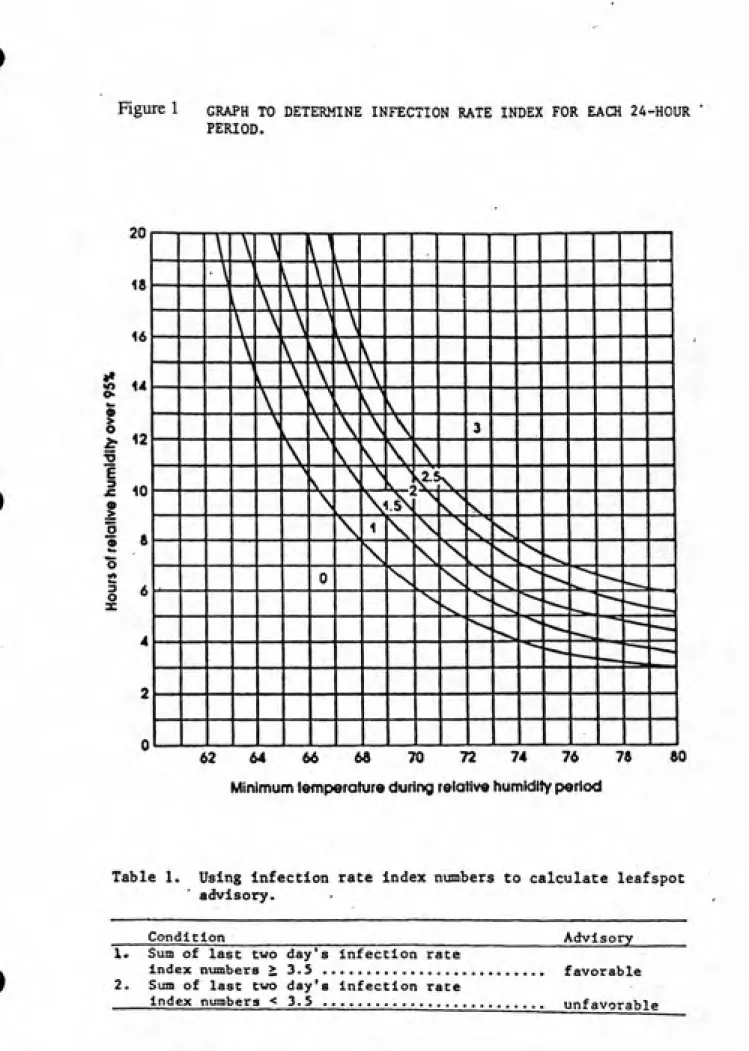
leafspot growth to specific weather conditions. With this information Jensen and Boyle
was at or above 95%, the higher the temperature, the faster leaf spot grew. Conversely,
when conditions were such that condensation of moisture did not form on the leaves
(below 95%) leafspot failed to occur, regardless of the temperature. By examining more closely the growth of the disease under high humidity conditions with varying temperature and time, they were able to create a graph that continues to be used in determining spray
schedules (Figure 1; from Bailey 1987). To use the graph, a farmer must keep a record of
weather conditions (hours of humidity over 95% and the minimum temperature at that time). The farmer must then translate that data into a corresponding number on the graph. Conditions are said to be favorable for leafspot infection if the sum of these numbers for the previous two days is greater than or equal to 3.5. If the sum is less than 3.5,
conditions are said to be unfavorable (Bailey 1987). Farmers would spray to cotrol
leafspot each time favorable weather occurs, but not more often than every 10 days. This system is designed to determine appropriate conditions for spraying, which may reduce the frequency of leafspot. To benefit from the system, however, the farmer has more responsibility to be an effective manager. There is a risk, with this system, of a peanut leafspot outbreak occurring because microclimate conditions in the field differ from
those at the weather monitoring box. The farmer must, therefore, rely more heavily on the
use of scouting techniques to determine the level of disease in the fields. A farmer using
this system must, furthermore, understand the disease at a much deeper level than most
farmers who use the calendar schedule (i.e. spray preventatively every 14 days). Increased
knowledge is necessary not only for interpreting favorable and unfavorable conditions, but
Figure 1 GRAPH TO DETERMINE INFECTION RATE INDEX FOR EACH 24-HOUR PERIOD. > o i-E 3 JZ 9 > O o 3 O X
\n M
1. M i m\K
1 K\ \\
u \ \H M
\ UNn
1. 1 rN Mm
^ i>hi
r > NNKh M
N hN^i
,j K M i KJ
M S Nh i >J
. IH' NK >N
IN
KH^rsH-4 1 1 iJSW&stL
J 1 1 1 1 1 1 1 1 1 1 1 iHJ rs-J ItH
ft I____I—1—1___1—1—1—I—I—1—1—1—1—1—1—1—L—1—1—1—1
62 64 66 6a 70 72 74 76 78
Minimum temperature during relative ttumidity period
60
Table 1. Using infection rate index numbers to calculate leafspot
advisory.
Condition Advisory
1. 2.
Sum of last two day's infection rate
index numbers > 3.5 ...
Sum of last two day's infection race
index numbers < 3.5 ...
favorable
offices collect information from either hygrothermographs (continuous mechanical
recorders of temperature and humidity) or weather boxes (microcomputers) set up around the county; four stations per county are recommended because of weather variances. The office then interprets the information and advises the farmers in it's county. Because of the
need for the farmers to receive information rapidly, the advisories are dispatched over television, radio, and/or telephone (Bailey 1987).
LSA has been operating in Northampton county since 1983. The weather data is
collected in six weather boxes which are used to determine whether to warn farmers of
favorable or unfavorable conditions for disease in that area.
LSA benefits extend far beyond the money the farmer saves in reduced sprays; they also may enhance the number of years the pesticide can be used without pathogen
resistance developing (Brattsten et al 1986) and reduce numerous environmental and health
risks associated with heavy use of these chemicals (such as fish and wildlife
contamination, ground and surface water pollution, livestock contamination, and human exposure) (Pimentel et al 1980). LSA attempts to reduce the use of pesticides to a level that is minimal for the commercial production of peanuts using knowledge of the pathogen and efficient management of the farm. LSA can therefore be classified as one strategy in an
integrated pest management (IPM) program. This is a progressive form of pest
Goals and Objectives:
The primary goal of this study is to assess the level of farmer acceptance of leafspot
advisory into their farming practices in Northampton County.
Other objectives are:
1) To determine the level of the farmers understanding of IPM.
2)To assess their understanding of the relationship of IPM to LS A.
3) To understand the factors that influence adoption of pest management
innovations such as IPM and LS A.
4) To assess the effectiveness of the LS A.
5) To find the level of farmer satisfaction and dependence on LS A.
6) To find out how the farmers that use LS A differed from those who do not.
7) To understand why or why not IPM and LSA were effectively being
implemented.
LSA is considered to be a small window on the larger aspect of pesticide
management offered by IPM. Leafspot advisory is treated as a specific test area to
formulate understanding on how IPM can be implemented. The underlying goals of this
research are based on an IPM in an environmental context, and as such it seeks to
Literature Review
A review of the Uterature reveals that, although there has been extensive research in
determining the effectiveness of individual methods of IPM control, researchers have not
given equal priority to evaluating the level of implementation of these programs. This is a
problem because it is difficult to judge what measures need to be taken in the future in order
to obtain the benefits that go along with IPM programs. These benefits include improved
profitability of the farm, improved environmental quality, and lower human health risk.
Economic evaluations of IPM programs have shown a substantial increase in the farmer's
income and lower environmental stress, both on individual farms and across regions
(Frisbie 1985). It is, however, widely believed that farmers do not accept or use IPM as
extensively as they could (Miller 1983).
Kirby and Main, in a 1980-81 study (unpublished), compared 82 randomly selected
tobacco farmers with 84 tobacco farmers involved in extension-supported IPM programs in
eight North Carolina counties to determine the differences in farming practices and pest
management. The research revealed that the IPM group was younger, had less years
experience farming, but had larger farms than the non-IPM group. Both groups were
equally educated with ahnost 12 years average education level. Kirby and Main concluded
that because larger farms require more capital investment, labor, and equipment, these
farmers may be more wiUing to relegate pest control responsibilities to pest management
A 1985 evaluation of apple EPM programs (Whalon and Weddle 1985) found that
over 40 percent of the apple acreage in the 15 leading apple producing states was under
some type of IPM monitoring system. Another section of the study surveyed agricultural
researchers and speciaUsts. Of the total survey responses (93), 56 percent of the
respondents said that IPM saved growers money, 32 percent said they did not know
whether IPM saved money or not, and 2 percent believed that IPM did not save money.
Ten percent of the respondents did not answer this section. Of those that thought that IPM
saved growers money, most estimated that the savings ranged between $26-50 per acre in
chemical costs alone.
The most comprehensive study, both in scope and range is The National Evaluation
of Extension's Integrated Pest Management Programs (Virginia Cooperative Extension
Service 1987). It surveys the major groups of people responsible for IPM implementation
(extension personnel, farmers, and private pest management consultant firms) for ten
commodities in twelve areas nation-wide. One commodity was studied in each area. For
example, in the Northwest, alfalfa seed production was looked at, in CaUfomia, almonds
were the commodity to be studied. This study is the most complete and current source of
information dealing with the national implementation of IPM.
One aspect this study explored was farmer demographics. The majority of farmers
were found to be in excess of 50 years old. This was explained by the sociology of family
fanning in which the farm operations that are inherited do not pass on to the younger
generation until the current head of farm management retires. The majority of farmers
surveyed were white males; only in Maryland where suburban/urban IPM practices were
looked at were there a significant number of women. Significant numbers of blacks were
found in three states; and only in Texas cotton production was Hispanic representation
Demographics of farmers using IPM were also compared against the non-user. The
study found a larger percentage of the users to be under 50 years old in most states.
However, in Maryland it was the other way around and in Kentucky (stored grains), Texas
(cotton), and North Carolina (tobacco) no significant difference was revealed. A greater
fraction of IPM users than non-users had some college education. The study revealed no
difference in New York (apples) and Massachusetts (apples) and opposite results in North
Carolina. A greater fraction of farmers with less than 30 years of farm experience were
using IPM but no difference was found in Texas and North Carohna. In the four states
where a significant number of minority farmers were surveyed (Mississippi (cotton),
Texas, Georgia (peanuts), and Virginia (soybeans)) the percentage of IPM users that were
white was substantially higher than the percentage of non-users that were white. This
study goes on to explain that there are many possible causes for these differences in ethnic
distribution, age, education, and overall farming experience between the IPM user and
non-user. A very potent factor, however, must be that most states have an expressed goal of
getting large percentages of the target commodity acreage into IPM programs. To meet this
goal, the county extension services focus their educational efforts upon either large farmers
or innovative growers. Both of these groups tend to be what Rogers (1983) calls
innovative individuals, sharing such traits as more years of education, higher social status,
larger farms, a more favorable attitude towards credit, and a commercial (rather than
subsistence) economic orientation. Therefore, it is hard to discriminate as to which factor
is the major cause of these imbalances.
Another important aspect in farmer adoption of IPM, which the VCES study
ranking was the same. The order was as follows: 1) improved pest control, 2) reduced
financial costs, 3) reduced risk of output loss, 4) reduced chemical use, 5) the wish to
improve the environment, and finally 6) to improve on-farm health and safety. Although extension agents gave a high rating for all of these factors, the ratings dropped for each factor when asked for the perceived reason for implementation. A different question was
asked directly to the farmers in the study groups. The most important selling points of EPM
were not ranked but included personal health and safety, improved pest control, decreased
use of pesticides, improved crop yield and quality, increased return to management, and
concern with environmental improvement. Although the extension agents were able to rank
clearly the perceived reasons for adoption, the farmers were much less definite as to which
was the most important. In fact, improved environmental concems, which was ranked
lowest by the extension agents, was equally ranked with most other factors as a selling
point by the farmers. Of all the farmers surveyed, 5.1 percent said they had previously used IPM, but quit. The most important reasons that they gave were a) they believed it cost
to much, b) they were uncertain if it worked, c) they believed it to be too much trouble, and
d) some farmers no longer had access to an organized program.
The survey of farmer pest management practices did not reveal complete support for IPM in aU farming communities. It did, however, show that the most basic of the variety
of IPM practices, that of scouting for pests, has become an established part of farming for
most commodities. In all twelve case study areas, greater than 50 percent of the
respondents scouted at least some of their acreage. Moreover, in six states ~
have difficulty in getting adopted by farmers, they may still widely accept and rely upon
one part of a program.
When the farmers were asked what means they most preferred for receiving new
IPM information, they listed extension publications, one-on-one meetings with extension
personnel, and production meetings as most helpful. Similarly, extension agents reported
that they felt the most effective methods of communicating this information were
newsletters, telephone, and all forms of face-to-face contact.
These three studies are important as references with which to compare this current
study. They are rare examples of studies that look at farmer adoption of new pest
management strategies. Thus, the degree of agreement or refutation between the present
study and those just reviewed is necessarily significant in the understanding of pest
Materials and Methods
The LSA program in Northampton County was selected for evaluation in February
1988 because it was one of the first counties in North Carolina to adopt LSA as a part of its
agricultural extension program. It was assumed that in this county the value of the LSA program could be judged fairly. In order to obtain a random sample of peanut farmers in this area, the Northampton County Agricultural Stabihzation and Conservation Service
(ASCS) was contacted and asked to provide the names, addresses, and telephone numbers
of every nth farmer from an alphabetical list, where n equals the total number of farmers in
the county divided by the number of farmers required for the study (a sample of 50 farmers
was requested, 42 names were given). Starting with the first name on the list, every
eleventh name was chosen. Two of these people did not have telephones so the
questionnaires were mailed to them, the rest were interviewed over the telephone. These
conversations lasted on average between 5 and 15 minutes. All telephone interviews were
conducted in evening hours between March 26 and April 10,1988. Of the 42 farmer
names that were obtained, two refused to be interviewed, one did and another did not
return their mailed questionnaire, five said they were no longer farming, two had disconnected phones, one rents his land out and could not answer the questions. The
remaining thirty were successfully interviewed over the telephone.
The survey asked a total of twenty-seven multiple choice and short answer
questions that were based on their judgement and knowledge. The questions were divided
into four categories, including information about the farmer and the farm, the farmer's use and knowledge of IPM, the farmer's use and knowledge of LSA, and the farmer's fears about pesticides. The first five interviews were used as a pretest. When no significant
difficulties were revealed by these interviews, they were included with the rest of the
respondents.
The data was placed on Lotus spread sheets from which both graphs and statistical
analysis were done. When a numerical range was given as an answer to a question, the
average was used in the analysis. Numerical values were assigned to answers about a
farmer's level of fear for the potential harmful effects of pesticides. A point value of two
was given for an answer of "very worried", a point value of one was assigned for an
answer of "somewhat worried", and a point value of zero was given for an answer of "not
worried at all".
The statistical analysis was done either by using those already available in the
program or by entering equations to it. Because the sample size included only 31
individuals, the small sample t-test was used to determine the level of statistical significance
between means. The assumptions made in order to conduct a valid test include having an
independent random sample of size n, and two normally distributed populations with
variances that are unknown and possibly unequal. The chi-square test was used to
determine the level of statistical significance between frequencies; the assumptions include
having a random sample of size n, and the classifications are mutually exclusive and
Results
How many acres of peanuts do you have on your farm?
Average: 86.21
LSAuser: 115.25 / 69% of total acreage
Non-user: 55.23
Significant difference with alpha = .05
How many years have you been farming?
Average: 24.90
LSAuser: 22.19
Non-user: 27.80
Not a significant difference with alpha = .20
How many crops do you grow in an average year?
Average: 3.77
LSA user: 4.38 Non-user: 3.13
Significant difference with alpha = .001
May I ask what your age is? Average: 50.83
LSA user: 47.06 Non-user: 55.14
Significant difference with alpha = .10
Can you tell me what the last grade that you completed was?
Average: 11.68
LSAuser: 13.19
Non-user: 10.06
Significant difference with alpha = .02
Have you ever heard of the practice of integrated pest management, that is IPM?
Average: 13 of 31,41.94%
LSA users: 10 of 16, 62.50% Non-users: 3 of 15, 20%
Significant difference with alpha = .05
Which of these would you say comes closest to what IPM means to you:
a) Taking occasional nematode and soil samples.
(1 of 13, a LSA user)
b) Treating fields according to scouting information, including nematode samples. (Correct
answer)
(11 of 13)
c) Taking advice from knowledgeable people,
(lof 13, aLSAuser)
d) Other (Oof 13)
Are you using IPM?
Yes
LSA users: 9 of 10 Non-users: 1 of 3
Significant difference with alpha = .05
What do you think of it? Various responses include:
Farmer #8 ~ "Over all beneficial, higher yields, lower costs, keeps beneficial insects." Farmer #14 ~ "Lots of success with it, doesn't just spray all the time, saves beneficial
insects."
Farmer #22 ~ "Very good program, saves money in pesticides, no differences in yield."
Farmer #27 — "Using for four or five years, saves money."
Farmer #28 — "It is a practical approach to pest management, saves money, consultants
stay on safe side."
Have you ever heard of the weather-based program for the timing of fungicide sprays
called leafspot advisory?
Yes
Total: 70.97%, 22 of 31 LSA users: 100%, 16 of 16 Non-users: 40%, 6 of 15
Did you hear about leafspot advisory from:
a) Personal contact with the agricultural extension agents.
64%, 14 of 22
b) County production meetings. 9%, 2 of 22
c) Chemical sales representatives.
4.5%, 1 of 22
d) Other farmers.
e) Radio, newspapers, or TV; that is the mass media.
18%, 4 of 22
f) Other 4.5%, lof22
Would you classify leafspot advisory as an integrated pest management strategy?
Yes
11 of 11
Have you ever tried leafspot advisories?
Yes 16 of 22
In what year did you first try leafspot advisories?
1983:1
1984: 6 1985:5 1986: 3
1987:1
Are you presendy using them (leafspot advisories)?
Yes: 16 of 31
Do you plan to use them in the future?
Yes: 17 of 31
How often do you follow the advise?
(Would you say most of the time / half the time / seldom)
75-100%: 13 of 16(81.25%) 25-75%: 3 of 16(18.75%)
0-25%: 0 of 16
Do you feel this program has saved you money; about how much per acre?
Minimum: 1 spray/acre/year Average: 2.44 sprays/acre/year Maximum: 7 sprays/acre/year
Most farmers where not able to give the information in dollars/acre, but the ones that did
estimated that the each spray cost between $5 and $12; all farmers gave information as to
how many sprays were saved per year. Was the money saved by:
Fewer sprays: 10 of 16 (62.50%)
Higher yield: 0
Both: 6 of 16 (37.5%)
Other: 0
For the next series of questions, the total 'point value' was calculated by allocating
two points for answers of 'very worried', one point for answers of 'somewhat worried',
and zero points for answers of 'not worried at all'. All the other numbers represent the
number of responses for each category.
How worried are you about the affect of pesticides on your personal health? Would you
say:
LSA users: Non-users
Very worried: 3 2 1
Somewhat worried: 10 5 5 Not worried at all: 18 9 9
Total point value: 16 9 7
Comments:
Farmer #1: Poisoned once.
How worried are you about the affect of pesticides on your family? Would you say:
Very worried: 3
Somewhat worried: 7 Not worried at aU: 21
Total point value: 13
LSA users: Non-users
2 1
5 2
9 12
9 4
e Jiffect of pesticides on y
LSA users: Non-users
2 1
7 4
7 13
11 6
Very worried: 3
Somewhat worried: 11 Not worried at all: 20
Total point value: 17
Comments:
Farmer #17: Controls run-off.
Farmer #23: Already ruined it.
How worried are you about the affect of pesticides on your livestock? Would you say:
Very worried: 3
Somewhat worried: 3 Not worried at all: 10 Don't have livestock: 15
Total point value: 9
Comments:
LSA users: Non-users:
2 1
1 2
3 7
10 5
Farmer #29: It makes them lose weight.
How worried are you about the affect of pesticides on fish and wildlife? Would you say:
LSA users: Non-users:
Very worried: 4 2 2
Somewhat worried: 13 7 6
Not worried at all: 14 7 7
Total point value: 21 11 10
Comments:
Farmer #7: Doesn't use potent stuff, even if it costs more not to.
Farmer #8: Wants to use pesticide that is least harmful to wildlife.
Farmer #10: Seen wildlife come back since DDT was banned.
The last series of questions is divided into two categories ~ personal effects (all the
questions minus the "fish and wildlife") and external effects, each response is assigned a point value (very worried = 2; somewhat worried = 1; not worried at all = 0), and the
respondents using LSA are added separate from the non-users and then averaged (excluding responses to the "livestock" question), then:
Personal Worried Rank: LSA user: 1.75
Non-user: 1.06
No significant difference with alpha = .20
Extemal Worried Rank: LSA user: .69
Non-user: .70
Discussion
Sources of Error:
Because the survey asked only for acres of peanuts farmed without inquiring about
the total acres of land farmed, an important piece of information may have been lacking in determining the type of farms involved in LS A usage. This study shows that Northampton County farmers who are using LS A plant a greater variety of crops. Therefore, the data that show that peanut acres farmed on farms using LSA are larger than those of non-users may indicate an underestimation of the difference between the two groups in regard to farm
value and farmer wealth. Unfortunately, this conclusion can only be hypothesized through
extrapolation of data and not interpreted from concrete information.
Moreover, farmers may have interpreted differently question number two, "How
many years have you been farming?" Some may have answered how long they have owned their own farm while others may have answered how long they have been involved with farming, including working for their father at a very young age.
Two farmers (both starred (*) on the spread sheet) who were actively using IPM with the help of hired consultants denied using LSA. Regardless of whether the
consultants refer to the advisories with the farmers' knowledge or not, these farmers are
likely to be deriving the same benefits that are acquired from LSA. Because these farmers
were counted in the non-user group, several factors, including the percentage of land under
LSA management, may be underestimated.
Question number ten, regarding whether or not the farmer believed LSA to be an IPM strategy, may have hinted at the correct answer. All nine of the farmers who qualified to be asked this question answered in the affirmative; this data should be interpreted with
There were several problems with questions 21 through 25 that dealt with fears of the harmful effects of pesticide use; first of all, farmers tended to answer them from
different perspectives. Several farmers saw the questions as a threat, perhaps fearing that
any admission of harmful effects would lead to further government regulation of useful pesticides. In these cases anger that the questions were being asked was often evident
Some seemed very skeptical of the intent of the survey and were very hesitant to answer. A couple of farmers who had had disastrous experiences with pesticides in the past were a
lot more worried than farmers who had avoided such occurrences. Some farmers who
were concerned about the effects and knew how to take precautions were not worried
because they felt secure in what they had done, however, many of them were much more worried about the people who did not know what they were doing. Others who were knowledgeable and took appropriate precautions answered with a high degree of worry
anyway.
Further problems with the questions arose because they were inappropriate in particular cases. One farmer did not have a family about which he could worry and a couple of farmers did not live on the farm. Some farm water supplies did not come from wells, but were instead provided by the county. Consequently, these farmers were less worried about contamination of the drinking water.
Associations of Farmer Characteristics with LS A Use:
A high education level was strongly associated with LSA use (Figure 2).
Apparently this is a common finding in diffusion of innovation research ~ Rogers (1983),
in examining over 200 papers that looked at the characteristics of adopters of innovation,
found that over 70 percent of the time adopters had higher education levels. The National
Evaluation of Extension's Integrated Pest Management Programs (1987) was in agreement
with these findings. In contrast, Kirby and Main (unpublished) found no association. One
would assume literacy, as an indicator of education, would have a part to play in an
individual's wilUngness to try a new innovation. Illiteracy brings more risk to changes
because if one cannot read, one feels less secure that if something goes wrong he/she will
be able to find the information to correct it. In addition, when one cannot read there is
added pressure to memorize everything. This is perhaps why Rogers (1983) found that UUteracy was more commonly associated with the non-innovative group. Although
ilhteracy was not measured in this study, it may have been a problem in this community ~
seven farmers had not completed the ninth grade, six of which were in the non-user group. Regardless of whether literacy was the specific problem among the farmers,
however, the lack of basic education definitely influenced those who did not adopt LS A. Almost a third of the farmers had not finished high school, eighty percent of which were in
the non-user group. Moreover, only one farmer with an advanced education past high
school (out of ten) had never heard of the advisory, and the only highly educated farmer
that had heard of LSA but had not switched had already employed outside consultants to
help with pest management. Even so, the reasons why education past high school plays a role in innovation adoption are complicated. First, education gives people access and exposure to more information; second, it may make people more accepting of new ideas; and last, education may be symbolic of a desire to further one's knowledge and better one's
self. In this way education may simply be an indicator of an open and curious individual
who would have been accepting new ideas anyway.
The average age of the farmers was also found to be significantly different in the two groups, with the non-users being — on average ~ around eight years older (Figure 2). This is in agreement with the findings of Kirby and Main (unpubHshed) and The National
> c
•
3
>
o
-I
a
Id
> z
o 3
I
c •
o o •o z o
K
_\
/
/
to
it only agrees with half of the studies that Rogers (1983) looked at. Rogers found that with
innovations in general, there was no association between age and adoption. It is, however,
difficult to separate this variable from education because most of the farmers with less than
a high school education were also older; seven of the ten who had completed less than twelve years of school were 52 or older. Without a significant number of matching pairs of farmers from similar educational backgrounds, of different ages, who had heard of LSA, it would be difficult to determine how important a farmer's age is in his/her willingness to adopt this new management style. One would suspect, though, that with increasing age, farmers would be more conservative and continue practices they had employed in the past rather than risk loss resulting fi-om trying new methods that are unproven to them. This hypothesis, however, could not be adequately tested in this study.
This study also found that there was an association between LSA usage and larger
than average numbers of acres devoted to peanut cultivation ~ in agreement with aU three of
the studies mentioned above (Figure 2). This correlation may be explained by a
combination of factors. First, the more land that one is responsible for maintaining, the more incentive there is for keeping in touch with the agricultural extension agent and
incorporating the latest profit enhancing technologies. Failure to do this can mean large
monetary losses. When farming 300 acres, a few doUars an acre saved a year is
significant. Second, the more educated farmers typically have the larger farms, which also
adds to the difference because people with more education not only have greater access to information, but also a greater ability to find and use it. And last, Rogers (1983) found that
people with more extensive educational backgrounds had more respect for empirical
Education may again play a role in explaining the reasons for the association of a
greater crop diversity among LSA users than non-users (Figure 2). Literacy would
certainly be a limiting factor in the large scale cultivation of many crops ~ the more plants
produced, the more information that must be stored, either in one's brain or in books; thus,
it is much easier when growing many crops to store the information in books and look it up
when needed. Literate farmers, therefore, enjoy a great advantage. Another limiting factor
in crop diversity ~ when large, expensive machinery is used ~ is the total amount of farm
land. When using expensive farm equipment it is not economical to grow many different
crops on small plots. Rather, farmers prefer larger plots of land. The farmer with less land
would, therefore, grow fewer crops than the farmer with more, even though the plot of the
same crop for both farmers may be equal in size. Unfortunately, data on the total size of
the farms was not collected, so this theory cannot be tested with this sample.
It is not surprising that a knowledge of IPM was found to be more common among
LSA users because LSA is an important strategy for a complete peanut IPM program. It is
surprising, however, to find farmers that use IPM but do not use or simply have not heard
of LSA. The one farmer in this study who uses IPM and has heard of LSA said he hired
outside consultants to help with pest management, and apparently did not see a need to
consult the advisories. The consultants, however, may or may not use the advisories
without the farmers knowledge.
The data also indicates how important the agricultural extension agents are in promoting new farm management technologies (Figure 3). Almost two thirds of the people who had heard of LSA, learned of it from this source. Moreover, of the farmers using LSA, 75 percent named the extension agents as their source of information for LSA. Only two farmers heard about LSA from these agents without adopting it (Figure 4).
9
E
o
L.
9
E
3
z
Figures SovcrcB of LSA Information
For Entire Populotlon
1 D
^ A. —
13
-^^^^
12 -
y/y/V
11
-vvv//
10 - X y y y y
9
8
7
6
5
-A
3
-P
ͣ
i.
i^
^
M
u.
9
0
«
E
3
z
Figure4 Soxtrce of LSA Information
For Users end Non—users
13
12 H 11
10
9
8
7
6
5
-4
3 H
2
1 -{
/\
ͣ
^
so <s
V.
2.
County Prod. Meeting Mass Media Chemical Sales Rep
Source of LSA lnfornr>otlon
[771 LSA Users
Ext. Agent
|\\| LSA Non-us«rs
One interesting observation is that the rate of new LSA users joining the program
has followed an approximation to an S-shaped curve, the shape common in most rate of
adoption analyses (Rogers 1983). Few farmers started to use it the first year (1983), but
the second year showed the largest increase of new users, the third year quite a few joined
but still less than the year before, the fourth year fewer joined, and the last year most
farmers who wished to use it already were, with the rest seeing no need or not knowing
about it (Figure 5). Only one farmer said that he planned to start using the advisories for
the 1988 growing season.
Although the LSA users indicated that they were more worried than the non-users
in every category, the level at which they worried about the health and safety effects of
pesticides did not contrast significandy in any way. Farmers in either category, however,
placed different priority on each of their concerns. For the users, the primary concern was
by far for livestock (of those that had Uvestock). Second, there was an equal concern for
fish and wildUfe and the farm water supply. And last, the LSA farmers worried least about
health and safety for themselves and their famiUes. For the non-users the primary concern
was for fish and wildlife, second was for their own health and safety, concern for their
livestock (for those that had livestock) was third, concern for their water supply was
fourth, and they worried least about the health and safety of their family (Figure 6).
Together, the
entire farmer community, on average, showed the most concern for the effects of the
pesticides on fish and wildlife, and fears of the effects on their livestock were second
(Figure 7). Farmers were apparently least concerned about how pesticides on the farm
might affect their family, perhaps because they are further removed from the farm than the
Figure6 Levels of Pesticide Concerns
CNl
X o
9 y c o
o > 9
9
o
9 >
<
0.9
0.8
0.7
-0.6
0.5
-0.4
0.3
0.2
0.1
-z\
Users and Non—users
Fomlly Livestock Water Supply Environment
Potentlol Torget Area of Pesticide
0
><
o
E
c
L.
9 O c o
o
» > _l 9
O
L.
>
Figure? Levels of Pesticide Concerns
For Entire Population
u. / —
///^
^A
0.6
-1
fi
Wy
0.5
-M
0.4
-p
///
0.3
-k
^
^^
V
1
0.2
-^
M^A
i
id
0.1 -
Y/a
yTAV
, ͣ^
^
W//,
%
///
:^^^
V/.
^
//A
o
One might conclude several things fi'om these findings. First, farmers are aware of
the harmful effects of pesticides on the environment and they are apparently concerned
about it. Consequently, in promoting other IPM strategies, emphasizing the beneficial
effects of the new method on fish and wildlife should not be neglected. Second, although
farmers are aware that their livelihoods are intricately tied to the use of pesticides, it seems
they also have many fears and concerns for how these chemicals might adversely affect
them. Third, there may be a relation between the level of pesticide concerns and the use of
a pesticide reducing strategy, but the correlation was too small to show significance in this
study. Hence, further research with a larger sample size may be needed.
Data Analysis:
The data of this survey show, surprisingly, that only a handful of farmers in
Northampton County, mostly college educated, have knowledge of integrated pest
management, in spite of its twenty year history of enthusiastic promotion from both
academics and media.
Regardless of the slow spread of this new concept in farm management,
Northampton County farmers have widely accepted a single strategy of an IPM program,
leafspot advisory. In the five years since it was introduced, over half the peanut farmers
say they rely on it often. Still it is the farmer with an above average education that has
adopted it as one of the daily management decisions for controlling leafspot. Because there
is such a dramatic difference in the acceptance of IPM in fuU,
in contrast to the acceptance of only one part of an IPM program, LS A, the reasons for its
success should be carefully examined in hopes of increasing the acceptance of other
methods.
One of the most important factors may be the simplicity and ease by which one can
adjust to a singular new management technique as opposed to changing every aspect of
farm practices. The problem with IPM adoption may be that it asks the farmer to change
everything at once. It calls on the farmer to adopt completely different practices and it
demands the use of different schedules and techniques each additional year. Moreover,
IPM calls on the farmer to be more knowledgeable, think more, and remain flexible. For
most farmers to make this transition, outside consultants are often needed ~ something
many farmers may view as too costly and unnecessary when practices they have used for
years still work. As a result, farmers may find IPM too demanding to accept as a package.
Comparatively, LS A is only a small adjustment for farmers to make. A farmer can
leam how to use it in a matter of hours and it does not require paid consultants to help with
management decisions. Although it does take more time to scout the fields and check the
advisory, a net amount of time would be saved if the farmers do the spraying themselves,
thus, it should have an added appeal for small farmers.
The significant reliance of the farmers of Northampton County on LS A has resulted
in a dramatic windfall for them and the county as a whole. It has proved to be extremely
beneficial for its users in pesticide financial savings. Although savings will fluctuate from
farm to farm and year to year, farmers in this county have found that they average about a
$20/acre/year savings with a maximum of $72/acre/year. With just over half of the farmers
in the county using it, the net increase in profit, area wide, is in the range of $425,0001,
not including the additional money that may be made if use of the advisory helps to increase
1 This number is calculated by the following formula:
$20/acre/year x 33/42 (the ratio of farms in the county that are operating
verses the number the ACSC believes to be operating) x 455 farms (the number
of farms the ACSC has recorded for the county) x 115.25 acres (the average
peanut acreage of the LSA user) x 16/31 (the ratio of farmers using LSA) =
yields, as it has with some farmers. This amount of money can easily mean the difference
between taking a loss and making a profit. LSA, therefore, may be an important program
in helping small farmers stay in business. Although the data was not collected in regard to
the far reaching effects of LSA, the benefits county-wide might be felt not only in an
increased tax base, but also in the lower environmental exposure to pesticides.
The disadvantages of LSA usage, and the factors that may play a part in its lack of
total acceptance, are that it takes effort to learn, it takes time to implement (scouting and
keeping track of advisories), it is difficult to understand without a basic knowledge base,
and there is an added risk involved by not spraying as soon as there is a possibihty that the
leaf spot fungus can grow. The four greatest inhibitors of the further spread of LSA could
then be classified as the inertia involved with offering a person a chance to change,
farmer's lack of education (including ilUteracy), fear of risk, and a lack of knowledge of the
existence of LSA itself.
General Recommendations
In order to decide how best to reach the farmers who are not using LSA, it will be
most helpful to examine the reasons why some farmers tend to be more progressive than
others. Niels Roling (1982) Usts two commonly held, antagonistic views of why farmers
differ. The first is related to psychological variables ~ small farmers are essentially small
because they are lazy, stupid, and lack drive; in effect, they are blamed for their poverty.
The second view argues that large, more wealthy farmers have more access to land, water,
labour, inputs, markets, capital, and information than smaller farmers. One may, of
course, fall along a continuum between these two extremes, but the approach that one takes
to solve the problem is unquestionably influenced by the stronger of these two views.
Most extension workers and managers, however, have been trained in a theory of
diffusion of innovation as reviewed by Rogers with Shoemaker (1971), which has since
been repudiated by Rogers (1983), that advocates the "psychological variable" theory
(Roling 1982). In addition, as stated earUer, most states have as an expressed desire to get
a large percentage of land into IPM programs (VCES 1987). As a result, the agencies
usually target larger, more wealthy farmers for new technologies with the underlying
assumption that the other farmers will slowly gain from their experience through
autonomous diffusion ~ or the "trickle down" theory (Roling et al 1976). However, the
reaUty of communication networks is that people from the same social groups talk to each
other and there is very Uttle transfer of information between social groups (Roling 1982).
This, along with many other factors, inhibit primary adoption of innovation by the
underclass, leading to what Rogers (1983) terms the "innovation-needs paradox". Farmers
that need a new technological idea the most are often the ones that adopt it last, which
causes widening socioeconomic gaps in the social system. A classic example of this has
of focusing on a small group of wealthy farmers, resulting in an increased disparity
between them and small scale farmers (Roling 1982).
Because the percentage of small, less educated farmers who have not even heard of
LSA is so large, it seems likely that LSA is another innovation that is following the
expected route of adoption which will lead to greater inequality in the farming community.
To believe that a 'trickle down' of information will occur is unrealistic, especially when
new users are tapering off (Figure 4) and no farmers in the survey said they had first
learned of LSA from a neighbor or friend. Therefore, a decision must be made either to
accept the current distribution of LSA users, or to promote LSA in other segments of the
population and, perhaps, use the same techniques in future innovation adoption strategies.
One way to overcome inequalities facing small farmers may be to identify what
Rogers (1983) calls the opinion leaders — those individuals that others in the community
look up to and tend to follow — in the disadvantaged segment of the population and educate
them, thus, activating their peer network (Rogers 1983). This would require extensive
knowledge of the community by the extension agent. Although difficult, this is not an
unreasonable demand. The chances of success are, however, highly uncertain and will
fluctuate in both area and innovation.
Another strategy is to organize formal groups among the small farmers to provide
them with leadership and social reinforcement in their innovation decision making (Rogers
1983). This method may be more difficult to get started, but when in place it would
provide the structure needed to encourage the spread of more ideas beyond the immediate
goals.
Either alone or in addition to these strategies, extension agents could tailor
communication messages especially for the lower socioeconomic audiences. For example,
agents could make a presentation more easily understood with the aid of drawings,
photographs, and other visual aids (Rogers 1983). Agents should also be sure to use
communication channels that are accessible to smaller, less educated farmers so that access
to information is not a barrier to adoption (Rogers 1983). Thus, newsletters should not be
the only source of information when there are significant numbers of illiterates in the
population.
Whatever method is chosen, however, as a ground rule agents should always take
into account and tailor promotional efforts to recognize fundamental differences between
farmers. In presenting an innovation to an audience which is made up of people who
typically are the first to adopt a new technology, one might appeal to them with evidence of
it being soundly tested and developed by credible scientists because research has shown
that these people find this argument the most persuasive. When presenting to people who
are usually the last to adopt a new innovation one should be aware that they, typically, do
not have favorable attitudes towards science. The most effective method, therefore, is
likely to emphasize what they do place the most credibUity in ~ the subjective experience of
their peers as conveyed through interpersonal networks (Rogers 1983). It is important to
remember not to take the perspectives of a group of people for granted. People with
different backgrounds will be affected by a given piece of information in different ways.
Undoubtedly, all of the effective recommendations that will be necessary for a
continued spread of this and other farm management innovations have considerable costs in
time, energy, and money. Inertia, however, also has its price in the forms of increased
disparity between wealthy and poor farmers, and increased environmental degradation as
Recommendations For Further Study
When conducting further studies in Northampton County and other areas, based on
this research, there are parts of this survey that ought to be avoided or altered and other
parts that can be beneficial. Some suggestions for further investigations using this study as
a starting point for work in other regions.
The sample size proved to be sufficient for most areas of investigation; where no significant difference was found between the LS A user group and the non-user group there
either was no significant difference or there was a problem with the wording of the
question. When seeking to reveal the level of concem farmers have for the harmful effects
of pesticides, larger sample sizes should be used.
Some suggestions in collecting more useful data include the following:
1) Question number 2, "How many years have you been farming?", should be broken down into two questions ~ years that you have owned your own farm and years of
farming experience.
2) Question number 7, "What do you think of (IPM)?", was apparently too broad
for people to give a meaningful response; instead, a series of more specific questions
should be asked, such as, "Does IPM increase your profits?", "How does IPM affect your
yield?" and, "Is pest management more or less time consuming with or without it?" In
addition, researchers should ask a question on what the farmer sees as the advantages and
disadvantages of IPM implementation.
3) A couple of the farmers in this survey said they scouted for leafspot with the help
of consultants even though they did not use LS A. In addition. The National Evaluation of
Extension's Integrated Pest Management (IPM) Programs (VCES 1987) found that at least
50 percent of all fanners surveyed used scouting as an integral part of their pest
management strategy, even if they did not use secondary IPM techniques. Hence, there
may have been other farmers in this survey who used scouting but did not report it and,
therefore, it would be important in an additional study to ask the question of whether or notthe farmer uses scouting.
4) A number of farmers volunteered information on specific harmful effects that
they experienced with pesticides. Because this question was not asked directly, there may have been others in the study with similar experiences that did not mention them. In order to make this data more useful, asking, "What harmful effects have you experienced with
pesticides?", would be beneficial for the information base.
5) The answer to the question of whether or not there is a motivational factor for adopting progressive pest management strategies because of a farmer's personal concern for the adverse effects of pesticides may be better answered if, in addition to the series of questions dealing with how worried the farmer is about these potential adverse effects, the
question were asked directly, "What elements of your pest management strategies have you
adjusted as a result of your desire to prevent these adverse effects fi-om occurring?"Conclusions
In modem, large-scale, commercial agriculture pesticides are a necessary
component of production. One billion pounds of pesticides are applied each year at a cost
of $2.2 billion (Pimentel 1980). Despite the use of these chemicals, insects alone reduce potential crop yields in the U.S. by 13 percent and destroy 5-10 percent of harvested commodities, for a total of 18-23 percent of the food supply (Josephson 1983). Without the use of pesticides the potential loss would be an additional 9 percent or $8.7 billion(Pimentel 1980). Thus, the farmer makes about a $4 return for each dollar invested on
pesticides. Unfortunately, there are also numerous adverse effects to the health and safety of people and the environment as a result of heavy use of these very toxic chemicals.
About 45,000 human pesticide poisonings occur annually, 3,000 of which are serious
enough to require hospitalization, and 200 result in fatalities (EPA 1974). Other costs
include poisoned and contaminated livestock, loss of natural enemies of agricultural pests,
pollination losses from the destruction of natural pollinators, fish kills due to run-off, harm
to other wildlife including birds, and the contamination of water supplies, including ground water (Pimentel 1980). The additional monetary cost of pesticide use was roughly
estimated to be an additional $2 billion by Pimental (1980). Hence, the need is great for reducing the harmful effects of pesticides while still maintaining adequate crop protection.
Integrated pest management is believed by many to be the only reasonable method
of pest control (Blair and Parochetti 1982). It has the multiple advantages of maintaining or
improving crop yields and quality, while simultaneously reducing the level of pesticides
used (VCES 1987). However, the small amount of research done on IPM implementation
has indicated that there are large segments in the farm community that have not adopted it. The implementation of LSA is used in this study as a window into the process of the farm community's adoption of innovation. In this way, an evaluation of LSA adoption can be
used to learn the best way to promote innovation to farmers in hope of reducing the
pesticide level in the environment.
This research has added to the literature of farmer adoption of new pest
management technologies by examining the acceptance of LSA by the farmers of
Northampton County, North Carolina. In addition, it measured the level of IPM
acceptance and the level of farmer concem about the potentially harmful effects of
pesticides. Because the sociological features of this farmer community were found to be
similar to others described in studies more national in scope, it is believed that the findings
have relevance to areas beyond this county.
This study found that not only had most farmers not accepted IPM, but that few had
heard of it or understood what it meant. Unlike IPM, LSA has been widely accepted and
highly regarded in the Northampton County farm community in just five years, despite the fact that some segments of the population are still not being reached by this service. It was
also found that the average farmer was not terribly worried about the potential harmful
effects of pesticides, but that there were a number of farmers who had had disastrous
experiences with them. However, several farmers were very worried about the harmful
effects of the pesticides and for some farmers these concerns were said to have influenced their pest management decisions. It could not be said, however, that farmer concerns were
associated with the adoption of pesticide reducing technologies.
There may be a number of reasons for the low adoption rate of IPM, including: a)
the high education level generally required for understanding the concepts, b) the need to
throughout the community entire community. Indeed, this research indicates few farmers
know about it. The other major hindrance to IPM's spread seems to be a low education
level among a large segment of the population. In contrast, LSA has seen much greater
success. Its advantages over a complete IPM package for the peanut farmer include: a)
being able to practice it without hiring outside help, and b) being able to employ it on any
size farm. Like IPM it does require, however, both a minimum education level and
promotion firom an authority. These factors seem to be the greatest inhibitors of further
acceptance of LSA in Northampton County.
These findings reveal that innovative ways to educate the farmer and promote new
technologies are badly needed. Extension agents need to recognize that the farmer
community is segmented along socioeconomic lines and that adoption may be more widely
accomplished if different approaches are used for the less educated, smaller farmer than for
the well educated, larger farmer. It is important that this be done in order to prevent a
widening of the differences between these two groups. Studies have commonly shown
that individuals who need innovative techniques the most are often the last to adopt them. Steps can be taken, however, to counteract this outcome (Rogers 1983). Any attempt at a long-term solution to the problem of excess pesticides in the environment must not ignore large segments of the farmer population. Rather, it must work with them for the benefit of
all.
References
Bailey, J. E. 1987. Weather and Disease: Peanut Leafspot Advisories in North Carolina,
unpublished, pp. 37.
Blair, B. D. and J. V. Parochetti. 1982. Extension implementation of integrated pest
management systems. Weed Science, supplement to v. 30, p. 48-53.
Brattsten, L. B., C. W. Holyoke, Jr., J. R. Leeper, K. F. Raffa. 1986. Insecticide
resistance: challenge to pest management and basic research. Science, v. 231,
p. 1255-1260.
Council on Environmental Quality. 1972. Integrated Pest Management. Washington, D.
C. pp. 41.
EPA. 1974. Strategy of the Environmental Protection Agency for Controlling the Adverse Effects of Pesticides. EPA, Office of Pesticide Programs, Office of Water and Hazardous Materials, Washington, D. C, pp. 36.
Frisbie, R. E. 1985. Regional implementation of cotton IPM. In Integrated Pest Management on Maior Agricultural Systems, eds. R. E. Frisbie and P. L.
Adkisson. From a symposium sponsored by The Consortium for Integrated Pest Management and USDA/CSRS, held October 8-10, 1985. p. 638-651.
Garforth, C. 1982. Reaching the rural poor: a review of extension strategies and methods. In Progress in Rural Community Development, volume 1. eds. G. E. Jones and M.
J. Rolls. John Wiley and Sons, New York, p.43-70.
Georghiou, G. P. and R. B. Mellon. 1983. Pesticide resistance in time and space. In Pest Resistance to Pesticides, eds. G. P. Georghiou and T. Saito. Plenum Publishing
Corp. New York. p. 1-45.
Jensen, R. E. and L. W. Boyle. 1965. The effect of temperature, relative humidity and precipitation on peanut leafspot. Plant Disease Reporter, v. 49, p.975-978.
Jensen, R. E. and L. W. Boyle. 1966. A technique for forecasting leafspot on peanuts.
Plant Disease Reporter, v. 50, p. 810-814.
Josephson, J. 1983. Pesticides of the future. Environmental Science and Technology, v.
17, P.464A-468A.
Kirby, H. W. and C. E. Main, unpublished. Assessment of Farmer Utilization of Tobacco IPM Programs in North Carolina, pp. 25.
Miller, A. 1983. Integrated pest management: psychosocial constraints. Protection
Ecology, V. 5, p.253-267.
Pimentel, D. 1986. Acroecology and economics. In Ecological Theory and Integrated Pest
Management Practice, ed. Marcos Kogan. John Wiley and Sons, New York, p.299-319.
Pimentel, D., D. Andow, R. Dyson-Hudson, D. Gallahan, S. Jacobson, M. Irish, S. Kroop, A. Moss, I. Scteeiner, M. Shepard, T. Thompson, and B. Vinzant. 1980. Environmental and social costs of pesticides: a preliminary assessment. Oikos. v.
34, p. 127-140.
Rogers, E. M. 1971. Communication of Innovation: a cross cultural approach, second
edition. The Free Press, New York. pp. 476.
Rogers, E. M. 1983. Diffusion of Innovations, third edition. The Free Press, New York,
pp. 453.
Roling, N. 1982. Alternative approaches in extension. In Progress in Rural Community
Development, volume 1. eds. G. E. Jones and M. J. Rolls. John Wiley and Sons,New York. p. 87-116.
Roling, N., J. Ascroft, and F. WaChege. 1976. The diffusion of innovations and the
issue of equity in rural development. Communication Research, v. 3, p. 155-170.
Virginia Cooperative Extension Service. 1987. The National Evaluation of Extension's
Integrated Pest Management (IPM) Programs. In cooperation with United States
Department of Agriculture. VCES pubUcation 491-010. pp.123.Whalon, M. E. and Patrick Weddle. 1985. Implementing IPM strategies and tactics in
apple: an evaluation of the impact of CLPM on apple IPM. In Integrated PestManagement on Major Agricultural Systems, eds. R. E. Frisbie and P. L.
Adkisson. From a symposium sponsored by The Consortium for Integrated Pest
Management and USDA/CSRS, held October 8-10, 1985. p. 619-637.
1988 Peanut Farmer Survey: Leafspot Advisory Adoption
In Northampton County, North Carolina
Farmer 1 AC res of 1 Years 1 Number 1 Fa"•mer 1Farmer |Heard (Knows (Uses 1Heard of (Heard of Number Peanuts [Farming |Crops/yr| Age |Yrs EducjOf IPM |IPH jlPM 1Advisory (LSA From
1 28 50 3 72 4 0 0 0 0
--2 41 5 5 37 12 0 0 0 1 Other
3 160 20 4 45 14 0 0 0 1 Co. Meeting
4 25 27 3 58 12 0 0 0 0
--S 40 9 4 30 16 1 1 1 1 Ext. Agent
6 230 36 5 46 12 0 0 0 1 Ext. Agent
7 140 30 5 50 12 1 0 0 1 Ext. Agent
8» 250 15 5 30 12 1 1 1 1 Ext. Agent
9 9 30 3 62 11 1 1 0 0
--10 % 17 4 48 13 1 1 1 1 Ext. Agent
11 14 61 3 71 6 0 0 0 1 Ext. Agent
12 30 23 3 63 6 0 0 0 0
--13 53 31 4 60 12 0 0 0 1 Mass Media
14 1^ 18 5 45 18 1 1 1 1 Ext. Agent
15 20 25 7 46 14 1 1 1 1 Mass Media
16 150 30 3 59 3 0 0 0 1 Ext. Agent
17 24 10 3 47 12 1 0 1 1 Co. Meeting
18* 70 20 3 57 14 0 0 0 1 Chem. Rep.
19 3,5 20 3 52 7 0 0 0 0
20 150 25 4 51 12 0 0 0 1 Mass Media
21 4 10 2 29 9 0 0 0 1 Mass Media
22 74 60 3 67 16 1 1 1 1 Ext. Agent
23 12 20 3 16 0 0 0 0
24 100 8 4 34 12 0 0 0 1 Ext. Agent
25 40 15 4 42 11 0 0 0 1 Ext. Agent
26 10 60 4 72 7 0 0 0 0
--27 135 12 4 44 16 1 1 1 1 Ext. Agent
28 300 40 5 63 14 1 1 1 1 Ext. Agent
29 90 10 1 47 11 0 0 0 0
--30 200 20 5 50 16 1 1 1 1 Ext. Agent
31 80 15 3 48 12 1 1 0 0 -•
TOTAL 2672.5 13 11 10 22
AVG 86 .20967 24 90322 3 7741935 50 83333 11.67741
STD
%
continued
Farmer Used IWi It Use|Yrs ago 1% Follow Sprays |How Were|Worried:| Worried:|Worriec: ]Worried: 1Worned:
Number Advi sory|Advi sory11st Tried] Advisory Saved $ Saved jself 1Family jLivestockjWater Supply]Environrae
1 0 0 0 0 N/A -- 1 1 N/A 1 1
2 1 1 5 >75 1 S 0 0 N/A 0 0
3 1 1 2 >75 2 s 0 0 H/A 1 0
4 0 0 0 0 N/A
--0 0 0 0 0
5 1 1 1 >75 1 s 1 1 N/A 1 1
6 1 1 4 25-75 4 S 1 1 N/A 1 1
7 1 1 3 >75 2 s 0 0 0 0 1
8* 0 0 0 0 N/A -- 0 0 0
0 2
9 0 0 0 0 N/A
--0 0 0 1 0
10 1 1 4 25-75 6 S/Y 0 0 N/A 1 0
11 0 0 0 0 N/A -- 0 0
N/A 0 0
12 0 0 0 0 N/A
--0 0 0 1 1
13 0 0 0 0 N/A -- 1 0
N/A 0 1
14 1 1 4 >75 3 S/Y 2 0 N/A 0 0
15 1 1 3 >75 2.5 S/Y 2 2 2 2 2
16 1 1 3 >75 1 S/Y 0 0 N/A 0 0
17 1 1 4 25-75 1.5 S 0 1 N/A 0 1
18* 0 0 0 0 N/A
--0 0 N/A 0 0
19 0 0 0 0 N/A
--1 1 1 0 1
20 0 1 0 0 N/A 0 0 2 1 1
21 0 0 0 0 N/A -ͣ
0 0 0 0 0
22 1 1 4 >75 2 S 0 0 N/A 0 1
23 0 0 0 0 N/A
--2 2 N/A 2 2
24 1 1 3 >75 2.5 S 1 2 2 2 2
25 1 1 2 >75 2 S/Y 1 1 1 1 1
26 0 0 0 0 N/A -- 1 0 0 0 0
27 1 1 4 >75 2.5 s 0 0 0 1 0
28 1 1 3 >75 3 s 1 1 N/A 1 1
29 0 0 0 0 N/A •- 0 0 1 0 0
30 1 1 2 >75 3 S/Y 0 0 0 0 0
31 0 0 0 0 N/A 1 0
N/A
0 0 1
TOTAL 16 17 39 16 13 9 17 21
AVG 2.4375 0.516129 0.419354 0.5625 0.5483870968 0.6774193
STO
X 51.61290 54.83870