MITIGATION OF FLOODING AT THE UNIVERSITY OF NORTH CAROLINA AT MANNING PARKING LOT
Weixuan Wu
A technical report submitted to the faculty of the University of North Carolina at Chapel Hill in partial fulfillment of the requirements for the degree of Master of Science in Environmental
Engineering in the Department of Environmental Sciences and Engineering in the Gillings School of Global Public Health.
Chapel Hill 2017
© 2017 Weixuan Wu
ABSTRACT
Weixuan Wu: Mitigation of flooding at the University of North Carolina at Manning Parking Lot (Under the direction of Pete Kolsky)
There is a frequent flooding problem at the Manning Parking Lot (MPL) of the
ACKNOWLEDGEMENTS
Firstly, I would like to express my very great appreciation to my advisor and committee member, Dr. Pete Kolsky. I feel very lucky to be his student throughout the MSEE program and learned many valuable things from him. I would like to thank him for his constructive
suggestions during the planning and development of this study. He is willing to generously give his time to meet with me every week, and very carefully review these briefs, drafts and this technical report. As an international student, I’m grateful for his patience in correcting my grammatical mistakes.
Next I would like to express my deep gratitude to Sally Hoyt, an experienced Stormwater Engineer at UNC. I would like to thank her for offering me this project and related resources, meeting with me many times, giving me suggestions and guidelines for this project, as well as for answering my questions patiently.
I also would like to thank Glenn Walters, for serving on my committee. I really appreciate his advice throughout the review process of this report.
TABLE OF CONTENT
ABSTRACT ... iii
ACKNOWLEDGEMENTS ... v
LIST OF TABLES ... ix
LIST OF FIGURES ... xi
LIST OF ABREVIATIONS ... xiii
CHAPTER 1: INTRODUCTION ... 1
CHAPTER 2: PROBLEM IDENTIFICATION ... 3
2.1 Introduction ...3
2.2 Stormwater BMPs ...4
2.3 The Nature of Flooding Problems ...5
2.4 Motivation of Project ...7
2.5 Rainfall Data ...8
2.6 Site Background ...9
2.6.1 Upstream Catchment and Drainage System ...10
2.6.2 MPL Tributary Catchments and Drainage System ... 11
2.7 Inflow & Outflow ...13
2.7.2 Inlet Capacity Check ...15
CHAPTER 3: TECHNICAL OPTIONS ANALYSIS ... 18
3.1 Introduction ...18
3.2 Technical Options ...18
3.2.1 Analysis of Options ...19
3.3 Comparison of Different Options ...23
3.4 Costs of Different Options ...27
3.4.1 Costs of Inlet Addition ...28
3.4.2 Costs of Inlet Cleaning ...29
3.4.3 Costs of Pipe Additions ...30
3.4.4 Comparison of Costs ...31
3.5 Recommended Options ...32
CHAPTER 4: RECOMMENDED SOLUTIOS ... 33
4.1 Introduction ... 33
4.2 First Solution— Pipe Additions ...33
4.2.1 Pipes ...33
4.2.2 Inlet and Access Hole ...36
4.2.3 Access Structure ...37
4.3 Second Solution —Inlet Addition ...38
4.3.1 Inlet ...38
CHAPTER 5: IMPLEMENTATION PLAN ... 40
5.1 Introduction ...40
5.2 Plan 1—Adding New Pipes ...40
CHAPTER 6: FURTHER WORK ... 53
CHAPTER 7: CONCLUSION ... 55
APPENDIX A: RATIONAL METHOD ... 56
A.1 Runoff Coefficient ...56
A.2 Rainfall Data ...58
A.3 Time of Concentration ...59
APPENDIX B: CHECKING PIPE SIZE ... 66
B.1 Checking Pipe Sizes by Calculation ... 66
B.2 SWMM Modeling ... 67
APPENDIX C: CHECKING INLET ... 70
C.1 Checking Inlet Interception Capacity ... 70
C.2 Flow Spread ... 71
APPENDIX D: NEW PIPE DESIGN ... 73
APPENDIX E: DATA SOURCE INFORMATION ... 77
LIST OF TABLES
Table 1: Area and runoff coefficient for tributary catchment ... 13
Table 2: Characteristics of pipe network of MPL ... 13
Table 3: Peak inflow and time of concentration for pipe network on the MPL ... 14
Table 4: Characteristics and interception capacity of inlet 241-A-030 ... 16
Table 5: Summary Evaluation of Options ... 24
Table 6: Capital costs of the MPL for inlet addition ... 29
Table 7: Capital costs of the MPL pipe addition ... 31
Table 8: Comparison of costs ... 31
Table 9: The parameters of two new pipes ... 35
Table 10: The resource requirement of plan 1 ... 43
Table 11: Sensitivity analysis of NPV with varying interest rates for plan 1 ... 46
Table 12: The resource requirement of plan 2 ... 50
Table 13: Sensitivity analysis of NPV with varying interest rates for plan 2 ... 51
Table 14: Runoff coefficient for rationa method (US DOT 2013) ... 57
Table 15: Area and runoff coefficient for tributary catchments on MPL ... 58
Table 16: Rainfall intensity, duration and frequency (NOAA 2016) ... 58
Table 17: Characteristics of initial watershed ... 61
Table 18: Travel time in different drains ... 63
Table 19: Manning’ s roughness coefficient (n) for overland sheet flow (US DOT 2013) ... 64
Table 20: Sheet flow on the ground travel time ... 65
Table 22: Nodes input data for SWMM mode of drainage system on MPL ... 68
Table 23: Conduit input data for SWMM model of drainage system on MPL ... 68
Table 24: Time series input data for SWMM model of drainage system on MPL ... 69
Table 25: Characteristics and total interception capacity of inlet 241-A-030 and new inlet ... 70
Table 26: Pipe dimension and weights (http://www.Istresourcesolutions.com/reinforced-concrtete-single-offset-joint-pipe.html#prettyPhoto) ... 74
Table 27: The parameters and maximum flows of new pipes ... 74
Table 28: Nodes input data for SWMM mode model of pipe additions option ... 75
Table 29: Conduit input data for SWMM model of pipe additions option ... 76
LIST OF FIGURES
Figure 1: MPL site as located on Google map ... 4
Figure 2: The BMP detention structures ... 5
Figure 3: The BMP outlet 241-A-039 ... 5
Figure 4: Main flooding area at MPL ... 6
Figure 5: Outfall 241-A-033 of the drain system on MPL (November 14th 2016) ... 7
Figure 6: Flooding at the MPL (April 25th 2017) ... 8
Figure 7: 10-year return period IDF curve for the MPL site (NOAA 2016) ... 9
Figure 8: Catchment areas contribute to MPL ... 10
Figure 9: MPL upstream catchment areas ... 11
Figure 10: Tributary catchments and drainage system on MPL ... 12
Figure 11: SWMM hydraulic profile during peak of 10-year storm: Node 241-A-030 to outlet.. 15
Figure 12: Inlet 241-A-030 clogged with leaves during a storm (April 25th 2017) ... 16
Figure 13: Additional inlet near to the BMP outlet 241-A-039 ... 20
Figure 14: Adding pipes from BMP outlet 241-A-039 to drain ... 21
Figure 15: New route to drain ... 23
Figure 16: Solution1 of pipe additions ... 34
Figure 17: SWMM hydraulic profile of new pipes (10-year storm) ... 35
Figure 18: SWMM hydraulic profile: BMP outlet 241-A-039 to MPL outfall (10-year storm) . 36 Figure 19: Example of a beehive grate (http://www.deeter.com/products/beehive-drainage-grates/) ... 37
Figure 20: Example of an inlet structure (US DOT 2013) ... 37
Figure 22: The location of new inlet ... 39
Figure 23: Pipe installation details ... 43
Figure 24: Short drain with 4” diameter ... 45
Figure 25: Sensitivity analysis of NPV with varying interest rates for plan 1 ... 47
Figure 26: The combination inlet (US DOT 2013) ... 50
Figure 27: Sensitivity analysis of NPV with varying interest rates for plan 2 ... 52
Figure 28: IDF curves for the MPL site (NOAA 2016) ... 59
Figure 29: Nomogram to calculate overland flow time (Nazih 2010) ... 60
Figure 30: The initial overland flow ... 61
Figure 31: Hydraulic elements chart (US DOT 2013) ... 62
Figure 32: Flow traveling route ... 63
Figure 33: SCS synthetic unit hydrograph ... 67
Figure 34: SWMM model background for drainage system on MPL ... 68
Figure 35: Definition of depth ... 70
LIST OF ABREVIATIONS
BMP Best Management Practices BOG Board of Governors
CC Capital Costs
CY Cubic Yard
EA Each
ESD Energy Services Department HGL Hydraulic Grade Line
IDF Intensity-Duration-Frequency LF linear Foot
LS Lump Sump
MPL Manning Parking Lot
NOAA National Oceanic and Atmospheric Administration NPV Net Present Value
OEDA Open Ended Design Agreement O&M Operation and Maintenance PSD Public Safety Department
PTD Parking & Transportation Department RCP Reinforced Concrete Pipe
SCO State Construction Office
SF Square Foot
SWMM Storm Water Management Model
CHAPTER 1: INTRODUCTION
This technical report consists of three parts: (1) identification of the problem of flooding at the Manning Parking Lot (MPL); (2) description and analysis of a number of technical options and comparison of them according to different criteria; (3) description and analysis of how the preferred solution can be implemented.
In the first part, the flooding problem is described in sufficient detail to permit the development of technical options. Based on historical precipitation patterns and the characteristics of the MPL and its existing drainage system, a hydraulic Storm Water
Management Model (SWMM 5.1.011 2015) was developed. By observation, calculation, data and model analysis, the magnitudes of flows and the probable causes of flooding are estimated and presented.
In the second part eight technical options are identified to address the problem, and are compared using five criteria—effectiveness, cost, ease of operation and maintenance,
CHAPTER 2: PROBLEM IDENTIFICATION 2.1 Introduction
This chapter generally describes the location of the UNC Manning Parking Lot (MPL) which is lot number P200 in the University system, its flooding problem, and local site
conditions such as catchment size and type, soil type, and precipitation patterns. The chapter serves as basic background to the work to be done to identify alternative solutions or reductions in the problem of flooding at the site.
The MPL consists of a 4-acre Parking Lot on three different levels located along Manning Drive between Aycock Family Medicine and the Skipper Bowles Drive intersection. Its location is shown in Figure1. The lots offer about 500 parking spaces for both neighborhood residents and UNC students. Past flooding events often caused difficulty for people to reach their cars and resulted in the decrease of parking space, especially in freezing temperatures, where ice presented a serious safety hazard.
Figure 1: MPL site as located on Google map 2.2 Stormwater BMPs
Stormwater Best Management Practice (BMP) is a term used to describe both structural or non-structural measures which can reduce stormwater volume, peak flow, and nonpoint source pollution through evaporation, infiltration, detention, and filtration or biological and chemical actions (Wikipedia 2017). There are two detention structures in the investigated area (Figure 2), which are classified as structural stormwater BMPs to reduce the peak flow of runoff on
upstream catchments flows into the MPL drainage system by the BMP outlet 241-A-039 (see Figure 3).
Figure 2: The BMP detention structures
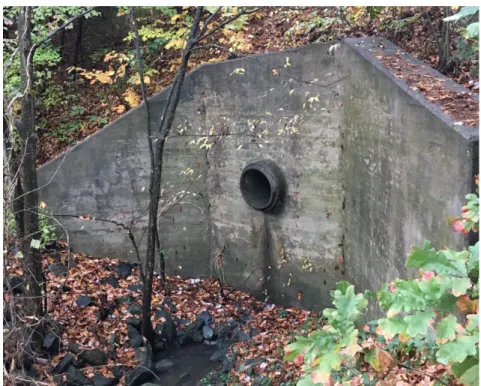
Figure 3: The BMP outlet 241-A-039 2.3 The Nature of Flooding Problems
pipe between the BMP and inlet 241-A-030, the BMP discharge flows directly to the ground and from there to the parking lot. Thus, if the MPL drainage system doesn’t have sufficient capacity to intercept and transport the BMP discharge, flooding of the MPL will occur.
Figure 4: Main flooding area at MPL
The downstream condition of the MPL drainage network is another factor which could cause flooding. If the Hydraulic Grade Line (HGL) downstream of the MPL network is high enough, flooding can occur upstream regardless of inlet or pipe network capacity. However, as illustrated in Figure 5, there is a free fall of about 3 ft at the drainage network discharge. The hydraulic evidence shows that with a free fall, the system should not be surcharged if the flows get to the pipes and they are adequately sized. Hence, conditions downstream of the Parking Lot Drainage System are thus ruled out as a cause of frequent flooding.
100 ft
BMP outlet 241-A-039
Inlet 241-A-030
Pipe size and inlet interception capacity were further investigated to determine whether they are the causes of frequent flooding, in order to identify appropriate solutions.
Figure 5: Outfall 241-A-033 of the drain system on MPL (November 14th 2016)
2.4 Motivation of Project
MPL covers a large area, which provides plenty of spaces for visitors and nearby residents, and serves a significant function for university transportation. However, flooding problems often occur and could cause many adverse effects. Figure 6, a photograph taken on April 25th 2017 after a heavy rain, shows that the flooding area was significant with a depth of runoff of about 1/2-1 inch.
Firstly, flooding makes it difficult for people to reach their cars and reduces the available space for parking. Especially in winters, the cold weather can freeze the road surface, which is both inconvenient and dangerous for pedestrians and vehicles.
Thirdly, the materials and surface of the road are damaged if they are submerged by water for long periods of time, making them more dangerous and damaging to traffic.
Figure 6: Flooding at the MPL (April 25th 2017) 2.5 Rainfall Data
The rainfall data for MPL comes from the National Oceanic and Atmospheric
Administration (NOAA) National Weather Service, 2016. The precipitation intensity data was collected from the Chapel Hill 2 W station (31-1677). This station is located approximately 2.0 miles from MPL. The data includes rainfall intensities for varying duration and storm recurrence frequencies. Rainfall intensity is the rate at which rainfall occurs per time (expressed in
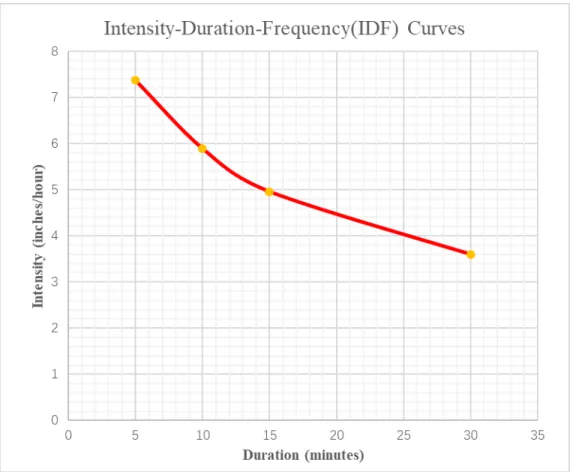
Figure 7: 10-year return period IDF curve for the MPL site (NOAA 2016)
2.6 Site Background
Figure 8: Catchment areas contribute to MPL 2.6.1 Upstream Catchment and Drainage System
As shown in Figure 9, the upstream catchment of the MPL includes the following parts: • half the roof of Baity Hill Drive 1800 building,
• the roof of Baity Hill Drive 1900 and 2000 buildings, • half the roof of Baity Hill Drive 1503 building, • playground in the middle of buildings, and
Figure 9: MPL upstream catchment areas
The total area of the upstream catchment is calculated to be 3.92 acres and the average runoff coefficient of these different catchment parts is 0.325. Using the Rational Method, the peak flow of the upstream catchment during the 10-year storm is estimated to be about 6.2 cfs.
2.6.2 MPL Tributary Catchments and Drainage System
Figure 10 shows the tributary catchments on the MPL, which is 3.83 acres. A, B, C, D, E represent different sub-basin catchment areas, respectively. Based on the soil classification from
Natural Resources Conservation Service Soil Survey (USDA 2016), most of the soil types of these areas are Wedowee sandy loam. The cover types mainly include vegetation covers and concrete lands. The ground slopes are between 5 to 20 percent. The runoff which comes from subareas A, B, C, D, E separately flows into inlets 030, 024, 231-B-007, 241-A-028, 231-B-008. The specific tributary catchment data is shown in Table 1.
The drainage system of MPL is also shown in the Figure 10. P1, P2, P3, P4, P5 refer to different pipes respectively. The central network of pipes includes a 15” pipe (P1), two 24” pipes (P2 and P3). There are smaller pipes (P4 and P5) that feed into this central network which drain into a 24” pipe leading to a larger campus pipe network system.
Table 1: Area and runoff coefficient for tributary catchment Sub-basin Total
Area (acre)
Runoff coefficient
A 1.39 0.48
B 0.58 0.56
C 1.20 0.68
D 0.35 0.44
E 0.30 0.44
Table 2: Characteristics of pipe network of MPL
Pipe
Actual
Diameter Length Slope n (full) Q
in ft ft ft/ft (cfs)
1 15 1.25 86 0.0944 0.012 21.5
2 24 2 130 0.0954 0.014 75.7
3 24 2 24 0.083 0.012 70.6
4 12 1 243 0.0449 0.012 8.17
5 12 1 265 0.0356 0.012 7.28
2.7 Inflow & Outflow
2.7.1 Pipe Capacity Check
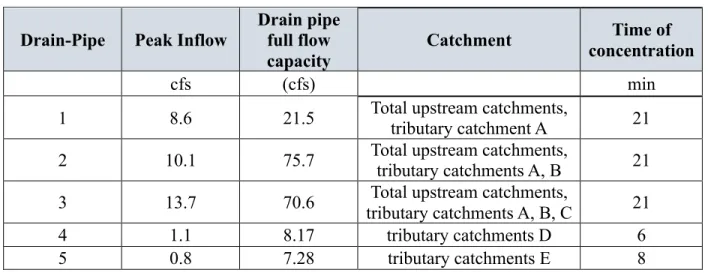
is much less than the uniform flow capacity, the pipe network on MPL thus has enough capacity to drain 10-year storm flows.
Table 3: Peak inflow and time of concentration for pipe network on the MPL
Drain-Pipe Peak Inflow Drain pipe full flow capacity
Catchment Time of
concentration
cfs (cfs) min
1 8.6 21.5 Total upstream catchments,
tributary catchment A 21 2 10.1 75.7 Total upstream catchments, tributary catchments A, B 21 3 13.7 70.6 tributary catchments A, B, C Total upstream catchments, 21
4 1.1 8.17 tributary catchments D 6
5 0.8 7.28 tributary catchments E 8
Figure 11: SWMM hydraulic profile during peak of 10-year storm: Node 241-A-030 to outlet 2.7.2 Inlet Capacity Check
Limited inlet capacity may also cause the flooding problem because if the passing flow depth is higher than the height of curb opening, the inlet cannot intercept all of the stormwater, and could cause flooding on MPL. The Hydraulic Engineering Circular No.22 of the U.S. Dept of Transportation (US DOT 2013) gave a widely accepted method to check inlet capacity, which is illustrated in Appendix C and Table 4 shows the related characteristics of inlet 241-A-030. The inlet 241-A-030 at the site of flooding is a combination inlet in a sag location. According to the US DOT guidelines, the interception capacity of combination inlets is the flow intercepted by an inlet under a given set of conditions, which equals the sum of flow going through the grate and the flow coming into the curb inlet. When the grate is fully clogged, inflow is limited the curb inlet capacity. For inlet 241-A-030, the maximum capacity was calculated to be about 11.3 cfs when the grate is clear of clogging. The peak flows passing by the inlet 241-A-030 were estimated to be about 8.6 cfs, so the interception capacity of inlet 241-A-030 is sufficient
Pipe 1
Pipe 2
Pipe 3
Maximum Flow =13.7cfs cfs
assuming the grate is clear. However, the grate of inlet 24-A-030 is likely to be clogged in practice. Figure 12 was a photo shot during the November 14th, 2016 storm. It shows there was a clogging problem of inlet 241-A-030 during the fall. Assuming the grate is fully clogged, the interception capacity equals to curb inlet capacity becomes 3.63 cfs, which is less than the peak flow. Thus if the grate of inlet is clogged, overflow is very likely to be produced.
Table 4: Characteristics and interception capacity of inlet 241-A-030
Characteristic Parameter
Max. Ag (ft2) 2.1
Max.d (ft) 0.46
Max.h (ft) 0.43
Max.L (ft) 3
Max.do (ft) 0.275
Grate flow capacity (cfs) 7.65 Curb inlet capacity (cfs) 3.63
Max. Q (cfs) 11.29
CHAPTER 3: TECHNICAL OPTIONS ANALYSIS 3.1 Introduction
In this chapter, eight options are proposed to solve or mitigate this flooding problem. The development and evaluation of these options were conducted through a combination of
discussions with Dr. Kolsky and UNC facilities employees knowledgeable about campus drainage, and field observations during some storm events; these options were then subject to modeling or other analysis as described below, and compared against explicit evaluation criteria. The overall evaluation approach follows that developed by Taylor Edmonds in her analysis of flooding at the Student Recreation Center, including adoption of her evaluation criteria of effectiveness, cost, ease of operation &maintenance, environmental impact and disruption (Edmonds, 2014).
3.2 Technical Options
Eight technical options were developed to address the flooding problem: (1) Increasing pipe sizes of the drainage system on MPL,
(5) Adding pipes to connect the BMP outlet 241-A-039 to the inlet 241-A-030, (6) Changing upstream detention structures,
(7) Diverting some upstream flow, (8) Doing nothing.
Among them, Option (6) includes adding new detention structures and fixing the existing detention structures.
3.2.1 Analysis of Options
(1) Increasing pipe sizes of the MPL drainage system
Increasing pipe sizes can drain more water per unit time and prevent overflow, which is the most common method to solve flooding problems. However, the hydraulic model given in Chapter 2 indicated that the pipes in the MPL stormwater drainage system already have sufficient drainage capacity to drain a 10-year return period storm. Hence, increasing pipe size is
considered of low effectiveness.
(2) Adding a new inlet next to inlet 241-A-030
According to the analysis in Chapter 2, inlet 241-A-030 is easily clogged by leaves and other debris because it is located in a roadway sag of a heavily wooded catchment. This clogging problem can reduce the clear area of the inlet and prevent runoff from leaving the road surface and entering the pipe network.To increase the capacity of inlets 241-A-030, a new inlet adjacent to the existing inlet 241-A-030 is an option. A short pipe must be used to connect this new inlet with the drainage system.
(3) Adding an inlet near to the BMP outlet 241-A-039
collect the outflow directly before it reaches the parking lot to prevent the flooding problem. Since the new inlet, like the existing inlets, is subject clogging, addition of a “beehive” inlet is necessary (Hoyt, 2017). This kind of inlet can effectively reduce the amount of clogging from debris that prevents water from entering the system. A new 15” pipe of 84 feet long must be added to connect the new inlet to the existing inlet 241-A-030, as seen in Figure 13 below.
Figure 13: Additional inlet near to the BMP outlet 241-A-039 (4) More frequent cleaning of inlet 241-A-030
(5) Adding pipes from BMP outlet 241-A-039 to drain
According to the analysis, the primary reason for flooding problems is that the outflow coming from BMP outlet 241-A-039 directly discharges into the parking lot. To solve this problem, adding pipes from BMP outlet 241-A-039 to the MPL drain system is a direct solution of the problem by keeping this flow away from the parking lot. Figure 14 shows these two pipes which connect BMP outlet 241-A-039 and inlet 241-A-030. An inlet is needed at the pipe
junction and access point necessitated by the sharp change in slope, and an access hole should be added to the BMP outlet 241-A-039.
As noted earlier, there are two BMP detention structures in this problem, the operating principles of which are not well understood, and the experience of the “BMP” structure has been very disappointing. This background doesn’t offer a basis for confidence in their future
performance. One option to consider, therefore, is a detailed study of these existing detention structures, with a view towards their rehabilitation or replacement as necessary. Additional detention or retention structures may reduce the peak flow reaching to the Manning parking lot when there is a storm.
(7) Rerouting flow
Rerouting the flow to other drainage systems can avoid outflow reaching to the parking lot. After checking the nearby drainage system, the best approach to this rerouting appears to be removing the BMP outlet 241-A-039 and connecting detention structure 241-A-051 to detention structure 241-D-053; the overflow will then discharge into another drainage system by the outlet 241-D-044, as is shown in Figure 15.
Figure 15: New route to drain
(8) Doing nothing
Doing nothing is always an option, which can use fully serve as a benchmark by which to consider other options. If the flooding is not too serious or frequent at this site, and if the other options are prohibitively expensive, this may be the preferred outcome, so that the funds required for other options can be used for more significant problems.
3.3 Comparison of Different Options
The criteria used to evaluate the options consist of: effectiveness, low cost & easy implementation, ease of operation & maintenance, minimal environmental impact, and minimal disruption. Each option, as seen in Table 5, was rated high, medium or low according these
criteria. Green indicates a favorable (high) rating for the option according to the criterion, red is the unfavorable (low) rating, and yellow represents an intermediate (medium) rating.
Table 5: Summary Evaluation of Options Criteria
Options
Effectiveness Low Cost &
Easy Implementation Ease of Operation & Maintenance Minimal Environmental Impact Minimal Disruption
Pipe Additions Most
Favorable
Medium Favorable Favorable Medium
Inlet Additions (next to inlet
241-A-030)
Medium Favorable Favorable Favorable Favorable
Pipe Resizing Unfavorable Medium Favorable Favorable Medium
Inlet Addition (close to BMP outlet 241-A-039)
Favorable Medium Favorable Favorable Medium
Inlet Cleaning Medium Medium Unfavorable Favorable Favorable
Detention structures changing
Unfavorable Unfavorable Favorable Medium Medium
Flow Diverting Medium Medium Favorable Medium Medium
Do nothing Unfavorable Unfavorable Favorable Unfavorable Unfavorable
Option (1), pipe resizing, is considered to have no effectiveness because the hydraulic model has shown that during a 10-year storm, the existing pipe network has adequate capacity. Increasing the sizes would have very little or no effect on removing the water from the site or preventing clogging at the site. This option also has a medium cost and a moderately complex implementation process because it would qualify for procurement through an informal bidding process by contractors. It would cause medium disruption because replacing pipe requires extensive excavation on the parking lot, which will disrupt the pedestrian and vehicle flow.
combined with the existing curb inlet length of 3 ft, will be adequate to pass the peak 10-year event, even if the grates of both inlets are clogged. This option is foreseen to have low cost because the new inlet can be made in-house. It is easy to operate and maintain because once the inlets are in place only regular clean out maintenance will be required. This option has a
favorable minimal environmental impact and disruption, because it only has a little impact on vegetation near to this new inlet and nearly no impact on public traffic.
Option (3), adding a new inlet adjacent to the BMP outlet 241-A-039, is considered effective, because it can reduce the amount of stormwater reaching the Manning Parking Lot. However, it will have medium cost because it is necessary to add a beehive grate inlet to prevent clogging and a long pipe under the parking lot to connect this new inlet and inlet 241-A-030, which will bring some cost. It will cause a medium disruption because the construction site is on the middle of the parking lot and will impact on the pedestrian and vehicle traffic. For operation and maintenance as well as the environmental impact, are favorable, like the second option.
Option (4), more frequent inlet cleaning, has medium effectiveness because the water will still flow through the parking lot and spread about 20 ft near the inlet 241-A-030 (See Appendix C). It also has a low ranking for ease of implementation as well as the operation requirement because of the labor cost to clean up one inlet frequently, which may be unrealistic and perceived as a waste of budget. However, this option is considered to involve minimal disruption and environmental impact, since there is no change to original drainage system and environment as well as the pedestrian traffic.
the environmental impact is considered minimal, and therefore merits a high ranking. The operation and maintenance requirement is minimal. However, the ranking for cost and ease of implementation is moderate because and this project involves significant excavation and long pipe additions, it must be bid for construction using the on-call contractors list. This option also has a medium level of disruption. Since this site is on the middle of Manning Parking Lot and near to the bus station, the implementation process would significantly restrict access to their parking spaces during implementation, and bus detours would be necessary during construction.
Option (6), enhancing or rebuilding upstream detention structures, is considered of unfavorable effectiveness, because of both limited understanding of both the design and as-built specifications of the systems, and the poor performance of the BMP. In addition, as Sally Hoyt suggested, if the pipe size is enough to drain stormwater, increasing capacities of detention facility is unnecessary. It would entail a medium level of impact on the environment and moderate disruption for the public since these detention facilities are large, complex and
underground, which require uproot many trees and the work near the residential areas. The cost and maintenance are favorable because only the routine maintenance is necessary.
because it is likely that it would require no additional maintenance above current levels. The impact on environment and disruption are medium because changing the drainage route will involve the clearance of many trees and much excavation near housing.
Option (8), doing nothing, has, by definition, no effectiveness. It has an unfavorable environmental impact because the flooding problem is aesthetically and environmentally undesirable. It will also continue to cause significant disruption of pedestrian and vehicular traffic. Finally, there is also a safety consideration from injury slipping on ice from frozen floodwaters; apart from the injury itself, this may result in a major lawsuit costs and damage to the university’s reputation. According to a prior case in South Philadelphia, a truck driver who seriously injured his back when he slipped and fell on a snow-and-ice covered warehouse parking lot received a $1.05 million settlement with the owner of parking lot (Saltz Mongeluzzi Barrett & Bendesky 2017). Hence, the university must consider the risk of a $1 million lawsuit as the potential liability of no action and a reputational risk (without even counting the cost of the work that would then have to be done to prevent recurrence!).
3.4 Costs of Different Options
More detailed cost assessment of several options are presented here to permit clearer comparison of options. These include Option (2)—Adding an inlet adjacent to the inlet 241-A-030, Option (4)—Inlet cleaning, and Option (5)—Pipe addition.
For each option, the costs can be divided into two parts—capital cost and long-term operation and maintenance (O&M) cost. Assuming all of these projects have an expected life of 50 years and an interest rate of 2%, the Net Present Value (NPV) of cost can be calculated
according to the Equation 1. In Equation 1, CC represents capital cost, A is annual O&M cost
Equation 1: Annual to Present Value Calculation
3.4.1 Costs of Inlet Addition
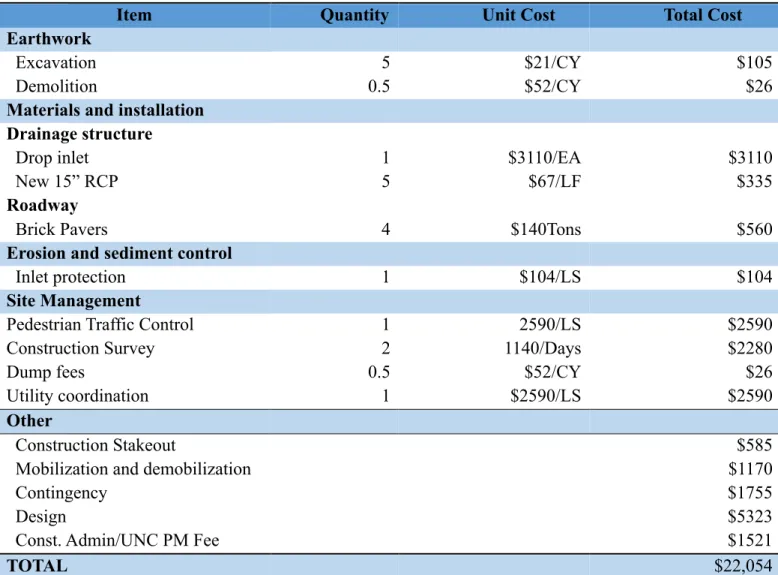
Table 6 shows the capital cost of this plan, which is $22,054. The capital costs of this option consist of earthwork, materials and installation, erosion and sediment control, site management and other costs of construction stakeout, mobilization and demobilization, contingency, design and administration. The earthwork includes demolition for curb on the roadway and excavation for pipe and inlet installation. The required work includes installing a combination inlet, adding a reinforced pipe to connect new inlet with pipe network of MPL as well as paving bricks or concrete for the road curb once project is implemented. The erosion and sediment control includes the inlet protecting to prevent damage to existing inlets within the construction site. Site management includes the costs of pedestrian traffic control, construction survey, dump fees as well as the utility coordination cost which involves having conversation with Energy Service Stream to avoid affecting the normal using of electric utility. Long-term O&M costs are calculated according to annual maintenance cost of the inlet. Two university employees should use one hour to clean the inlet or manhole each time, and the hourly rate for each employee is $42/hour (Hoyt, 2017). Assuming the inlet is cleaned once per year in this project, the O&M cost is $84 per year. The NPV of costs can be estimated by using equation 1. For the time period of 50 years (n=50) at an interest rate of 2% (i=0.02), the NPV is $24,694.
NPVcosts=CC+A*
(1+i)n
−1 i(1+i)n
"
#
$ %
Table 6: Capital costs of the MPL for inlet addition
Item Quantity Unit Cost Total Cost Earthwork Excavation Demolition 5 0.5 $21/CY $52/CY $105 $26 Materials and installation
Drainage structure Drop inlet
New 15” RCP Roadway Brick Pavers 1 5 4 $3110/EA $67/LF $140Tons $3110 $335 $560 Erosion and sediment control
Inlet protection 1 $104/LS $104
Site Management
Pedestrian Traffic Control Construction Survey Dump fees Utility coordination 1 2 0.5 1 2590/LS 1140/Days $52/CY $2590/LS $2590 $2280 $26 $2590 Other Construction Stakeout
Mobilization and demobilization Contingency
Design
Const. Admin/UNC PM Fee
$585 $1170 $1755 $5323 $1521
TOTAL $22,054
3.4.2 Costs of Inlet Cleaning
3.4.3 Costs of Pipe Additions
Table 7 shows its capital cost, which is $62,252. The capital costs include earthwork, materials and installation, professional services, site management as well as the design work, construction administration, contingency, etc. The required earthwork includes excavation for pipe and manhole installation. The materials include the drainage structure materials, such as the two new RCP pipes, one inlet and one access manhole at the pipe connections, and the materials for roadway backfill which include Asphalt and ABC Stone. The costs for professional services include the topographic survey, which would be needed before trench excavation. The site
Table 7: Capital costs of the MPL pipe addition
Item Quantity Unit Cost Total Cost Earthwork
Excavation 111 $21/CY $2331
Materials and installation Drainage structure
New 15” RCP New 15” RCP Manhole Drop Inlet Roadway Asphalt ABC Stone 65 77 1 1 4 18 $67/LF $67/LF $3110/EA $3110/EA $140/Tons $36/Tons $4355 $5226 $3100 $3100 $560 $648 Professional Service
Togographic Survey 1 $10362/LS $10,362
Site Management
Pedestrian Traffic Control Construction Survey Dump fees 1 2 21 $2590/LS $1140/Days $38 $2590 $2280 $684 Other Construction Stakeout
Mobilization and demobilization Contingency
Design
Const. Admin/UNC PM Fee
$1651 $3302 $4953 $15,026 $4293
TOTAL $62,252
3.4.4 Comparison of Costs
According to the comparison of costs of different options (Table 8), Option of inlet additions is the cheapest one. The cost of pipe additions and cost of inlet cleaning are so close.
Table 8: Comparison of costs
Options Interest
rate % (i)
Number of years (N) Capital Costs (CC) Annual O&M Costs (A) NPV
Inlet Additions 2 50 $22,054 $84 $24,694.
Pipe Additions 2 50 $62,252 $168 $67,531
3.5 Recommended Options
CHAPTER 4: RECOMMENDED SOLUTIOS 4.1 Introduction
In the last chapter eight technical options were given and compared according to five different criteria. By this analysis, Option (1) adding pipes from BMP outlet 241-A-039 to MPL drain was recommended as the most preferred solution to address flooding at Manning Parking Lot, since it is the most effective and reliable option. In addition, Option (2) adding a new inlet next to inlet 241-A-030 was chosen as an alternative solution if the university has insufficient budget for Option (1), since it has many advantages over the other options, including the lowest cost, easy operation and maintenance process, minimal environmental impact as well as the minimal disruption.
4.2 First Solution— Pipe Additions
The first solution would include the addition of two pipes, one access hole at BMP outlet 241-A-039 and one inlet at the junction of two new pipes.
4.2.1 Pipes
As shown in Figure 16, two 15” Reinforced Concrete Pipes (RCP) with a combination length of 142 ft would be installed from BMP outlet 241-A-039 to MPL inlet 241-A-030.
A diameter of 15 ft (the minimum diameter of reinforced concrete pipes allowed by the UNC Stormwater-Guideline) is chosen because such pipes have adequate capacities at the available slopes. Additional design details are shown in Appendix D. After adding these two pipes, the flow from BMP outlet would be drained directly into the piped drainage network rather than discharged on the ground, thus solving the flooding on MPL. The specific calculations are given in Appendix D. Figure 17 indicates the HGL profile of these two new pipes and Figure 18 shows the HGL profile of the main pipe network after adding new pipes. Both Figures show profiles calculated by SWMM for the design 10-year storm.
Table 9: The parameters of two new pipes Pipe Location Materials Length(ft) I.D.(in) O.D.(in) Slope(ft/ft) Up
Invert Elev(ft)
Down Invert Elev(ft)
Cover(ft)
New pipe 1
Outlet 241-A-039 to Manhole
RCP 65 15 19 1/2 0.077 372.6 367.6 2
New pipe 2
Manhole to Inlet
241-A-030
RCP 77 15 19 1/2 0.04 366.6 363.8 3
Figure 18: SWMM hydraulic profile: BMP outlet 241-A-039 to MPL outfall (10-year storm)
4.2.2 Inlet and Access Hole
As part of this option, an access hole and inlet would be added at the junction of new pipes. Its primary function is to provide convenient access to the new pipes for inspection and maintenance at the break in grade. In addition, the inlet could also reduce the load on the downstream inlet 241-A-030. Because there will be a potential clogging problem at the inlet, a beehive inlet, as pictured in Figure19 below is suitable to be added. As illustrated in Figure 20, the interior configuration of the inlet includes the box structure and the inlet opening. According to the UNC Stormwater Design Guidelines of Facilities Services 2010 and considering the
elevations and diameters of incoming and outgoing pipes, the interior dimension of inlet could be 3 ft x 2 ft x 5 ft (Length x Wide x Depth).
New Pipes
Figure 19: Example of a beehive grate (http://www.deeter.com/products/beehive-drainage-grates/)
Figure 20: Example of an inlet structure (US DOT 2013) 4.2.3 Access Structure
241-A-039 with the new pipe. According to UNC Stormwater Design Guideline, the length and width of this structure should be at least 3 ft by 2 ft.
Figure 21: Access hole structure 4.3 Second Solution —Inlet Addition
4.3.1 Inlet
The second option, adding a new inlet next to the inlet 241-A-030, would include the addition of a combination inlet which has the grate dimension of 5 ft x 2 ft x 5 ft (Length x Wide x Depth) and the curb opening dimension of 5 ft x 0.43 ft (Length x Height). Figure 22 illustrates the location the new inlet. An extra inlet is intended to increase the interception capacity of inlet, and thus solve the clogging problem of inlet 241-A-030. A short pipe about 5 ft is needed to connect the new inlet with existing drainage system.
BMP Outlet 241-A-039
Figure 22: The location of new inlet
After adding this new inlet, the maximum interception capacity of inlets increases to 30cfs. Even if both of the grates are completely clogged, the interception capacity still has 9.7 cfs (Appendix C), which is greater than the peak flow of 8.6 cfs. In addition, at peak flow,
CHAPTER 5: IMPLEMENTATION PLAN 5.1 Introduction
This chapter presents an implementation plan for the recommended solutions, (either the addition of new pipes, or only the installation of an additional inlet) including information about the review and approval process, design and construction, scheduling, minimization of disruption, resource requirements, long-term operation and maintenance, technical problems, and costs. Because there are two alternative solutions proposed, their different implementation plans are separately discussed.
5.2 Plan 1—Adding New Pipes Review & Approval
Because this is a small project by the classification of UNC Engineering Services Department (ESD), only an internal approval and review within the University will be required, and further approvals by the Town of Chapel Hill, Orange County, or the State of North Carolina are not required. As this project involves stormwater at UNC, the internal approval will be managed by the UNC Stormwater Engineer. In addition, because this project will affect campus parking, it needs to be reviewed by the UNC Parking & Transportation Department (PTD) (Hoyt 2017). The Public Safety Department (PSD) may also need to review the temporary impacts to transportation and their
Design & Construction
The design and construction process depends upon total project cost. As the total cost is estimated to be between $30,000 to $299,999, the project design would be managed by UNC Engineering Services, and the construction would be managed by UNC Construction Services. The construction contract will be offered for bids from list of pre-qualified on-call construction enterprises maintained by the University. Designer can be chosen from Open Ended Design Agreement (OEDA). The designers should meet with the UNC Stormwater Engineers to review the stormwater performance criteria, standards, and procedures. The design and construction process must be approved by UNC staff, but does not need approval from State Construction Office (SCO) or Board of Governors (BOG) (Hoyt 2017).
Scheduling
The scheduling for this project will ultimately be decided by the team implementing it (the contractors) in coordination with UNC. The duration of this project should be a few days at a bare minimum and a couple of weeks at the maximum, depending upon a few factors. Firstly, whether this project would be implemented during the student holidays is a significant factor. Because the construction area is in the middle of the parking lot, if there are many vehicles and pedestrians passing this area during the construction period, the timeline of construction could be significantly affected. Thus, in order to finish the project efficiently, it is best to aim for
construction during one of the student vacations.
Because this is a small project, it is expected can be finished within two weeks to reduce the disruption for public activity. There is a simple Implementation schedule (Rodriguez 2016): Days 1-3: Excavating and preparing for installation of components
Days 4-10: Installation—Adding new pipes, inlet and manhole Days 11-12: Operation test
Days 13-14: Backfilling materials and compacted thoroughly Public Disruption
This project would be implemented in the middle of the parking lot, so some parking spaces cannot be used during construction. Pedestrians, vehicles and buses which need to pass the area under construction would also be significantly affected to solve these problems, ESD needs to pay some money for MPL management department to offset the loss of parking spaces. Moreover, pedestrian and vehicle detour signs must be placed to direct the flow of traffic around the construction site. The work will be near to the R bus stop, so UNC Parking & Transportation Department also need to temporarily change the R bus route.
Resource Requirement & Installation Requirement
Two 15” RC pipes with length of 65 ft and 77 ft, one pre-cast inlet with interior
dimension of 3 ft x 2 ft x 5 ft, one access hole with dimension of 3 ft x 2 ft x 7 ft are required for this project (Table 10). In addition, other resources to construct the project, such as labor,
Table 10: The resource requirement of plan 1
Resource Material Interior Dimension
Pipe 1 Reinforced Concrete 15” x 65’ (I.D x Length) Pipe 2 Reinforced Concrete 15” x 77’ (I.D x Length)
Inlet Pre-cast Concrete 3’ x 2’ x 5’ (Length x Wide x Depth) Access hole Pre-cast Concrete 3’ x 2’ x 7’ (Length x Wide x Depth)
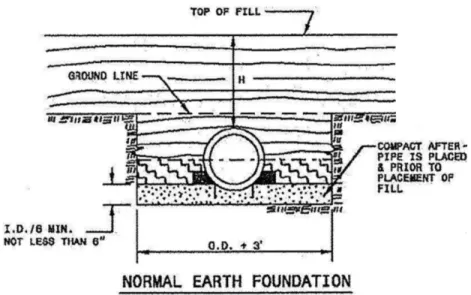
Figure 23 indicates the installation requirement of pipe (NC DOT 2012). The excavated trench for pipe installation should have a width equal to the pipe outer diameter (O.D.) plus an extra 3 ft to allow working room for safe installation and management. Loose materials (class III or class II-Type 1) should be placed under the pipe with a minimum depth of pipe interior
diameter (I.D.)/6 and not less than 6 inches. The backfill materials in class III or class II-Type 1 should be placed below the horizontal line. Above the horizontal line, approved suitable local materials should be used as the top of fill materials. All the backfill material should be placed carefully along the pipe and compacted thoroughly.
Figure 23: Pipe installation details
one small diameter opening (approx. 2 ft) so that the lids can be opened with a metal hook. In addition, each access point shall have steps to the bottom of the deepest elevation. Based on the criteria, the first step shall be located 2 ft below the top of the structure and steps shall be placed at uniform intervals of 12 inches on center.
Long-Term Operation & Maintenance
After finishing the project, long-term operation and maintenance should be managed by the university maintenance zone crews. The zone crews for the MPL are responsible for ensuring that inlet, manhole and pipes are working properly and in good repair, especially after large storm events. The access hole and inlet need to be inspected once per year to check that frames and lids are without cracks and undue wear. In addition, sediment or blockages should be cleaned and removed when problems are identified.
Technical Problems
There are some uncertain factors which could affect the implementation of this project. Firstly, as mentioned before, weather is relevant to the timeline of the project. Adverse weather could make it impossible or unwise to use certain equipment or for crews to work on the site for a time.
Secondly, the soil type layer is another constraint because if it is unsuitable for backfill, new materials will need to be brought in for replacement, which will increase time and cost.
this pipe, so that the final design can be properly determined the requirement for its appropriate management.
Figure 24: Short drain with 4” diameter
Fourthly, the current documentation for the drainage system on campus are very likely inadequate or inaccurate. On the UNC GIS map, the data information was labeled by engineers according to the measurements which are sometimes inaccurate. Also, because of the age of UNC’s campus, engineering documents could be lost over time. The as-built plans may not exist, or may not show what was actually constructed. Hence, there is always a significant level of uncertainty built into any such project.
Finally, during implementation process, accidents could happen. For example, large equipment could break or damage the existing drainage system, which will increase the cost and lengthen the timeline.
Based on the costs analysis in the last chapter, sensitivity analysis was done to determine the impact of interest rate on the future cost. Table 11 and Figure 25 shows that the NPV of costs decreases with the interest rate increasing. When the interest rate ranges from 0.05% to 6%, the NPV will change from $69,668 to $64,890.
Table 11: Sensitivity analysis of NPV with varying interest rates for plan 1
Interest rate % (i) Number of years (n) Annual O&M costs (A) Annual O&M Costs as Present Costs (P) Capital Costs (CC) Net Present Value of Costs
(NPV)
.05 50 $168 $7,416 $62,252 $69,668
1.0 50 $168 $6,585 $62,252 $68,837
1.5 50 $168 $5,880 $62,252 $68,132
2.0 50 $168 $5,279 $62,252 $67,531
2.5 50 $168 $4,765 $62,252 $67,017
3.0 50 $168 $4,323 $62,252 $66,574
3.5 50 $168 $3,914 $62,252 $66,193
4.0 50 $168 $3,609 $62,252 $65,861
4.5 50 $168 $3,320 $62,252 $65,572
5.0 50 $168 $3,067 $62,252 $65,319
5.5 50 $168 $2,844 $62,252 $65,096
Figure 25: Sensitivity analysis of NPV with varying interest rates for plan 1 5.3 Plan 2—Adding Inlet
There are many similarities of the implement plan between the first solution and second solution, thus only the differences between the two solutions will be highlighted in this part. Review & Approval
The second option is also a small project by the classification of UNC ESD and only an internal approval and review within the University will be required. As this project involves stormwater at UNC, it will be approved by the UNC Stormwater Engineer. Besides, according to the utilities map of MPL (Hoyt 2017), there is an underground conductor near the location of new inlet. So this plan may also should be reviewed by Energy Service Stream, Chilled Water, of
$62,000 $63,000 $64,000 $65,000 $66,000 $67,000 $68,000 $69,000 $70,000 $71,000
0.05 1 1.5 2 2.5 3 3.5 4 4.5 5 5.5 6
Ne t P re se n t V al u e o f C o st s (NP V )
Electric Distribution. Moreover, because this project would be implemented on the MPL, which will affect UNC campus parking, it should be reviewed by UNC PTD (Hoyt 2017). Finally, The PSD needs to review the temporary to transportation and their mitigation.
Design & Construction
This project is also designed by UNC Engineering Services and managed by UNC Construction Services. Adding a new inlet is a small project, as it has total costs below $30,000. The new inlet and short connecting pipe can be designed in-house by engineers from OEDA and constructed by University construction shops, such as the plumbing shop or masonry shop. If the university construction shops cannot perform this work, this project can use an on-call
contractor, rather than using the contractor list as a basis for invitations to bid for construction. The design and construction should also be approved by UNC staff (Hoyt 2017).
Scheduling
The team implementing this project (a contractor) in coordination with UNC, will determine the schedule for this project. The factors to affect construction schedule include the weather condition, because this project is also an outdoor construction project and weather can prevent crews from being able to work, limiting the use of equipment, and affecting ground conditions. Besides, when this project is implemented will also impact on the schedule. If it is implemented during the student holidays, the implementation hours will be reduced. This project is easy to be done thus it can be finished within a few days if there are not much traffic
disruption. The simple timeline is shown as following: Days 1-2: Drop a new inlet
Day 6: Backfilling materials and compacted thoroughly Public Disruption
For this project, there will be little public disruption. There would be only 1 to 2 parking spaces lost during construction, so the ESD doesn’t need to pay so much money for loss of parking spaces. In addition, as the work can be completed within one week, the pedestrian and vehicle traffic would not be affected seriously. During the implementation process, the pedestrian and vehicle detour signs also need to be placed on the affected portion of the parking lot and sidewalk.
Resource Requirements
The resources required for this project include one new combination inlet, and a short pipe to connect the new inlet to the existing MPL pipework. Also, the labor with professional tools and equipment are needed.
Figure 26: The combination inlet (US DOT 2013) Table 12: The resource requirement of plan 2
Resource Material Interior Dimension
Pipe Reinforced Concrete 15” x 5’ (I.D x Length) Inlet Pre-cast Concrete 5’ x 2’ x 5’ (Length x Wide x Depth)
Long-Term Operation & Maintenance
The operation and maintenance for this project will also be conducted by university maintenance zone crews, a small group that does preventive maintenance at their zones on an annual basis. The works for university maintenance zone crews include regular inspection and inlet cleaning to ensure that debris is not clogging the grate. Two university employees will use one hour or less to maintain each inlet once per year.
Technical Problems
to an underground cable and a streetlight, during the implementation, it is possible to damage the electric utilities. Thus the full investigation for utility condition and a careful design before the construction is necessary.
Costs
As is shown in Table 13 and Figure 27, sensitivity analysis was done to determine the impact of interest rate has on future costs. The interest rate changes from 0.05% resulting in an NPV of $25,762 to 6% with a NPV of $23,378.
Table 13: Sensitivity analysis of NPV with varying interest rates for plan 2
Interest rate % (i) Number of years (n) Annual O&M costs (A) Annual O&M Costs as Present Costs (P) Capital Costs (CC) Net Present Value of Costs
(NPV)
.05 50 $84 $3,708 $22,054 $25,762
1.0 50 $84 $3,292 $22,054 $25,346
1.5 50 $84 $2,940 $22,054 $24,993
2.0 50 $84 $2,640 $22,054 $24,694
2.5 50 $84 $2,382 $22,054 $24,436
3.0 50 $84 $2,161 $22,054 $24,215
3.5 50 $84 $1,970 $22,054 $24,024
4.0 50 $84 $1,805 $22,054 $23,858
4.5 50 $84 $1,660 $22,054 $23,714
5.0 50 $84 $1,533 $22,054 $23,587
5.5 50 $84 $1,422 $22,054 $23,476
Figure 27: Sensitivity analysis of NPV with varying interest rates for plan 2
22000 22500 23000 23500 24000 24500 25000 25500 26000
0.5 1 1.5 2 2.5 3 3.5 4 4.5 5 5.5 6
Ne
t
P
re
se
n
t
V
al
u
e
(
NP
V
)
CHAPTER 6: FURTHER WORK
Because of time constrains, limited documentation and measuring tools, there are still some problems to be further addressed and resolved in the future.
First, it would be extremely helpful to know whether any of the detention facilities work, and how they are meant to work, so that UNC can explore options using them. In this report, all the calculation and analysis are based on the worst situation— neither of the two detention facilities intended for the MPL operate when there is a 10-year storm. However, in reality, these two detention facilities might in fact have the capacity to store runoff when there is a storm. If the detention facilities can work, the stormwater which inlet 241-A-030 need to intercept is not as much as estimated in this report, which proves inlet 241-A-030 has enough capacity to intercept the passing flow and the flooding is not caused by inadequate interception capacity of inlet. If that’s true, adding a new inlet adds little value in solving the flooding problem and should not then be considered as a backup solution.
seepage, and there is a chance that during all the construction they changed conditions so that seepage is less of an issue (Walters, Glenn, personal communication, 2017). But assessing and addressing this potential groundwater seepage as a cause of icing in the lot is beyond the scope of this hydraulic study. In this report, Options (3)—Adding a new inlet adjacent to the BMP outlet 241-A-039 and Option (5)—Adding new pipes from BMP outlet 241-A-039 to inlet 241-A-030 may solve this problem because both of these two options can intercept some of seepage flow before it runs over the MPL. Somebody at the Energy Facilities Office should check to see this problem by watching for seepage in the spring.
CHAPTER 7: CONCLUSION
APPENDIX A: RATIONAL METHOD
The peak inflows for a rainfall event were calculated according to the rational method in this study. According to US DOT guidelines, for urban catchments that are not complex and are generally 200 acres or less in size, it is acceptable that the design storm runoff be analyzed by the rational method. The following analyses are based on the methods provided in Fort Collins Hydrology Handbook, US DOT guidelines, and Nazih’s Wastewater Engineering Handbook. Equation 2 shows the rational formula to calculate the peak flow (Fort Collins Government 2007).
Equation 2: Rational Method Equation 𝑄 = 𝐶𝐼𝐴
Where Q= the maximum rate of runoff (cfs)
C= a runoff coefficient that is the ratio between the runoff volume from an area and the average rate of rainfall depth over a given duration for that area
I = average intensity of rainfall in inches per hour for a duration equal to the time concentration, tc
A =area (acres)
The Equation 2 shows that in order to determine the maximum rate of runoff, rainfall intensity, runoff coefficient and drainage area should be identified.
A.1 Runoff Coefficient
Table 14: Runoff coefficient for rational method (US DOT 2013)
For an area including different land covers, a composite coefficient can be calculated through Equation 3.
Where x= Subscript designating value for incremental areas with consistent land cover. Table 15 shows the areas and runoff coefficient for different tributary catchments on MPL.
Table 15: Area and runoff coefficient for tributary catchments on MPL Sub-basin Total
Area (acre)
Runoff coefficient
A 1.39 0.48
B 0.58 0.56
C 1.20 0.69
D 0.35 0.44
E 0.3 0.44
A.2 Rainfall Data
Table 16 shows the precipitation data of rainfall intensity, duration and frequency according to the record from National Oceanic and Atmospheric Administration (NOAA). The IDF curves can be observed in Figure 28. Rainfall intensity is uniform over a time duration which equals to the time of concentration, tc. In this study, the rainfall intensity should be gained from the IDF curve of 10-year storm according to the time of concentration.
Table 16: Rainfall intensity, duration and frequency (NOAA 2016) Precipitation frequency estimates with 90% confidence intervals
(in inches/hour)
Duration
Average recurrence interval (years)
1 2 5 10 25 50 100
5-min 4.92 5.80 6.67 7.37 8.10 8.62 9.07
10-min 3.94 4.64 5.34 5.89 6.42 6.84 7.20
15-min 3.28 3.89 4.52 4.96 5.44 5.80 6.08
Figure 28: IDF curves for the MPL site (NOAA 2016)
A.3 Time of Concentration
Time concentration (tc) is the time required for an entire watershed to contribute to runoff at the point of interest for hydraulic design. For urban areas, the time of concentration consists of an initial overland flow time, ti, plus the travel time, tt, in the storm sewer, paved gutter, roadside drainage ditch, or drainage channel. It can be represented by Equation 4.
Equation 4: Rational Method Equation 𝑡0 = 𝑡1 + 𝑡+
Where tc = time of concentration (minutes) ti = initial of overland flow time (minutes)
tt = travel time in the ditch, channel, gutter, storm sewer, etc. (minutes)
most remote part of the drainage area to the first inlet. The initial overland flow watershed area is shown in Figure 30. The characteristic of this area is shown in the Table 17 which can contribute to determine the initial overland flow time from Nomogram.
Figure 30: The initial overland flow Table 17: Characteristics of initial watershed
Characteristic Parameter
Runoff Coefficient (C) 0.41
Distance of Flow (L) 228 ft
Slope (S) 0.15 ft/ft
Time (T) 15 min
A.4 Travel time
The travel time includes the time of flow through the pipes and the open watercourses on the ground. The time of flow through the pipe is calculated using Equation 5:
Equation 5: Time of flow through pipe equation
𝑡 =𝐿 𝑣
L= length of pipe
v= flow velocity through pipe (ft/s)
The flow velocity through pipe can be determined through the inflow Q of each pipe. Q is calculated according to rational method for each segment. then flow velocity can be estimated from Figure 31 (US DOT 2013). There are 9 pipes are used to calculate the travel time, which are shown in Figure 32. The initial overland flow enters the drainage system through the inlet of pipe 6, then travels through the pipe 7, 8, 9, 10 and 11 and is discharged by detention structure outlet. Next, the outflow enters the MPL drainage system and travels through pipe 1, 2, and 3. Finally it is discharged by outfall of MPL, the travel time for each pipe is shown in Table 18.
Figure 32: Flow traveling route Table 18: Travel time in different drains
Pipe tch (min)
1 0.07
2 0.1
3 0.03
6 0.1
7 0.1
8 0.1
9 0.09
10 0.03
11 0.1
Because flow discharged by outlet 241-A-039 runs over the ground then enters into MPL drainage system by inlet 241-A-030. The total travel time includes the period during flow
distance (less than 400 ft) and have the uniform depth across the sloping surface. The travel time on this distance can be calculated by using Equation 6.
Equation 6: Sheet Flow Travel Time
𝑇 =0.933 𝐼:.;
𝑛𝐿 𝑆
:.>
Where T= sheet flow travel time (minutes) n= roughness coefficient (see Table 19) L= flow length (ft)
I= rainfall intensity (in/hr) S= surface slope (ft/ft)
As mentioned before, the flow traveling distance can be divided into two segments— from BMP outlet 241-A-039 to the bottom of the hill and from the bottom of the hill to the inlet of MPL drainage pipe network. Table 20 shows the total sheet flow travel time calculated by using Equation 6 and different parameters.
Table 20: Sheet flow on the ground travel time
Segments Manning
Coefficient
Length (ft)
Slope (ft/ft)
Rainfall Intensity (in/hr)
Sheet Flow Travel Time
(min) BMP outlet to the bottom of hill 0.24 58 0.03 4.78 4
The bottom of the hill to inlet 0.011 84 0.1 4.4 1
Total / / / / 5
Using Equation 3, the time of concentration can be calculated as the sum of the initial overland flow time and pipe flow travel time as well as the sheet flow on the ground travel time, which is about 21 min. Once the tc value has been calculated the rainfall intensity can be
APPENDIX B: CHECKING PIPE SIZE
B.1 Checking Pipe Sizes by Calculation
To determine whether or not the current drainage system can handle the site flow, it is significant to access the normal flow capacity of the pipes in the existing network. Using Equation 7, the Manning Equation, the capacity of pipe can be calculated according to the pipe characteristics (US DOT 2013).
Equation 7: Manning Equation (Expressed in the discharge form)
𝑄 = 1.486
𝑛 𝐴 ∗ 𝑅:.>E∗ 𝑆:.F
Where Q= Discharge rate (ft3/s)
A= Cross sectional flow area (ft2)
R= Hydraulic radius, A/P (when pipe is full, it is d/4.) (ft) P= Wetted perimeter (ft)
S= Energy Grade line slope (ft/ft) n= Manning’s roughness coefficient
Assuming pipes are full of flow, the discharge rate can be calculated based on the pipe sectional area, diameter, slope and roughness coefficient (Table 21). This discharge rate
Table 21: Pipe sizes checking for 10-year storm
Pipe
Actual
Diameter Length Slope n (full) Q
Q (required)
in ft ft ft/ft (cfs) cfs
1 15 1.25 86 0.0944 0.012 21.5 7.5
2 24 2 26 0.0954 0.014 75.7 9.9
3 24 2 24 0.012 0.012 70.6 14.1
4 12 1 243 0.0449 0.012 8.17 1.1
5 12 1 265 0.0356 0.012 7.28 0.8
B.2 SWMM Modeling
Rainfall modeling should be done to access more detailed calculation pipe size contributions to flooding. Modeling by SWMM are based on the SCS Hydrograph (US DOT 2013), which is shown in Figure 33. The top of curve represents peak flow, and tp on the graph equals to the time of concentration. Figure 34 shows the SWMM model background, Table 22 and Table 23 and Table 24 separately show the nodes, conduit and Time series input data for SWMM model.