UNC-Chapel Hill DCRP Best Master’s Project of 2009
Evaluation of Environmental Effects of Songpa
New Town in Seoul, Korea
Jun Huh
The purpose of this research is to examine the environmental effects of the proposed Songpa new town
development built along the urban growth boundary in South Korea. The project evaluates the proposed
development plan from an environmental perspective, which can be easily ignored during a planning process.
With the logistic regression model considering accessibility and physical constraint factors, future development
in the proposed new town and infill development in two existing alternative areas are simulated based on the
assumption that future development will follow past development patterns. The project examines changes in
runoff volume directly affecting water quality and flooding in and around the study areas. Pre-development
and post-development runoff volumes are estimated through hydrologic analysis using land use, soil type, and
average rainfall data.
Editors’ note: Portions of this feature have been edited or cut due to content and space considerations. If you are interested in reading the original, unedited document, please contact the editors at [email protected]. Introduction
The rapid accumulation of people in mega-cities has caused major problems in the fields of housing, basic services, and transportation (Hall, 1984). Moreover, from an environmental point of view, increased impervious surfaces resulting from urbanization have threatened natural environments by reducing the amount of forest lands, wetlands, and other forms of open space that absorb and clean stormwater in the natural system (Brabec, 2002). As one of the mega-cities in Asia, Seoul, the capital of South Korea, has faced these problems whenever new development plans within the city boundary are proposed.
Seoul has experienced unprecedented changes in population as well as in urban structure. According to the Seoul Metropolitan Government, by 1963 the population grew to about three million and the jurisdictional territory accordingly expanded to the current area of about 600 km2,
2.3 times larger than before. The population of the city has grown further with the southern development programs of the late 1960s and 1970s, which saw the development of high-rise apartment buildings along the Han River. As a result, the southern districts of the Han River expanded rapidly, now with a similar population size to the northern districts. At present, the population in Seoul is over 10
million inhabitants, which is 25% of the total population of South Korea.
The intense concentration of population in Seoul has caused various urban problems such as skyrocketing housing prices, particularly in southern districts; lack of transportation systems; and environmental disruption. The National Comprehensive Physical Plan of July 1970 established 1,567 km2 of an urban growth boundary called
Greenbelt along the circumference of Seoul, mostly composed of forest and woodland (Yokohari, 2000). Its primary purposes were to prevent sprawl, protect the surrounding natural environment, reduce air and water pollution, and provide for recreational areas. The Seoul Greenbelt has been evaluated as a successful plan in achieving these goals due to strong legal control.
Furthermore, in an effort to disperse the dense population of Seoul, the Korean government has established several new satellite cities including the Seongnam, Bucheon, Gwacheon, Bundang and Ilsan areas. Despite these efforts, Seoul has been experiencing rapid population concentration, and the demand for housing in Seoul still exceeds the supply. The government is planning to partially
Jun Huh is a doctoral candidate in City and Regional Planning at
Literature Review
In order to find the best model to apply to the Songpa new town case, this chapter examines and evaluates various models to forecast future urban growth and assess the environmental effects of development. In terms of how the development of Songpa new town would influence the environment, it is important to start with a prediction of urban growth because a specific plan of the new town is not yet released; this study addresses two alternative scenarios in different locations to compare with Songpa new town. In addition, the paper also reviews preceding studies examining the relationship between urbanization or new development and the physical and potential environmental impacts.
Urban growth model
[Editors’ note: Only the model pertaining to this study was retained for publication, due to space limitations.]
California Urban Future (CUF) model
John Landis developed two GIS-based urban models called CUF-1 and CUF-2. CUF-1 model projects the location, pattern, and density of residential population growth. CUF-2 model supplemented CUF-1 model and was limited to residential development, without projecting and/or allocating future industrial, commercial, and public activities (Landis, 1998). CUF-2 model added the process of calibration that had been omitted from CUF-1. The model creates calibration equations from the past urbanization patterns and projects future development using the development pattern, assuming that the past development patterns will continue into the future. Calibration of the model uses the multinomial logistical regression with variables including land use/land cover, topography, transportation network, hydrography, jurisdictional bounds, wetlands, population and employment levels. The estimated coefficients are used to calculate future probabilities of grid cells being converted to each of the 10 different density categories. Based on environmental, locational, or other policy characteristics such as urban growth boundaries, flood zones, and wetlands, particular grid cells are precluded from development regardless of their development probability. Projected population or housing growth is allocated to non-excluded cells.
Methodology
The major methodology of this paper consists of an urban growth model and an environmental effects analysis. Through the two processes, the paper examines how urbanization will occur because of new development and how the change will affect the natural environment.
Binomial logistic regression
Urban growth simulation of this research is based on the CUF model created by John Landis and draws on equations to project future development from past urbanization patterns. However, this research utilizes a lift the Greenbelt and build a new town called “Songpa
New Town,” accommodating 50,000 housing units with over 100,000 residents in about 7 km2 of a southern district
of Seoul. Its primary purpose is to increase the housing supply and stabilize high-priced housing values in the southern district of the Han River.
As for whether the new town should be developed or not, the plan for the new town has been met with strong opposition from the Seoul government and several citizen groups representing economics and the environment. The construction of Songpa new town has been under debate over the appropriateness of the new town’s location, as well as traffic congestion, environmental problems, and unbalanced development that would be generated between the northern and southern districts of the Han River. Seoul Council and citizen groups have been asserting that development of the new town would bring excessive speculation in real estate rather than stability of housing values, and it would cause destroyed natural landscape from forest destruction.
Moreover, it is expected that the new development will aggravate current severe air pollution from traffic congestion. The primary reason is that the developments surrounding the proposed new town have already progressed and are almost completed. In addition, the new town would abet more automobile trips within Seoul because it was designed to accommodate residents who are expected to commute to work in Seoul. In this regard, the environmental and civic groups support retention of the urban growth boundary and consider the current proposed new town development to be premature.
For the current proposed new town plan, this paper focuses on the environmental effects of the development. In particular, this study’s main interests are open space, including forest and agricultural land, and run-off by increased impervious surfaces on the development areas. Based on the background of Seoul and the environmental interests in development of the new town, this research presents answers to two primary questions: “How would the development change the pre-development open space into built-up land?” and “How would the development affect the change of [sedimentation] run-off?” It is important to deal with these questions because open spaces within Seoul have been decreasing so that there are now insufficient green spaces that Seoul citizens can use for the purposes of recreation. What is more, it is worth analyzing the changes in run-off, in that the increased impervious surfaces from the development increases the possibility of flooding in the areas adjacent to the Han River and exacerbates poor water quality by the reduction of open space.
simplified binomial logistic regression approach to model future residential growth by detecting a historic urban change, in place of the multinomial logistic regression used in the CUF model to consider the conversion among other land-use types and redevelopment. The main reasons to use binomial logistic regression are that the new town plan is mostly designed to develop residential units and the surrounding open space for recreational purposes. Redevelopment and other land uses are beyond the interest of the paper.
Moreover, the project uses the limited variables available to calculate the urban growth probability of each cell to be developed. Explanatory variables that account for future residential development include distance from existing cells and distance from major roads as accessibility indicators, and elevation and slope as natural and physical constraint indicators. Coefficients of explanatory variables are calculated by using binomial logistical regression where a dependent variable can take one of two values, 0 or 1, for undeveloped cells and developed cells. Using this equation, the future urbanization probability of each cell within proposed development areas is calculated for determining which cells will be developed.
Binomial logistic regression, used when a dependent variable is a dichotomy, is described by the following general equation: exp(y) 1 1 1 P P 1 P ln P P ln y x b ... x b x b x b a y 1 1 1 2 1 n n 3 3 2 2 1 1 + − = − = = + + + + + =
equal to the desired future area. Finally, this study analyzes and compares the change of land cover by examining what kinds of open space will be changed into developed cells.
Hydrologic analysis
As an environmental indicator that affects water quality and flooding, run-off volume is quantified based on the curve number for soil types and land use types. This approach was first proposed by Soil Conservation Service (SCS) and was further developed by Pandit and Goppalakrishnan (Whitford, 2001). The equation of run-off derived from the results of empirical studies on many small watersheds is as follows:
S
P
S
P
P
e8
.
0
)
2
.
0
(
2+
−
=
where Pe is run-off; P is the precipitation; and S is the maximum potential retention of the catchment. S is also described by the following expression:
where x1, x2, x3….xn are explanatory variables, b1, b2, b3…bn
are regression coefficients to be estimated, and y is a linear combination function of the explanatory variables. In this case, P1 means the probability of a transition from rural to
urban land uses. A positive sign of an explanatory variable indicates that the variable increases the probability of cells to change into urban; on the other hand, a negative sign is the opposite. In addition, as a way to assess the goodness-of-fit of the regression model, the paper calculates the percentage of observations correctly predicted.
In this paper, an urban growth probability map is generated by the results of the binomial logistic regression model reflecting the development patterns at two points in the past. The total number of cells to be developed is controlled on a basis of the desired developed land area calculated from the planned number of people to be accommodated, and the proposed density in a new town plan. Based on the urban growth probability map, transition from rural to urban occurs starting with the highest probabilities until the number of developed cells is
where CN is the curve number of the particular type of watershed.
The curve number is a function of land use, soil type, and soil moisture used to describe the stormwater runoff potential for a drainage area. For an area with multiple land covers, a weighted curve number can be calculated if the soil type and percentage cover of each land use are known (Chow, 1988; Whitford, 2001). SCS defined 13 land-use categories and classified over 8,500 soil series into four soil groups according to their infiltration characteristics for hydrologic analysis. The 13 land-use categories include three residential land uses with high density, medium density, and low density; commercial; industrial; disturbed or transitional; agricultural; open space; meadow; woods with thick cover; woods with thin cover; impervious; and water. The hydrologic groups are designated as A, B, C, and D: Group A has a low run-off potential and high infiltration rate, such as sands and gravels; Group B has a moderate infiltration rate; Group C has a slow infiltration rate; and Group D has a high run-off potential and very slow infiltration rate.
The study areas used in this paper consist of a variety of soil types and land uses so that the weighted curve number is used for hydrologic analysis. The weighted curve number is described by the following equation:
where CNw is the weighted curve number; CNi is the curve
number for each combination of land use and soil group; and Ai is the area for each combination of land use and
soil group. Based on the run-off calculated by the above equations, the paper compares the run-off between pre-development and post-pre-development and analyzes how the development affects the change in run-off volume because of increased impervious surfaces.
Study Materials
Study area
Reflecting previous research asserting that urbanization can have different effects depending on where and how land-use change has occurred (Jantz, 2003), this paper chooses three study areas: Songpa district, where the Songpa new town will be built, and two alternative areas, Eunpyung and Bundang districts. Urban growth in the alternative districts is simulated, assuming that the development will occur at the same size as the Songpa new town plan.
Songpa district
Songpa district is one of the 25 districts that make up the city of Seoul and has about 650,000 residents, the highest population among the districts in Seoul. The district is located about 15 km from central business district (CBD) of Seoul and bordered by the Han River to the north, Tancheon stream to the west, and Greenbelt to the south. In 2005, the Seoul city government decided to build a new town called ‘Songpa New Town’ to accommodate over 100,000 residents. The new town plan centers on two neighborhoods in Songpa district, Geoyeo-dong and Jangji-dong, and a neighborhood in Sungnam district, Bukjung-dong. Some areas in the new town plan lie within the urban growth boundary. Therefore, the proposed new town project is based on removal of green space, including
the existing military service area, and the urban growth boundary.
The plan could not proceed because of the removal of the existing greenbelt, as well as because of the worsening current state of unbalanced development north and south of the Han River. Furthermore, environmental groups have raised problems related to air quality, water quality, and flooding in the adjacent Kangdong district. It is inevitable that development will cause severe traffic congestion because the new town is adjacent to the existing large residential town. Furthermore, it is also possible to expand the boundary of Seoul due to excessive influx to the new town and additional development around the new town.
Eunpyung district
As an alternative to the Songpa new town, the paper examines Eunpyung district which is located north of the Han River and on the north-west border of the city of Seoul. About 50% of the total area of the Eunpyung district fell under the urban growth boundary; in addition, a lot of green space was preserved compared to other districts until the Korean government revised the urban growth boundary in 2004. After the revision, the Eunpyung new town plan was proposed to accommodate about 40,000 residents in Jinkwan-dong, and the first phase to accommodate 10,000 people is now under way. Eunpyung district is also expected to be under additional development pressure after completion of the Eunpyung new town plan.
The reasons why this paper considers Eunpyung district as an alternative to Songpa new town are threefold. First, Eunpyung district is located about 10 km away from Seoul CBD, Jongno district, and on the border connecting the city of Seoul with Goyang in Gyeonggi Province. These geographical conditions provide good access to Seoul CBD, where the politics, economics, culture, and history concentrate, as well as enable Eunpyung district to
Figures 1, 2, 3: The results of simulation in the Songpa, Eunpyung, and Bundang districts (left to right, respectively).
Data sources
Data used in this paper for input into the urban growth model and run-off estimation include Landsat TM of 1990, Landsat ETM+ of 2000, 1:25,000 topography map of 1998, soil map of 1998 and land cover map of 2001. Remote sensing data are classified by using an unsupervised classification algorithm through the Erdas Imagine 9.1 package named Iterative Self-Organizing Data Analysis Technique (ISODATA). The ISODATA clustering technique is the way to create clusters through the process to begin with arbitrary cluster means, calculate a new mean for each cluster by each iteration, use the new mean to define clusters for the next iteration, and finally complete the process when the number of pixels changing clusters are fewer than a certain threshold specified in the initial setting. The paper reclassified 16 classes, created from the unsupervised classification method, into three land cover types: water, urban, and rural. In order to reduce classification errors, the research revises classified images based on the original image data of 1990 and 2000 and a land cover map that was produced by the Ministry of Environment in 2001. All data sets are created through ArcGIS based on spatial resolution of 10m.
The classified data from remote sensing images are used to make the observed growth, which is the dependent variable, between the two time periods (1990 and 2000 in this case). Water area is not used in the logistic regression but is used to exclude future development in the urban growth model. The classified data from Landsat TM and Landsat ETM+ are also used for independent variables in the urban growth model to represent proximity to developed cells that influence growth. The topographic map (1:25,000) produced in 1998 is used for extracting roads and DEM. The paper ignores influence from new roads after 1998 because there is only one [piece of] road data available for use in this project. Slope is determined based on elevation, through the ArcGIS program. Soil types and land-use types, which are used to calculate the weighted curve number for run-off, are respectively reclassified into four groups according to the standard of SCS and into eight groups to match the land cover map of 2001 to the land use categories of SCS. Since residential land use is not classified by density in the land cover map and single-family homes occupy less than 10% of the total housing units in the study areas, the paper assumes that residential land use in the study areas is based on high densities.
Variables
This paper uses limited data due to the difficulty of obtaining useful data to apply to this model. Simulating more realistic future urban growth may require more variables: public transportation facilities such as bus stops and subways; amenities including parks and public libraries; information on infrastructure such as water and sewer lines; and other factors that can be selected based on residents’ preferences, such as locations of notable schools. play an important role as the entrance to the city of Seoul.
Second, the Korean and Seoul metropolitan governments have been encouraging development and redevelopment in the northern areas of the Han River in order to achieve balanced development between the south and north of Seoul. New town development and redevelopment within the Eunpyung district are expected to increase tax revenue, provide better residential environments, attract excessive demand for living in the southern area of the Han River, and finally solve disparity of housing prices and residential conditions between the north and south of the Han River. Last, Eunpyung new town has seen decreased development over the last 30 years due to development restrictions by the urban growth boundary compared to other districts in the northern area of the Han River. The natural environment that has been preserved for 30 years can facilitate sustainable development in the Eunpyung district by developing lands that are available for residential and commercial uses while at the same time preserving vulnerable and sensitive natural environment to the utmost.
Bundang district
Bundang district, the second alternative to Songpa new town, has been evaluated as a successful satellite city about 22 km from the Seoul CBD. At present, Pankyo new town development was planned as a self-sufficient neighborhood in the Bundang district and [was] completed in December 2009, not only providing residential dwelling units to accommodate about 80,000 residents but also creating jobs in high-tech industries and research institutes. The first reason to choose Bundang district as the alternative is that the district has been considered a more pleasant place to live than other districts in Seoul in terms of environmental, economical, educational, and recreational conditions. Second, new infill development in Bundang district would also facilitate the desired results of preventing accumulation of people in Seoul. Third, this district can avoid the current problems related to the extension of the urban growth boundary, which is a prerequisite for Songpa new town development. Finally, improved rapid mass transit systems that are in progress would reduce car dependency and provide prospective commuters with easier access to their work in Seoul.
In binomial logistic regression to simulate urban growth, the paper uses the observed growth between the two time periods as the dependent variable; and distance from the existing developed area, distance from the road, elevation, and slope as the independent variables. Therefore, the binomial logistic regression used in this model can be described as follows:
where P1is the probability of a rural to urban transition, urbdist is the shortest distance from the existing area, roaddist is the shortest distance from the existing road, dem is elevation, and slope is the degree of slope.
[Editors’ note: Brief descriptions of accessibility and physical constraint factors were removed for space considerations.]
Results
The results of the logistic regression model
Assuming that future urban growth is influenced by the current growth pattern in each administrative district, a logistic regression is executed for each of the three districts: Songpa, Eunpyung, and Bundang districts.
Songpa district
The logistic regression in Songpa district is executed based on the dependent variable and the four independent variables extracted from the boundary of Songpa district. The observed growth between 1990 and 2000 is used as a dependent variable, while distance from the existing urban areas and roads, elevation, and slope are considered the four independent variables. As a result of the logistic regression, all independent variables are very statistically significant at the 95% confidence interval. All coefficients of the variables have a negative sign which means that nearer distances to urban areas and roads, lower elevation,
and gentler slope increases the probability that land uses change from rural to urban. The model’s goodness-of-fit indicates that 58.45% of developed cells and 81.62% of undeveloped cells are correctly classified. Overall correctness for classification is 72.45%.
Eunpyung district
Like the logistic regression in the Songpa district, the binomial logistic regression is executed based on the variables extracted from the Eunpyung district boundary. As a result of the regression, all independent variables for the Eunpyung district are very statistically significant and all the variables’ coefficients have a negative sign. Goodness-of-fit of the model shows that 64.94% of developed cells and 97.62% of undeveloped cells are correctly classified, while 94.95% of cells are correctly classified overall.
Bundang district
The result of the regression indicates that all variables are statistically significant at the 95% confidence level and all the independent variables have a negative sign of coefficient like the models of other districts. In terms of goodness-of-fit, 41% of developed cells and 93.47% of undeveloped cells are correctly classified. Overall, 87.48% of cells are correctly classified.
The results of simulation of future urban growth
The probability map for each district
Based on the results of the regression model, urban growth probability maps for each district can be created to simulate future development. The maps show the probability both within each district and within neighborhoods to be simulated. The paper assumes that future development in Songpa district will occur only in three neighborhoods that lie within the Songpa new town area: Geoyeo-dong, Jangji-dong, and Bukjung-dong. Similarly, the paper also considers only two neighborhoods in Eunpyung district including Jinkwannae-dong and Jinkwanoe-dong as simulated areas for future development. The reason to choose these two neighborhoods is that they were released
slope b dem b roaddist b
urbdist b
b P P
4 3
2 1
0 1 1 1
ln = + + + +
−
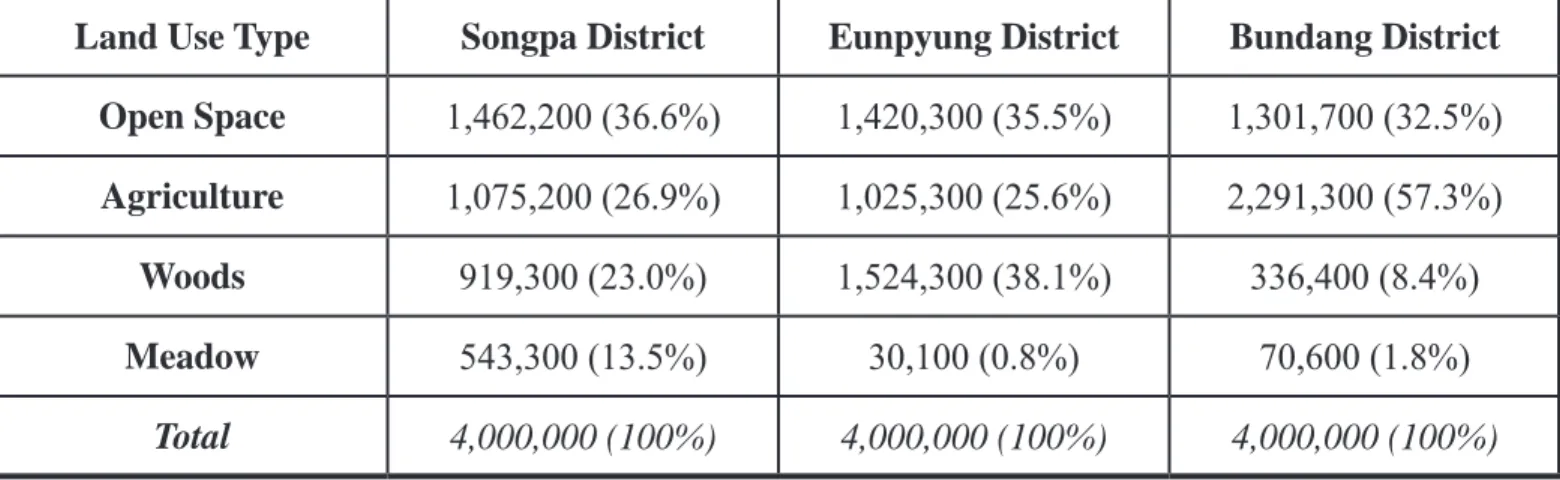
Table 1: Composition of newly-developed areas (unit: m2).
Land Use Type
Songpa District
Eunpyung District
Bundang District
Open Space
1,462,200 (36.6%)
1,420,300 (35.5%)
1,301,700 (32.5%)
Agriculture
1,075,200 (26.9%)
1,025,300 (25.6%)
2,291,300 (57.3%)
Woods
919,300 (23.0%)
1,524,300 (38.1%)
336,400 (8.4%)
Meadow
543,300 (13.5%)
30,100 (0.8%)
70,600 (1.8%)
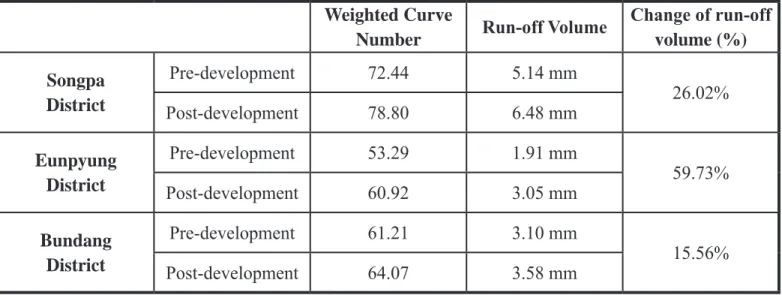
development. Finally, in Bundang district, 0.48 mm of additional run-off volume is generated by simulated new development, causing a 15.56% increase in run-off volume. Discussion
Assuming that future development follows the past development patterns in each administrative district, this paper predicts the future development in Songpa new town, as well as in two alternative areas, to identify how the new development will alter existing land uses. In addition, this study tries to examine how the future development in different areas will affect run-off volume that is directly related to flooding and water quality. Although the binomial logistic regression model used in this study does not offer extremely accurate predictions, shown by the slightly low goodness-of-fit for developed cells ranging from 41% to 61%, the model provides approximate predictions with available limited dependent variables, showing overall goodness-of-fit over 72% and negative signs of coefficients as expected. Moreover, the results of simulation to transform undeveloped cells to developed cells show that the closer the proximity between study areas and existing urban cells and roads, the more transition from rural to urban occurs. At the same time, lower elevations and gentler slope indicate a greater probability of change as well.
The results of estimation for run-off volume show that changes in run-off volume vary according to locations, soil types, and land-use types. The simulated area in Bundang district shows the lowest increased rate in run-off volume compared to pre-development status, likely because there are still a lot of undeveloped areas of open space, meadow, woods, and agricultural land even after new development. On the other hand, the alternative area in Eunpyung district results in the highest increased rate in run-off volume compared to Songpa new town. The remarkable gap between Eunpyung district and Songpa from the urban growth boundary in 2004 and continue to be
under additional development pressure. Finally, simulated neighborhoods in the Bundang district are four of 19 neighborhoods in the district: Yatap-dong, Imae-dong, Seohyun-dong, and Pankyo-dong. These neighborhoods were chosen because they are closer to Seoul than other neighborhoods in the district.
The future urban growth for each district
Assuming that Songpa new town will be developed to accommodate 100,000 residents with a density of 227 per hectare, the paper changes 40,000 of rural cells into the residential land use. Figures 1, 2 and 3 (page 62) demonstrate how the transition in each simulated area occurs.
Table 1 shows which land use types of undeveloped area change into urbanized areas. In Songpa district, 36.6% of the newly developed area is open space, followed by agricultural land use, woods and meadow. New development in Eunpyung district transforms 1.5 km2 of
woods and 1.4 km2 of open space into residential land use.
Unusually, in Bundang district, the change of agricultural land use occupies over half of newly developed areas, followed by transition of open space (35.5%).
The results of estimation of run-off
Through the SCS weighted curve number method, the paper estimates direct run-off volume in each simulated area for pre-development and post-development. Table 2 shows run-off volume of pre-development and post-development in simulated areas for storms of 12mm, which is a typical heavy rainfall for Seoul. As a result of estimation of run-off volume, new development in Songpa district causes 1.34 mm of additional run-off volume for 12 mm rainfall, which is a 26.02% increase in run-off volume. On the other hand, new development in Eunpyung district generates 1.14 mm of additional run-off volume for 12 mm rainfall, with a 59.73% increase in run-off volume by new Table 2: Run-off volume of simulated areas.
Weighted Curve
Number
Run-off Volume Change of run-off
volume (%)
Songpa
District
Pre-development
72.44
5.14 mm
26.02%
Post-development
78.80
6.48 mm
Eunpyung
District
Pre-development
53.29
1.91 mm
59.73%
Post-development
60.92
3.05 mm
Bundang
District
Pre-development
61.21
3.10 mm
district comes from a different composition of soil types in the newly developed cells. In Eunpyung district, 57.5% of newly-developed cells are green space under hydrologic soil group ‘A’ and only 0.54% of new development cells are green space under hydrologic soil group ‘D,’ while in Songpa district 36.3% of newly-developed cells are green space belonging to soil group ‘A’ and 25.4% of new development are undeveloped areas under soil group ‘D.’ As undeveloped areas under soil group ‘A’ (high infiltration rates) change into urbanized areas that are characterized by high curve numbers, it is natural for run-off volume to increase. However, current run-off volume in Songpa new town area is very high compared with other simulated areas. The result may come from the existing urbanized areas adjacent to Songpa new town.
Conclusion
The purpose of this paper is not to say that Songpa new town plan should be withdrawn. The paper also cannot conclude that new development should be built in one of the two alternative areas because there are many factors to be considered for new development, such as demand, infrastructure to accommodate residents, the existing transportation system, and the available budget of administrative districts, to name a few.
The real purpose of this paper is to consider the environmental effects of new development that can be easily ignored. Through the process of predicting future growth, realistic evaluation of environmental effects may be conducted even in initial phases of a new development plan. In order to make the study more accurate, it is necessary to collect more useful data that affects future growth, such as amenities not only in newly-developed areas but also in surrounding areas, infrastructure data, public facilities, and consumers’ preferences. Since this paper uses remote sensing images of 1990 and 2000, Eunpyung new town and Pankyo new town, which are under construction, cannot be considered seed cells affecting surrounding undeveloped cells in identifying the past growth patterns and projecting the future growth. Therefore, simulated future growth might occur at developed cells in 2008 and 2009.
Furthermore, a variety of studies for environmental effects are needed to more specifically verify how new development affects the natural environment. In this paper, additional studies are necessary to find out how an increase in run-off volume affects water quality and flooding in the proposed area or the surrounding areas.
References
Alberti, M. & Paul, W. 2000. An Integrated Urban Development and Ecological Simulation Model. Integrated Assessment, 1, 215-227.
Batty, M. 2005. New representational models for
simulating multiscale urban dynamics. Environment and Planning A, 37, 1373-1394.
Brabec, E., Schute, S., & Richards, P. L. 2002. Impervious
Surfaces and Water Quality: A Review of Current Literature and its Implications for Watershed Planning. Journal of Planning Literature, 16, 499-514. Clarke, C. K., Hoppen, S., & Gaydos, L. 1997. A
Self-modifying Cellular Automaton model of
historical urbanization in the San Francisco Bay Area. Environment and Planning B: Planning and Design, 24, 247-261.
Conservation Council of South Australia. 2007.
Submission on Urban Growth Boundary Extension Proposal, 1-11.
Glaeser, E. & Matthew, K. 2003. Sprawl and Urban Growth. National Bureau of Economic Research, 1-55.
Hall, P. 1984. The World Cities. London: Weidenfeld and Nocolson.
Jantz, C. A. & Goetz, M. K. 2003. Using the SLEUTH urban growth model to simulate the impacts of future policy scenarios on urban land use in the Baltimore Washington Metropolitan Area.
Environment and Planning B: Planning and Design, 30, 251-271.
Landis, J. 1994. The California Urban Futures Model: A New Generation of Metropolitan Simulation Models.” Environment and Planning B: Planning and Design 21(4): 399-420.
Landis, J. & Zhang, M. 1998. The Second Generation of the California Urban Futures Model. Part 1: Model Logic and Theory. Environment and Planning A, 30, 657-666.
Landis, J. & Zhang, M. 1998. The Second Generation of the California Urban Futures Model. Part 2:
Specification and Calibration Results of the Land-Use Change. Environment and Planning B, 25, 795-824. Oguz, H., Klein, A., & Srinivasan, R. 2008. Predicting
Urban Growth in a US Metropolitan Area with No Zoning Regulation. International Journal of Natural and Engineering Science, 2(1), 9-19.
Pauleit, S., Roland, E., & Yvonne, G. 2005. Modeling the Environmental Impacts of Urban Land Use and Land Cover Change – A Study in Merseyside, UK. Landscape and Urban Planning, 71, 295-310. Seoul, Korea. http://english.seoul.go.kr/?Sid=101_01. Whitford, V., Ennos, A., & Handley, J. 2001. City form
and natural process – Indicators for the ecological performance of urban areas and their application to Merseyside, UK. Landscape and Urban Planning, 57, 91-103.
Yokohari, M., Takeuchi, K., Watanabe, T., & Yokota, S. 2002. Beyond greenbelts and zoning: A new